Research and development (R&D) statistics report on research and development activity, including expenditure and related employment across the business, government, and higher education sectors in Aotearoa New Zealand.
In 2023, the survey was conducted for the business sector only. The government and higher education sectors are surveyed every two years and will be included in the 2024 survey.
The R&D survey has been conducted by Stats NZ since 2006. However, due to major survey changes, only data from 2016 onwards is directly comparable.
Key facts
For the business sector in 2023:
- R&D expenditure reached $3.7 billion, up 17 percent from 2022
- the number of businesses performing R&D was 2,286, a decrease of 2.3 percent
- average R&D expenditure per business increased by $268,000 (20 percent), reaching $1.6 million in 2023
- R&D as a proportion of gross domestic product (GDP) rose from 0.87 percent in 2022 to 0.95 percent in 2023
- the number of full-time equivalent (FTE) staff working on R&D rose by 3.9 percent to reach 21,000
- 37 percent of businesses expect the amount of R&D they will undertake in the next financial year to increase, while 40 percent expect it to stay the same
- the main reason businesses performed R&D was to gain entry into new markets (33 percent).
Business sector R&D expenditure reaches $3.7 billion
In 2023, the business sector spent a total of $3.7 billion dollars on R&D, an increase of 17 percent from 2022. This annual percentage increase is the largest since 2018.
| Year | Business sector R&D expenditure |
| 2018 | 2134000000 |
| 2019 | 2427000000 |
| 2020 | 2731000000 |
| 2021 | 2867000000 |
| 2022 | 3132000000 |
| 2023 | 3672000000 |
| 1878000000 | 2390000000 |
|---|---|
| 2277000000 | 2578000000 |
| 2567000000 | 2895000000 |
| 2721000000 | 3014000000 |
| 2947000000 | 3316000000 |
| 3426000000 | 3918000000 |
Wages and salaries, which was $2.2 billion, was the largest contributor to R&D expenditure, making up 60 percent of total expenditure. This percentage has remained relatively stable over time.
Although R&D expenditure is not adjusted for inflation, movements in relevant price indexes suggest that the volume of R&D activity has increased over the past year.
Compared with the 17 percent change in R&D expenditure, between the March 2022 quarter and the March 2023 quarter, the movements were:
- labour cost index saw a 4.5 percent increase in all salary and wage rates for the private sector
- producers price index (inputs) saw an increase of 4.5 percent
- capital goods price index saw an increase of 9.2 percent.
Price indexes has more information on inflation.
Highest expenditure in the business sector was in the services industries
Businesses in the services industries contributed 70 percent of all R&D expenditure in 2023, around $2.6 billion.
The industry with the largest increase in R&D expenditure from 2022 was 'other services', up $218 million (34 percent). This industry includes electricity, gas, water and waste services, telecommunication services, and financial and insurance services.
Number of researchers working on R&D increased 23 percent
Total full-time equivalent staff working on R&D increased by 3.9 percent, to 21,000 employees. The majority of staff were researchers, with 14,000 staff, up 23 percent from 2022. In contrast, technicians decreased by 25 percent, to 5,200 staff. Support staff remained unchanged, at 2,000 staff.
| Year | Support staff | Technicians | Researchers |
| 2018 | 1600 | 4400 | 8000 |
| 2019 | 1700 | 4600 | 9100 |
| 2020 | 1900 | 5500 | 10000 |
| 2021 | 1900 | 6100 | 10000 |
| 2022 | 2000 | 7000 | 11000 |
| 2023 | 2000 | 5200 | 14000 |
Research and Development Survey 2023 - survey form has more information on staff roles.
Almost one-fifth of R&D activity was for information and communications purposes
When a business carries out R&D, it could be for the benefit of its own business, or for that of other businesses, industries, or sectors. This is also known as the purpose of research. Businesses were asked what percentage of their total R&D expenditure was to benefit each sector. This relates to the sector that will ultimately benefit from the results, not the nature of the R&D itself.
In 2023, the largest proportion of total R&D expenditure was for the purpose of:
- information and communication services, $664 million (18 percent)
- manufacturing, $564 million (15 percent)
- health, $509 million (14 percent)
- primary industries, $486 million (13 percent).
Over one-third of businesses expect their R&D to increase
Businesses were asked about what they would expect to happen to the amount of R&D they carry out or fund in their next financial year, as well as the reasons they undertook R&D.
Expectations of businesses' R&D activity in their next financial year were:
- stay the same (40 percent)
- increase (37 percent)
- decrease (13 percent)
- don't know (8 percent).
The reasons that businesses performed R&D were to:
- gain entry to new markets (33 percent)
- maintain position in the market (31 percent)
- become a dominant player (25 percent)
- catch up with key competitors (4 percent).
These proportions have remained relatively consistent over time.
Data updates
There were data updates made as part of the 2023 survey publication, affecting the 2019 to 2022 results. The updates and corrections were made due to updated respondent data and minor data processing errors.
These updates only affect the business sector figures.
Variables |
Years |
Internal expenditure |
2019-2022 |
Source of funds |
2019-2022 |
Purpose of research |
2019-2022 |
Type of research |
2019-2022 |
Current and capital R&D expenditure |
2019-2022 |
External expenditure |
2019, 2021, 2022 |
Expenditure as a proportion of GDP |
2022 |
Number of businesses |
2022 |
Personnel |
2022 |
Expenditure on R&D performed overseas |
2022 |
Expectations for the next financial year |
2022 |
Main reason for carrying out or funding R&D |
2022 |
Engagement with Callaghan Innovation, CRIs, or universities |
2022 |
All updates are noted with a revision flag on the affected series in the published tables, CSV files, and relevant Infoshare series.
Infoshare changes by date has more information on the data updates and the series affected.
Information about the survey
Research and development survey: 2023 was conducted for the business sector only. The government and higher education sectors are surveyed every two years and will be included in the 2024 survey.
The 2023 survey was conducted from August to December 2023, and businesses were asked to report on their latest financial year for which information was available as at August 2023.
A sample of 5,023 businesses was selected from a population of known R&D performers.
The R&D expenditure and personnel figures stated in this release refer to only internal R&D carried out within the business. External R&D expenditure is also collected in the survey and is available in the downloadable CSV file.
Sector and published industry breakdowns accord with the Organisation for Economic Co-operation and Development's (OECD) recommendations for international comparability . These may differ from sectors and industry definitions used in other Stats NZ releases (e.g., gross domestic product).
An exploration into research and development (R&D) expenditure - definitions and comparative data has more information on definitions of R&D.
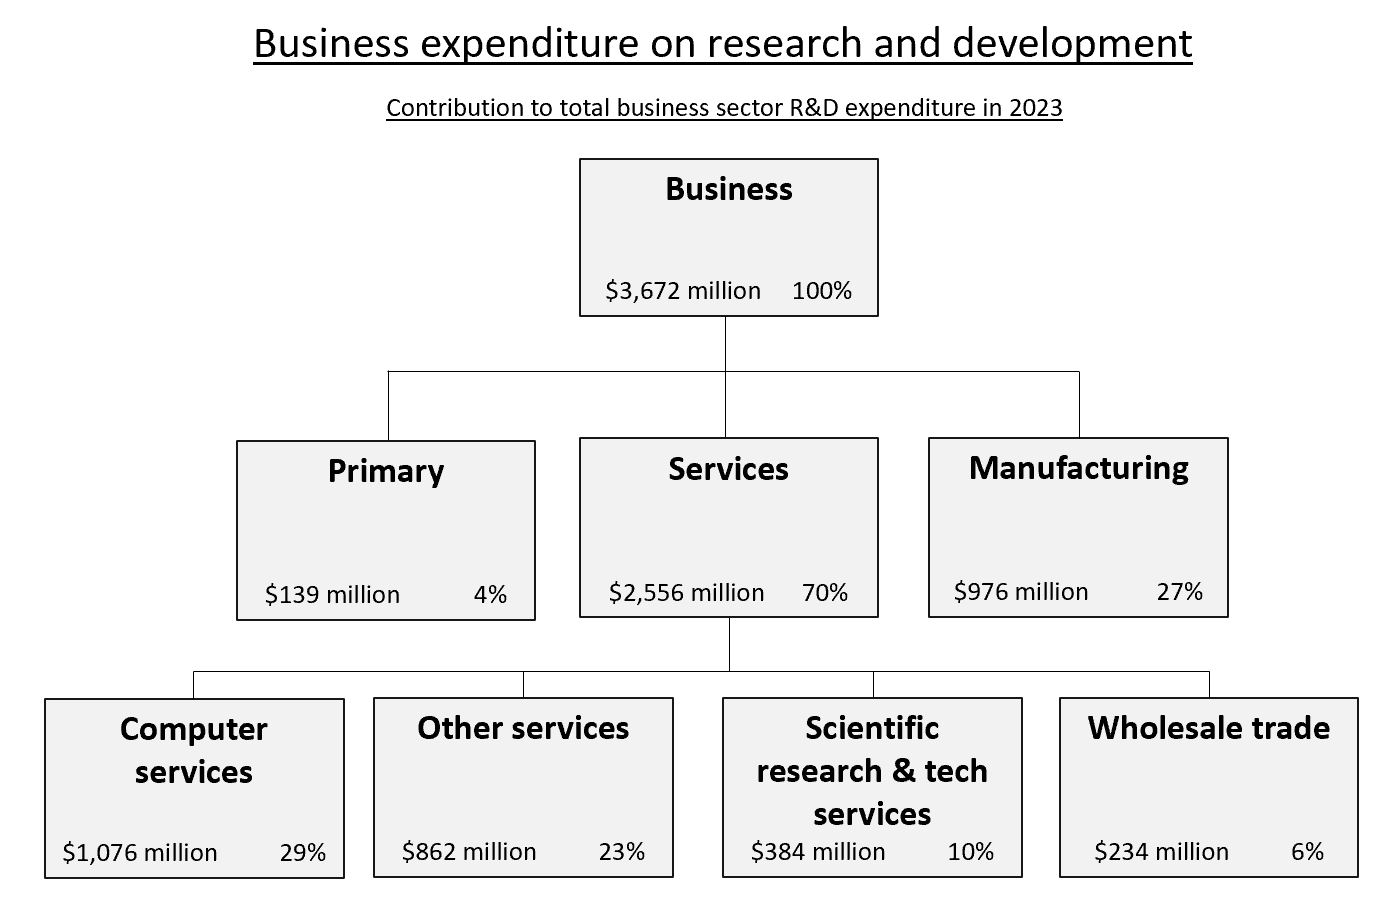
Text alternative for Business expenditure on research and development, contribution to total business sector R&D expenditure in 2023
Diagram shows sector contribution to total expenditure on research and development in 2023. Total business sector R&D expenditure $3,672 million, 100 percent. Primary industry group $139 million, 4 percent. Services industry group $2,556 million, 70 percent. Manufacturing industry group $976 million, 27 percent. Computer services $1,076 million, 29 percent. Other services $862 million, 23 percent. Scientific research and technical services $384 million, 10 percent. Wholesale trade $234 million, 6 percent.
More data
Use Infoshare to access the research and development survey time series.
Subject category: Industry sectors
Group: Research and Development survey - RAD
Definitions and metadata
Research and development survey - Survey series - DataInfo+ details the general methodology used to produce research and development statistics.
Research and development survey - Concepts - DataInfo+ details the definitions used to produce research and development statistics.
Research and development survey - 2023 Data collection - DataInfo+ details the methodology used for this release.
Technical enquiries
Rebecca Zhang
04 931 4600
[email protected]
ISSN 1178-0657
Next release
Research and development survey: 2024 will be released in 2025.


