29 September 2025: We have updated this guide to reflect a new version of Aotearoa Data Explorer.
This guide aims to help users effectively navigate and use Aotearoa Data Explorer to find, view, and extract data.
Aotearoa Data Explorer is a free online tool that presents data in a searchable, flexible, and dynamic way. It is an interactive web browser interface where you can view, query, and download data.
We also have:
- Quick start guide to Aotearoa Data Explorer - shorter version of this guide highlighting the most commonly used features
- Aotearoa Data Explorer tutorial videos on YouTube - step-by-step help
- News about Aotearoa Data Explorer - updates about the tool and the data currently available. Note that not all Stats NZ data is available on Aotearoa Data Explorer.
Contents
Introduction to Aotearoa Data Explorer
Use recommended browsers
Pop-up questionnaire
Find data
Explore data
Save and share table views
Download data
Common problems when viewing files in Excel
Metadata
Enable accessibility
Troubleshoot issues
Use the API
Contact us
Introduction to Aotearoa Data Explorer
Aotearoa Data Explorer is a tool that allows you to:
- search and discover detailed statistics about New Zealand's economy, society, and environment
- filter and customise data to your own requirements
- generate custom tables and charts
- view detailed metadata alongside the data
- export data in a range of formats such as Excel and CSV
- bookmark and share your custom data tables
- automatically generate API calls to pull data into your system.
Overview of Aotearoa Data Explorer on YouTube provides a video introduction to the tool.
Disclaimer
Performance and availability may be affected during periods of high use. Stats NZ monitors the service and will work to resolve any issues as soon as possible.
Use recommended browsers
Aotearoa Data Explorer works best in Chrome or Edge. Some functionality may not work as expected in other browsers.
Pop-up questionnaire
When you open Aotearoa Data Explorer, you may see a pop-up box with a question. The question may change over time.
By sharing your feedback, you help us design our products and services to suit you better. We use the survey results to refine our data offerings and ensure they are more closely aligned with our customers' needs.
Find data
There are two ways to find data from the Aotearoa Data Explorer homepage:
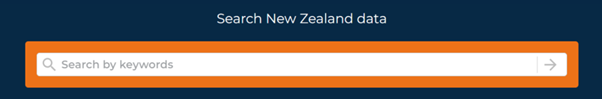
- search for data by entering keywords in the search field on the homepage
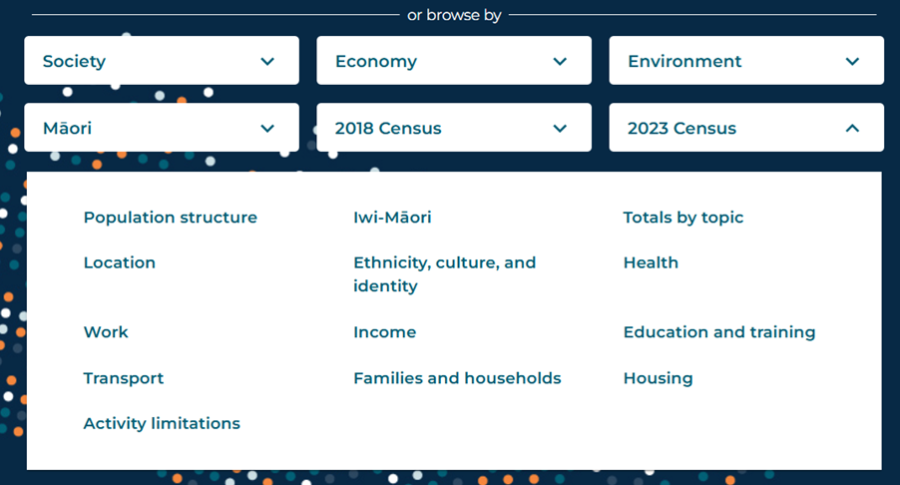
- browse for data by expanding a topic under the 'browse by' option.
You can also access data directly from links shared by Stats NZ or others.
How to find data in Aotearoa Data Explorer on YouTube provides a video tutorial.
Search for data
Data can be searched using one or several keywords, or exact phrases, in the search box. Exact phrases must be entered within double quote marks, for example, "ethnic group".
Search results will include all tables that contain the keyword in the table title, dimensions, filters, or overview information. The search may also look for synonyms of the terms you entered.
Browse for data
Use the 'browse by' menu to browse for data.
Select a topic from the dropdown list. The topic will expand to show subtopics in the box below. Select a subtopic to show a list of related tables.
Refine your search or browse results
The search or browse results show a list of tables. You can expand the overview of each table by selecting the down arrow to the right of the table title. This will display more information, including the dimensions, topics, and last updated date.
Use the 'Sort' function in the top-right corner to sort your results by relevance, alphabetically, or by last updated.
The 'Refine your search' menu on the left allows you to narrow results to tables with the specific data you want. The number of filters initially displayed in the left-hand menu is limited. Select 'More filters' below the list to see them all.
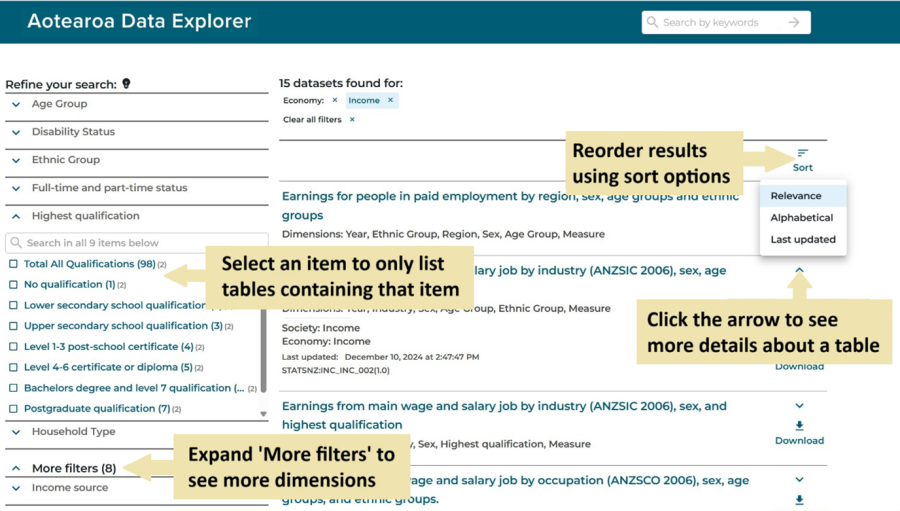
Click on the down arrows for a dimension (for example, Highest qualification) to show its items (for example, Postgraduate qualification). Select one or more items you want in your table.
Your results are automatically updated when you add or remove filters, showing only tables that contain the items selected.
To remove a filter, click the 'X' next to it in the applied filters shown above the list of tables.
View a table
Once you have identified a table of interest, click its title in the results to open the table view and access options to customise, graph, and download data.
Explore data
The initial view of a table is usually filtered by default. You can modify the table to show a different selection of data, change the table layout, or view the data in a chart.
How to view data in Aotearoa Data Explorer on YouTube provides a video tutorial.
Initial view
The initial view shown for a table will depend on how the table was accessed. A default initial view set by Stats NZ will show except in the following cases.
If you open a table from a link shared by Stats NZ or others, it will show any customisation they have applied.
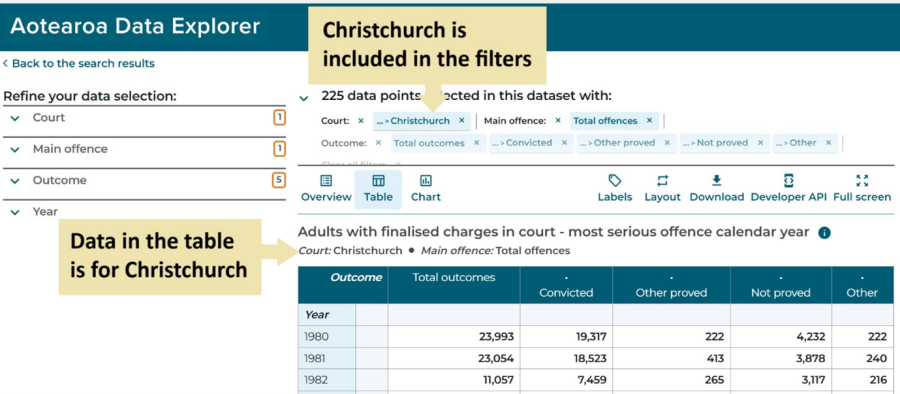
If you open a table from search results after using 'Refine your search', or if your search term matches an item in the table, the displayed table will be filtered to the item(s) matched to your search. For example, a search for 'Christchurch' will initially show data for the 'Christchurch' item in the 'Court' dimension in the image below.
Any initial view can then be changed.
Filter the data
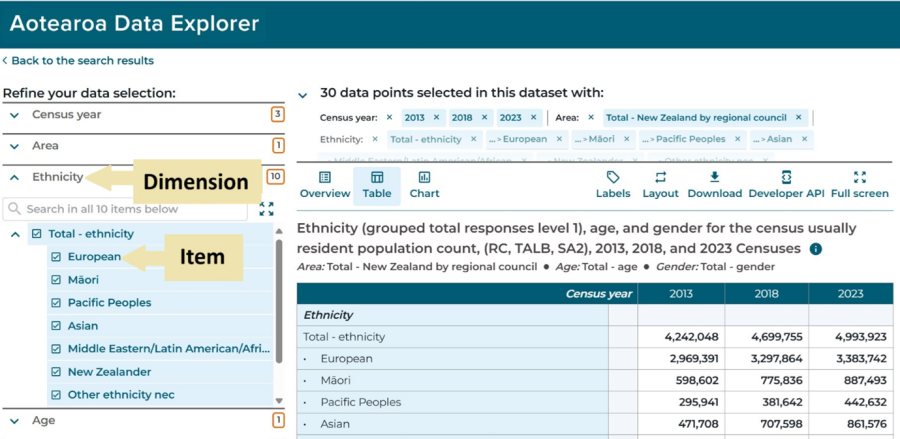
Use the 'Refine your data selection' menu to the left of the table to change what is displayed, choosing from a predefined list of dimensions and items.
You can select or deselect items to choose which are shown in your table. You can use Ctrl+click and Shift+click to select or deselect multiple items at once.
Your view of the data will automatically update every time you change the filter. Be patient, as further selections or deselections may not apply while the view is updating. If you notice that a selected item is not showing in the table, deselect and select it again.
If no items are selected for a dimension, the filter will include all items by default.
If any items listed are greyed out and not selectable, this means the data has not yet been released for that item.
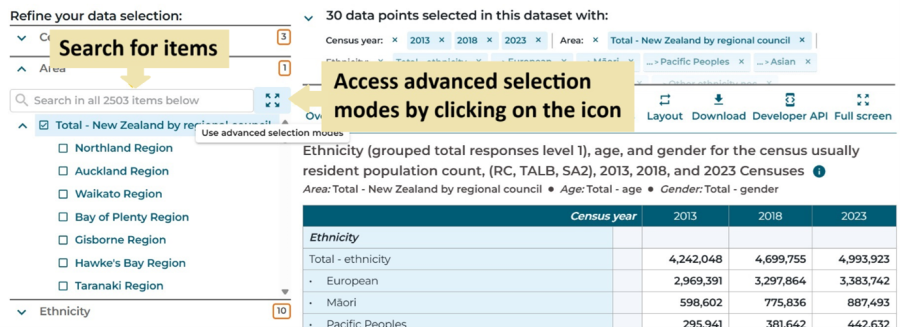
Dimensions with eight or more items offer additional ways to find and select items. Just below the dimension name is a search box and an icon with four arrows.
The search box allows you to search for specific items.
The icon with four arrows opens an 'Advanced selection mode' window, which offers various ways to select or deselect multiple items, particularly if items are in a hierarchy. This can be easier than selecting items on the table screen.
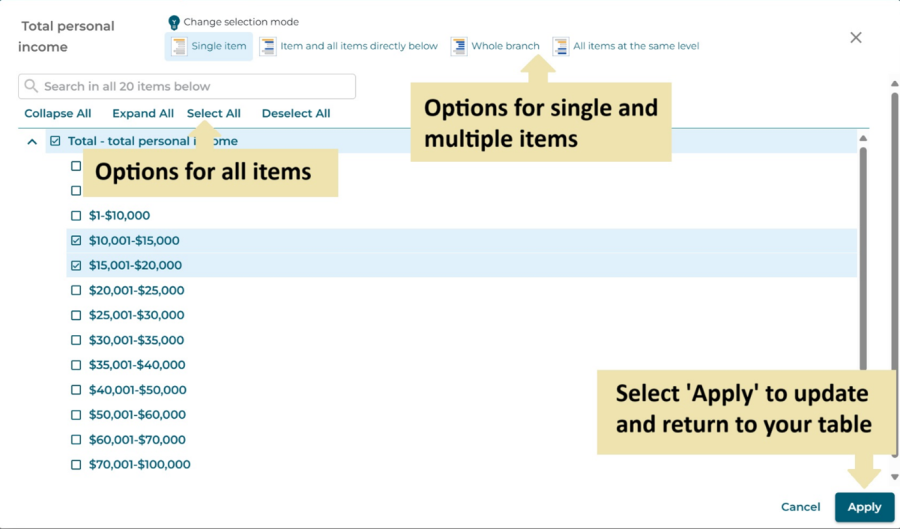
In the 'Advanced selection mode' window there are options to Collapse All, Expand All, Select All, or Deselect All just above the list of items. The Deselect All option can be useful to clear all currently selected items before choosing what to include in a table.
Additional selection modes are available at the top of the screen:
- Single item lets you select or deselect one item at a time
- Item and all items directly below selects the item you click plus all its sub-items from the next lowest level of a hierarchy
- Whole branch selects the item you click plus all its sub-items from all lower levels of a hierarchy
- All items at the same level selects all items at the same level of a hierarchy as the item you click.
Once you have finished making selections in the 'Advanced selection mode' window, select the 'Apply' button in the bottom right to update and return to your table.
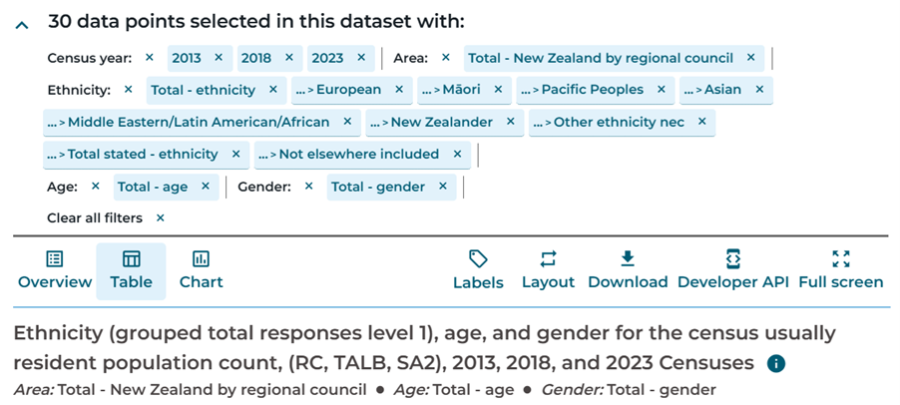
Another way to view or remove applied filters is in the panel above the table. Currently included items are listed and can be removed by clicking the 'X' next to their label.
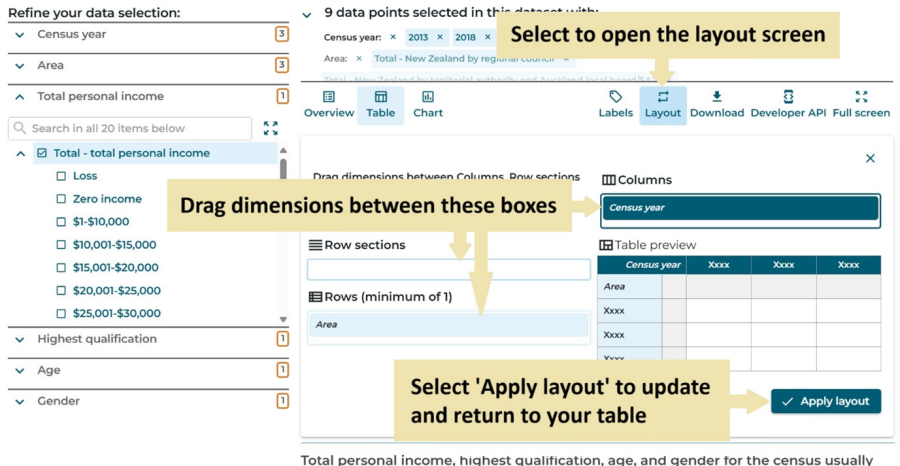
Customise the table layout
Click the 'Layout' button at the top of the table view to customise your table layout. You can drag dimensions between columns, row sections, and rows.
Check the preview of your table to see how the changes will look, then click 'Apply layout' to update your customised data table.
Show the table in full-screen
Select the 'Full-screen' option above the table to remove the Aotearoa Data Explorer banner and the filters on the left-hand side so more of the table can be shown.
Display labels as names or codes
Row and column labels within the table are displayed as names by default. If you want to show codes (identifiers) instead, or both codes and names, use the 'Labels' option above the table.
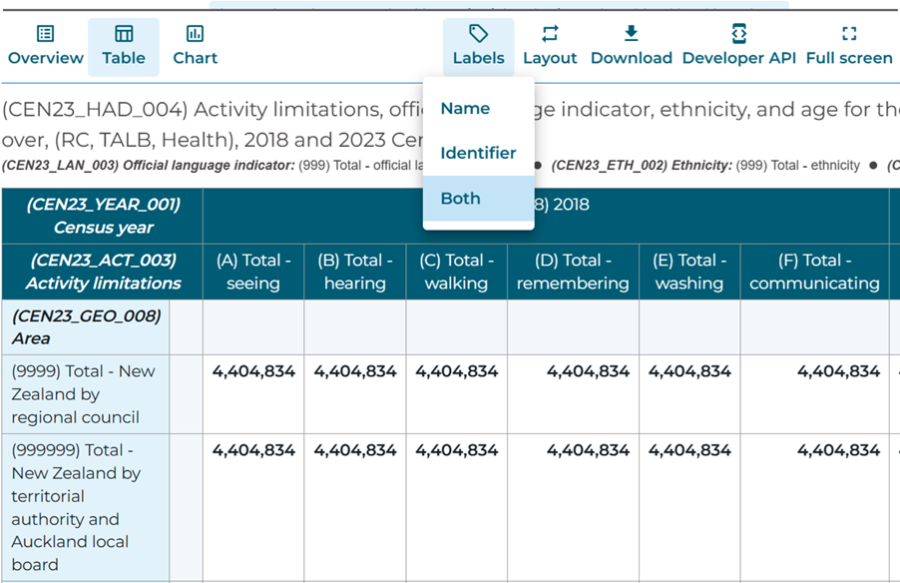
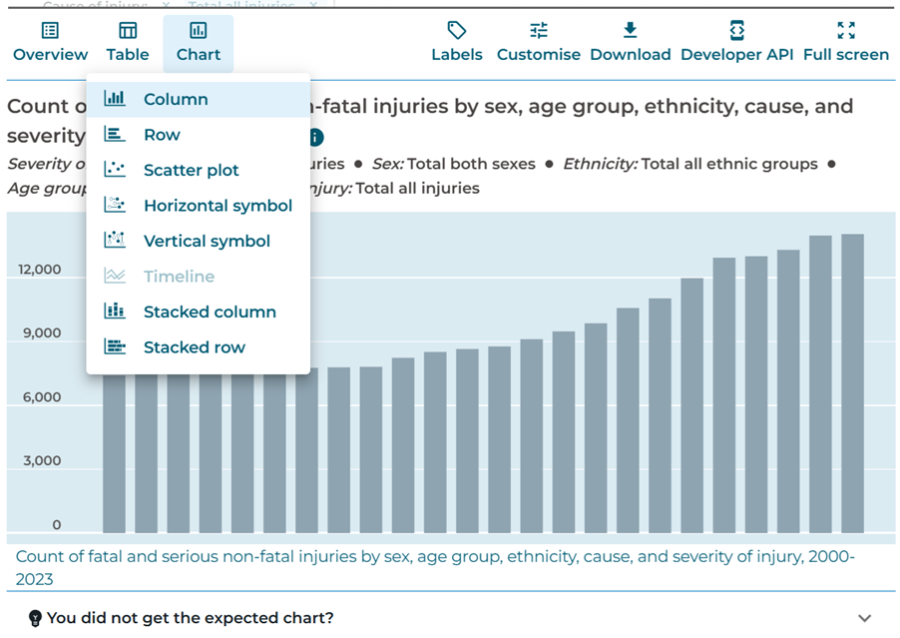
Chart function
You can also visualise data in Aotearoa Data Explorer using the chart function.
Click 'Chart' above your table title and select the type of chart you want to view.
Use the 'Filters' menu to select the data you want to visualise.
The 'Customise' menu provides options to customise the look and functionality of your chart. This includes chart size, axis values, and highlighting data.
Use the 'Download' button to save your chart as a picture.
Expand the 'You did not get the expected chart?' section below the chart for chart-specific help in Aotearoa Data Explorer.
Save and share table views
To return to a table later or to share it with others, use the URL from your web browser. This will reopen the table with any customisation you have applied.
Download data
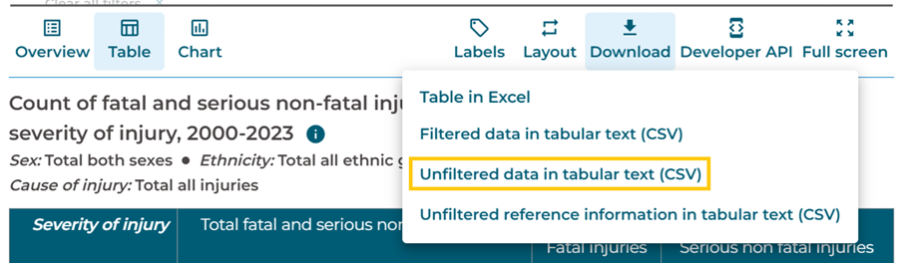
You can download data from Aotearoa Data Explorer as Excel, filtered CSV, and unfiltered CSV files. Download options are shown by selecting 'Download' above the table.
Download data in Aotearoa Data Explorer on YouTube provides a video tutorial.
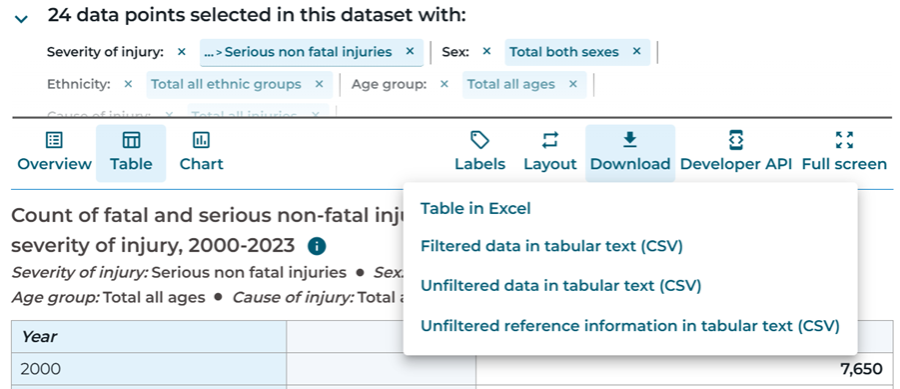
Table in Excel ‒ download an Excel XLSX file with the same view of data as your on-screen Aotearoa Data Explorer table. Excel downloads include the table's URL in the bottom right of the 'Table' tab, and an 'Overview' tab with table descriptions. If more than 8,000 cells are selected, some data may be missing from the file (a warning message will be shown above the table in Aotearoa Data Explorer).
Filtered data in tabular text (CSV) ‒ download a comma separated values (CSV) file with the data you selected for your Aotearoa Data Explorer table. This data is in long-format with one row per data point.
Unfiltered data in tabular text (CSV) ‒ download a comma separated values (CSV) file with all data available for the table, not just your selection. This data is in long-format with one row per data point. Note: Large datasets may take a long time to download (see Download unfiltered CSV files for very large datasets if you encounter any issues).
Unfiltered reference information in tabular text (CSV) - download a comma separated values (CSV) file containing metadata, such as footnotes, definitions, and data quality notes.
Additional download options are available for some tables. For example, selected 2023 Census 'totals by topic' tables include an option to download Unfiltered data in wide format (CSV). These files have data points in rows and columns (multiple data points per row) rather than one row per data point as in the CSV options above, making the file size smaller and possible to view in Excel.
Common problems when viewing files in Excel
Files with more than 1 million rows
Downloaded files with more than 1 million rows will be too big to fully display in Excel. In this case either use other software to view the file, or download a smaller file by filtering the table and using a 'filtered' download option.
Macrons displaying incorrectly
Macrons on letters in a CSV file may display incorrectly if opened in Excel.
To display macrons correctly in Excel, open the CSV file using the following menu options:
- Data
- Get Data
- From File
- From Text/CSV
- Select the downloaded file from the file explorer pop-up.
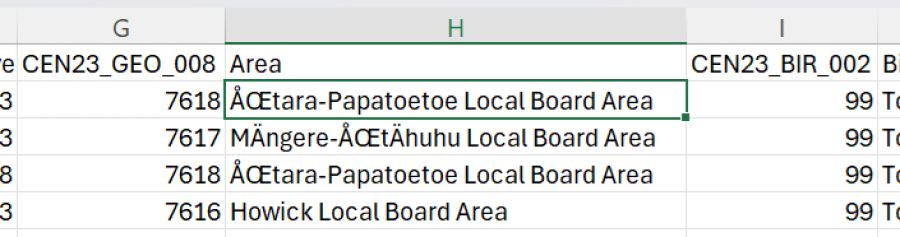
Leading zeroes being removed from codes
Opening CSV files in Excel may remove leading zeroes in codes, or show a message asking whether they should be removed. For example, the code '001' for Northland region will become '1' if leading zeroes are removed.
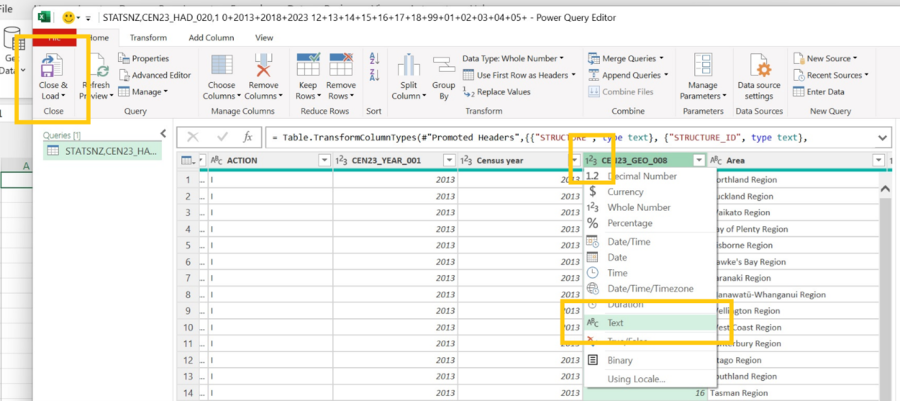
If the loss of leading zeroes is a problem, open the CSV file in Excel using the same menu path as described above for macrons, and:
- after selecting the file, choose 'Transform' in the bottom-right of the preview screen
- go to the affected variable and click the '123' icon to the left of its label
- select 'Text' from the drop-down box
- select 'Replace current' in the resulting pop-up
- select 'Close & Load' in the top-left of the window.
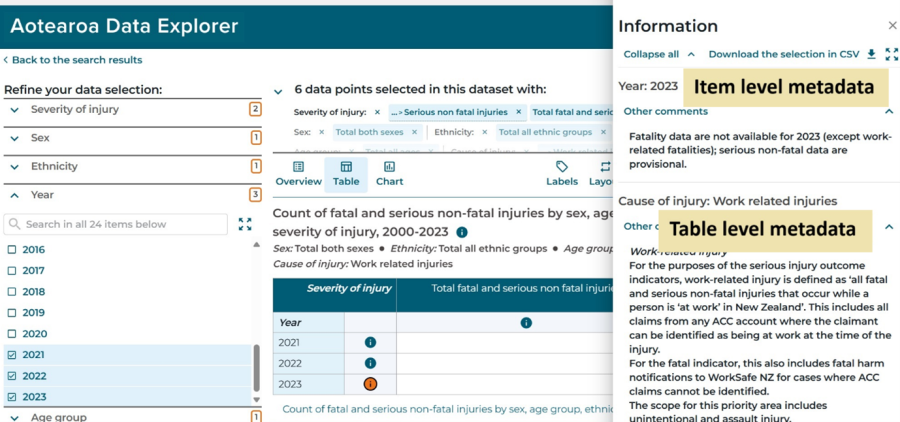
Metadata
Metadata is information about the data, such as footnotes, definitions, and quality notes. Metadata is available at the following levels:
- table
- item
- data point.
Where metadata is available for a table or item, an (i) symbol will show next to the table or item name. A data point with associated metadata will have a symbol or letter beside it, for example * or 's'.
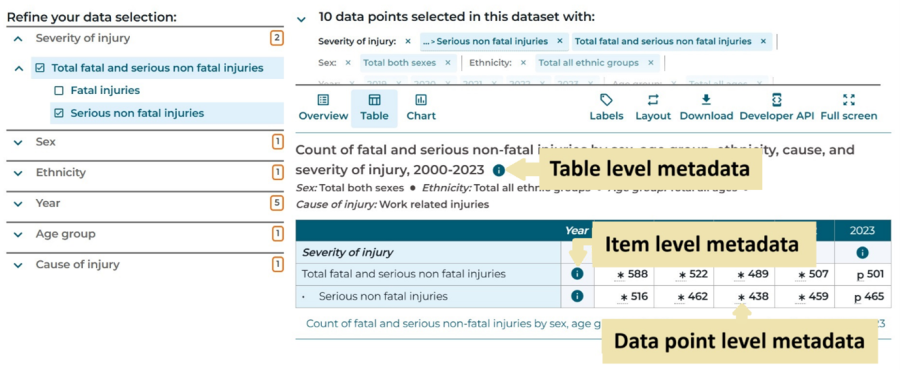
Table level
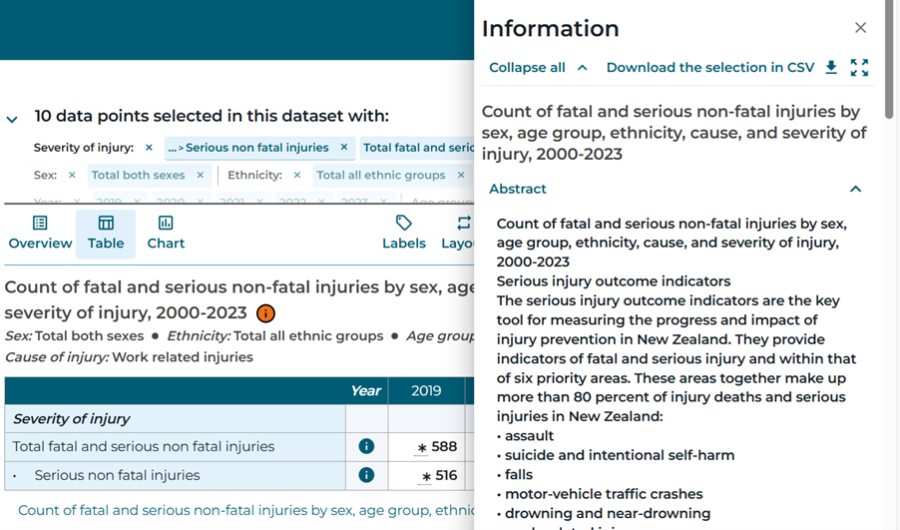
Click the (i) icon next to the table title to see information about the table in a side panel.
Note: Metadata at dimension level is included at table level. For example, metadata is available here for the sex, ethnicity, year, age group, cause of injury, and severity of injury dimensions.
Item level
Click the (i) icon at the item level to see information about the item in a side panel.
Note: The table information will be displayed below the item information in the side panel.
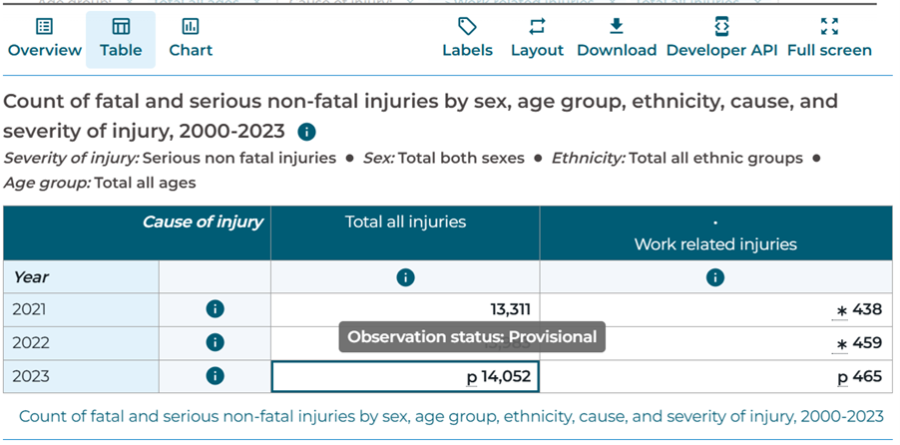
Data point level
Hover your mouse over a cell to see metadata for individual data points.
Download metadata
There are two ways to download metadata.
All metadata for a table can be downloaded by clicking the 'Download' icon above a table and selecting the Unfiltered reference information in tabular text (CSV) option.
Alternatively, the side panel includes a Download the selection in CSV button above the content.
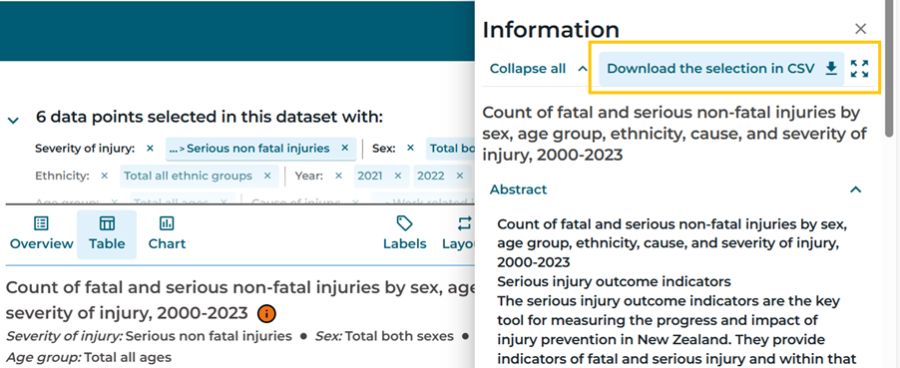
The metadata notes are in HTML format within the downloaded CSV file.
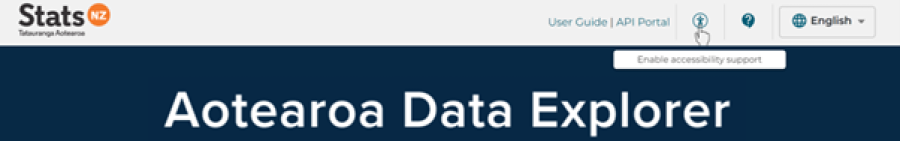
Enable accessibility
Aotearoa Data Explorer includes support for assistive technology such as screen readers. The 'Enable/Disable accessibility support' button is located at the top right of the screen and should be the first item a screen reader reads.
With this feature enabled, the data table view and its 'Customise' panel become accessible to screen readers.
When in the table view, you can use the Tab key on your keyboard to navigate through each cell and read its content.
In the 'Customise' panel, you can use the Tab key to navigate through the table axes (Rows, Columns, or Row sections) and dimensions to change the table layout:
- use spacebar or enter key to select/deselect a dimension
- use left and right arrow keys to move a dimension between axes
- use up and down arrow keys to re-order dimensions within an axis.
Troubleshoot issues
Empty table cells or missing rows and columns
Aotearoa Data Explorer cannot display more than 8,000 data points in a table. If you exceed this limit, some cells may appear empty even though data is available, or the table may not include all rows or columns. A warning (highlighted in orange) under the table title will alert you if you exceed the 8,000 data point limit.
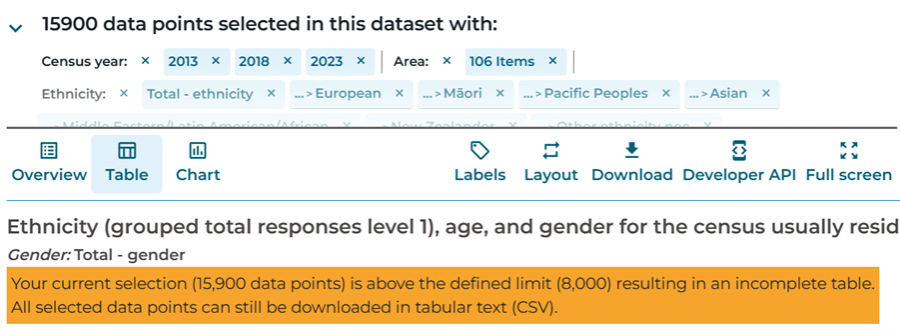
We recommend downloading the full dataset as a CSV by clicking 'Unfiltered data in tabular text (CSV)'.
Alternatively, you can use filters to reduce your data selection to fewer than 8,000 data points. Use the 'Filters' menu on the left to select less data, for example, by reducing the number of time periods or age groups selected. See Filter the data for more information.
Download unfiltered CSV files for very large datasets
'Unfiltered data in tabular text (CSV)' downloads may take a long time if the table has a large amount of data, or due to other factors such as internet speed and device capabilities.
A large file with 71 million data points could be around 14GB and can take many minutes to download.
For example:
- a dataset with 344,000 data points produces a file of about 42.5MB, which takes approximately 2 minutes to download
- a dataset with 24 million data points produces a file of about 3.35GB, which takes approximately 20 minutes to download.
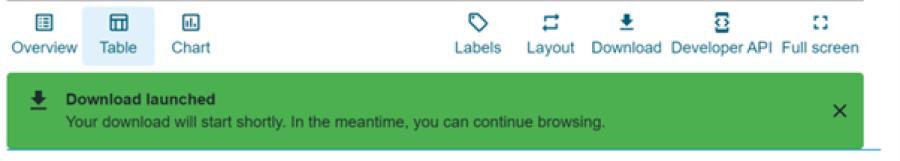
During the download process, a warning message will be displayed - you can close this warning and continue interacting with Aotearoa Data Explorer.
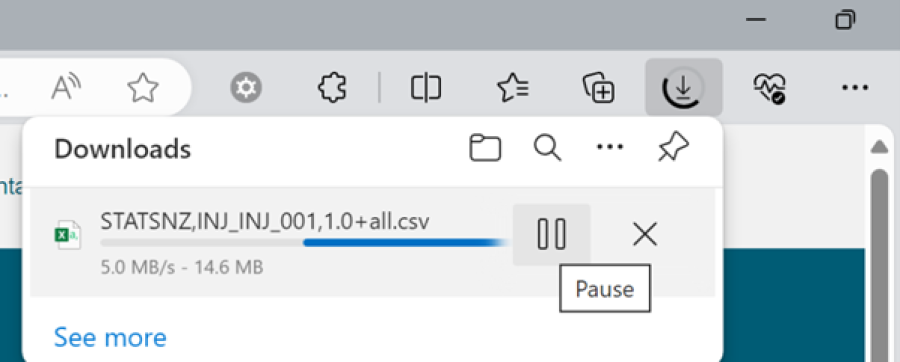
Download progress can be viewed in the normal way depending on your browser. For example, in Microsoft Edge, select 'Download' next to the browser search bar. Alternatively, check your 'Downloads' folder in Windows File Explorer.
Use filters to select a subset of all data and download it as 'Filtered data in tabular text (CSV)' to reduce file size and download time.
If a connection failure occurs during the download, a 'Network Error' will be reported. The download needs to be restarted once the connection is restored.
URL too long for a large selection of filters
The URL of a table contains details of the current filter selection so the table view can be shared or bookmarked as displayed on screen. If too many items are selected, the URL becomes too long to share or bookmark and a warning message will pop up. For example, this occurs if all Statistical Area 2 items are selected at once.
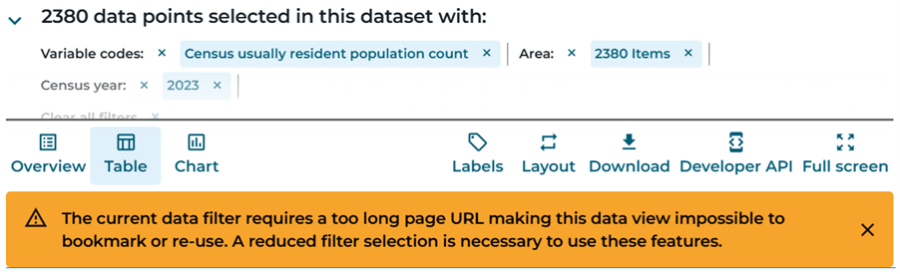
The table URL will not be accessible when this message appears. Attempting to open the URL will display an error message (for example, in Chrome: 'This site can't be reached'). Data can still be downloaded, but if you wish to share or bookmark the table URL, you will need to reduce the filter selection.
Use the API
Introduction
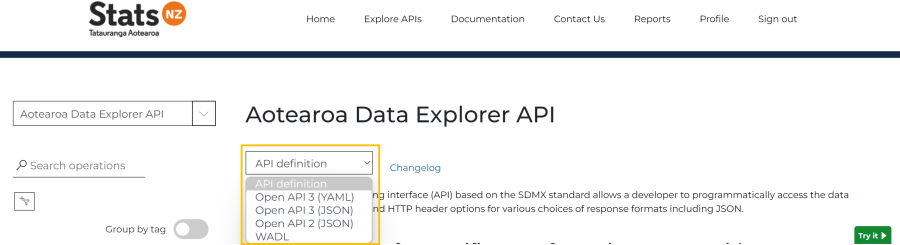
All statistics in Aotearoa Data Explorer are also available via Application Programming Interface (API). The Aotearoa Data Explorer API is based on the SDMX standard and allows a developer to programmatically access the data using simple RESTful URL and HTTP header options for various choices of response formats including JSON.
Stats NZ strives to maintain availability of the API, but we cannot guarantee uninterrupted service. The performance and availability of the API may be affected during periods of high usage, maintenance activities, or unforeseen technical issues. In the event of any issues, Stats NZ will work to resolve them as soon as possible.
The API service may be subject to change.
Authentication
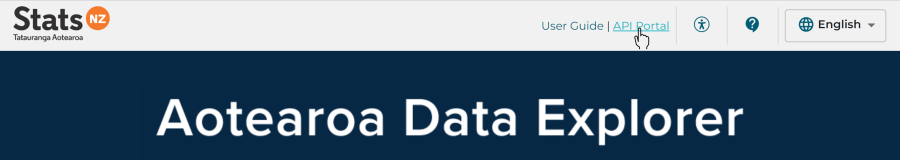
To use the Aotearoa Data Explorer API please visit the API Portal and sign up for an account. By registering, you will be able to subscribe to the Aotearoa Data Explorer 'Product' and generate subscription keys for your API calls.
Your account will allow you to view, manage, and monitor your subscription keys, including revoking or regenerating keys as needed.
Furthermore, the portal provides API usage reports, enabling developers to monitor their data consumption and optimise their usage patterns. This all-in-one platform is tailored to meet the needs of developers seeking to leverage the powerful data resources available through the Aotearoa Data Explorer API. Developers can effectively integrate the Aotearoa Data Explorer product into applications, leveraging its data extraction capabilities to streamline workflows.
For detailed documentation and additional resources, please visit the Documentation section in the API Portal.
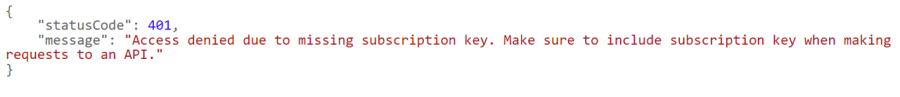
When making API calls from your applications and systems, you will need to provide your subscription key in the HTTP request header 'Ocp-Apim-Subscription-Key'.
If making API call without the subscription key, 'status code: 401' will be reported.
Generating API calls
The Aotearoa Data Explorer REST API enables you to access Stats NZ data in Aotearoa Data Explorer via API GET requests.
Base URL
This service only responds to a single GET method: https://api.data.stats.govt.nz/
URL templates
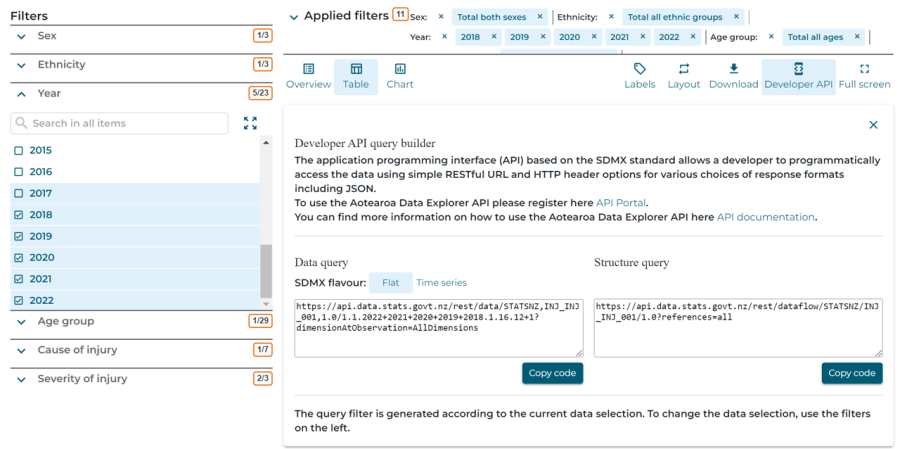
Aotearoa Data Explorer generates API query templates for the data selected in your table.
Select 'Developer API' at the top right of the screen to view API queries for your selection.
- 'Data query' will return the exact data from your Aotearoa Data Explorer table.
- 'Structure query' will return the structural metadata for the table you are viewing.
Request format
You can customise your API query to return the data or metadata you are interested in and in the format you want.
The Aotearoa Data Explorer REST API is fully compliant with SDMX 2.1 - the Statistical Data and Metadata Exchange information model . The SDMX-REST Guide is available on GitHub.
Data and metadata collected from SDMX APIs can be retrieved using different syntaxes, by specifying the appropriate parameters. Different types of SDMX content that can be retrieved:
- data
- structural metadata.
Here is a quick reference description of the most frequently used syntax and parameters for the SDMX API derived from the full SDMX cheat sheet of the SDMX RESTful API 1.5 standard with examples added in the Aotearoa Data Explorer context and unsupported elements removed.
Legend: Mandatory path parameter / Optional path parameter / Query string parameter (all optional)
Data queries
https://api.data.stats.govt.nz/rest/resource/flowRef/key?queryStringParameters
Parameter |
Description |
Default |
Mandatory path |
https://api.data.stats.govt.nz/rest/resource/flowRef |
|
resource |
data |
|
flowRef |
Dataflow reference in a format AGENCY,ID,VERSION (for |
|
Optional path |
/key |
|
key |
Query coordinates of the data. The coordinates are the |
|
Query string |
?queryStringParameters |
|
dimensionAtObservation |
The Id of the dimension attached at the observation level. Options are:
|
AllDimensions |
detail |
Desired amount of information to be returned. |
full |
Structural metadata queries
https://api.data.stats.govt.nz/rest/resource/agencyID/resourceID/version?queryStringParameters
Parameter |
Description |
Default |
Mandatory path |
https://api.data.stats.govt.nz/rest/resource |
|
resource |
The type of artefact to be returned. Values: datastructure, categoryscheme, conceptscheme, |
|
Optional path |
/agencyID/resourceID/version |
|
agencyID |
Agency maintaining the artefact (for example, STATSNZ) |
STATSNZ |
resourceID |
Artefact ID (for example, AGR_AGR_002) |
|
version |
Arterfact version (for example, 1.0) |
1.0 |
Query string |
?queryStringParameters |
|
detail |
Desired amount of information. Values: allstubs, referencestubs, referencepartial, full |
full |
references |
References to be returned with the artefact. Values: none, all, any type of resource |
all |
Response format
Data is available in XML, JSON, and CSV.
Metadata is primarily available in XML. Some metadata is also available in JSON - you can view the availability of this in the API definition on the Aotearoa Data Explorer API product page in the API portal.
You can specify the response in the API URL using the 'format' query parameter:
- XML: 'format=xml'
- Structure-specific XML (good for time series): 'format=structurespecificdata'
- JSON: 'format=jsondata'
- CSV: 'format=csvfile'
Contact us
If you have a question or feedback about our data tools, contact our Information Centre.
- Phone (toll free within New Zealand): 0508 525 525
- Phone (from outside New Zealand): +64 4 931 4600
- Email: [email protected]
- Online form: online contact form.


