In the June 2020 quarter, the seasonally adjusted unemployment rate fell to 4.0 percent, down from 4.2 percent last quarter, while underutilisation rose, Stats NZ said today.
In the June 2020 quarter:
- unemployment rate fell to 4.0 percent
- underutilisation rate rose to 12.0 percent
- hours worked fell a record 10.3 percent
- the number of people not in the labour force rose 37,000
- the number of employed people fell 11,000
- the wage subsidy scheme was in place from 17 March 2020.
With the country in COVID-19 lockdown when the quarter began, fewer people who did not have a job were actively seeking work. People who were not actively seeking work were not counted as unemployed, resulting in a fall in the unemployment rate. However, many of these people were captured as underutilised.
"Underutilisation - a broader measure of spare capacity in the labour market - and hours worked provide a more detailed picture of New Zealand's labour market than the unemployment rate alone. This quarter, underutilisation rose from 10.4 percent to 12.0 percent - the largest quarterly rise since the series began, while hours worked were down by over 10 percent - another record," labour market and household statistics senior manager Sean Broughton said.
Unemployment requires active search for work
To be counted as unemployed, a person must have been actively seeking work in the last four weeks or be due to start a new job in the next four weeks. Actively seeking work means going beyond browsing job vacancies. It means the person is going beyond browsing, for example, by applying for jobs (by submitting their CV) or contacting employers.
The number of officially unemployed people varies from the number of Jobseeker Support recipients published by the Ministry of Social Development due to definitional differences.
"At the end of June, there were around 39,000 more recipients of Jobseeker Support than at the end of March, but Jobseeker Support recipients are not necessarily unemployed," Mr Broughton said.
"Some people who receive Jobseeker Support might work part-time and are therefore employed. Other recipients will not have work obligations. If these people are not actively seeking work or were not available to start work had a job been available, they will be counted as not in the labour force."
Unemployment rate higher during alert level 1
The official unemployment rate of 4.0 percent is an average across the 13 weeks in the June 2020 quarter. Stats NZ does not typically publish the unemployment rate for shorter periods than a quarter, such as monthly or weekly, as these measures are subject to a greater level of variability and uncertainty. However, they can help us understand quickly changing environments, such as COVID-19 alert levels.
As the quarter progressed, and New Zealand moved through COVID-19 alert levels, the unemployment rate rose. In the earlier weeks of the quarter, when the country was in alert level 4, the unemployment rate was slightly less than three percent. Towards the end of the quarter, when alert level 1 was in place, the unemployment rate rose to nearly five percent. These rates have not been seasonally adjusted.
"During the June 2020 quarter, some people weren't actively seeking work due to the COVID-19 lockdown. Near the end of the quarter, the unemployment rate may have increased because more people sought work as New Zealand moved down the alert levels and restrictions were eased," Mr Broughton said.
| Alert level | Unemployment rate |
| 4 | 2.7 |
| 3 | 3.2 |
| 2 | 4.3 |
| 1 | 4.9 |
| 2.1 | 3.4 |
|---|---|
| 2.7 | 3.8 |
| 3.6 | 4.9 |
| 4.4 | 5.5 |
Underutilisation rises
The seasonally adjusted underutilisation rate rose to 12.0 percent this quarter, up from 10.4 percent last quarter. This was the largest quarterly rise since the series began in 2004.
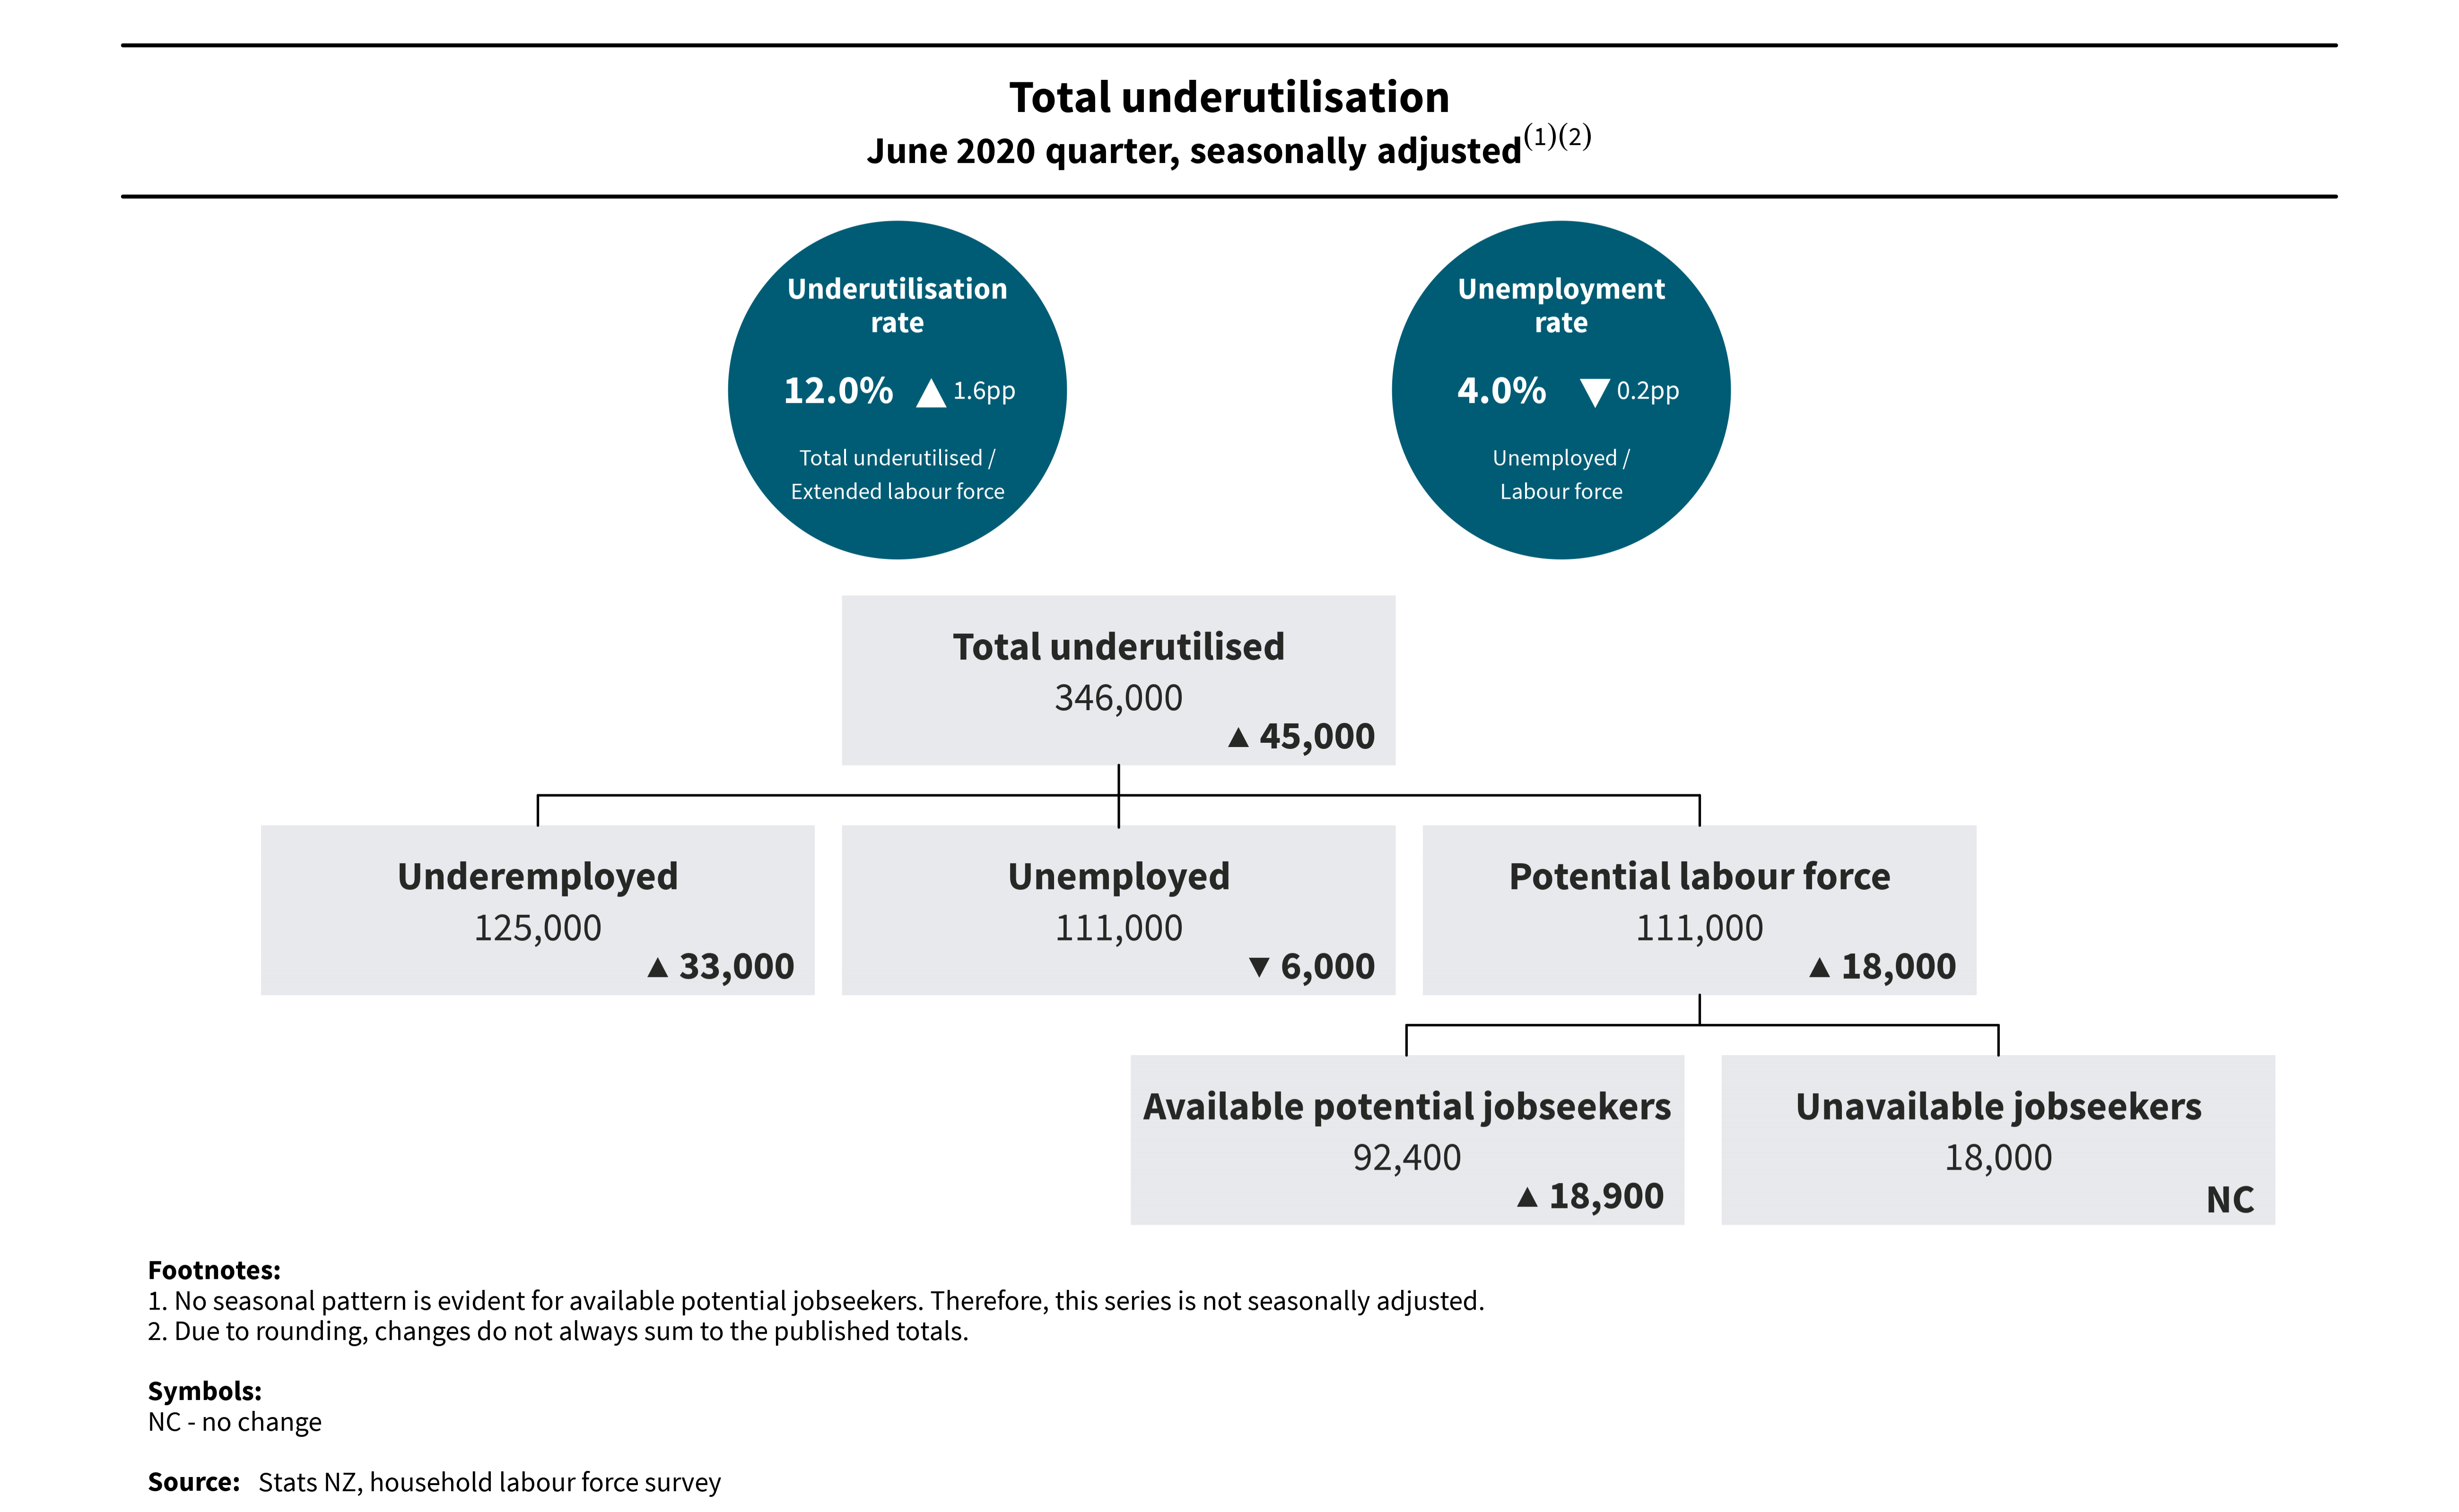
Text alternative for diagram Total underutilisation, June 2020 quarter, seasonally adjusted.
In addition to looking at people who are unemployed, underutilisation also includes three other groups of people in the labour market:
- underemployed - those who are employed part time (working fewer than 30 hours a week) and have both the desire and availability to increase the number of hours they work
- available potential jobseekers - people who would like a job but are not currently actively seeking one; for example, a university student who has just graduated and wants a job but is not actively applying for one yet
- unavailable jobseekers - people who are currently looking for a job but are not available to start quite yet; for example, a mother who has recently been looking after a child and in the next month will be able to start working again.
Available potential jobseekers and unavailable jobseekers make up the potential labour force. These people are not in the labour force.
This quarter, the number of unemployed people fell. At the same time, the number of underemployed people rose by 33,000 and available potential jobseekers rose by 18,900.
"Many businesses were faced with financial pressure because of temporary COVID-19 related closures. They may have cut workers' hours of pay in response and only ended their employment as a last resort," Mr Broughton said.
"This reduction in hours could have been one factor for the rise in underemployment this quarter."
| Quarter | Underemployed | Potential labour force | Unemployed |
| Mar-04 | 68000 | 74000 | 89000 |
| Jun-04 | 63000 | 66000 | 87000 |
| Sep-04 | 65000 | 69000 | 82000 |
| Dec-04 | 71000 | 68000 | 80000 |
| Mar-05 | 56000 | 69000 | 83000 |
| Jun-05 | 63000 | 67000 | 83000 |
| Sep-05 | 54000 | 70000 | 83000 |
| Dec-05 | 63000 | 64000 | 82000 |
| Mar-06 | 51000 | 63000 | 90000 |
| Jun-06 | 54000 | 62000 | 82000 |
| Sep-06 | 53000 | 63000 | 86000 |
| Dec-06 | 77000 | 77000 | 84000 |
| Mar-07 | 65000 | 78000 | 87000 |
| Jun-07 | 68000 | 80000 | 81000 |
| Sep-07 | 64000 | 65000 | 80000 |
| Dec-07 | 69000 | 69000 | 75000 |
| Mar-08 | 68000 | 88000 | 85000 |
| Jun-08 | 65000 | 83000 | 86000 |
| Sep-08 | 68000 | 87000 | 92000 |
| Dec-08 | 77000 | 91000 | 101000 |
| Mar-09 | 82000 | 94000 | 113000 |
| Jun-09 | 91000 | 104000 | 131000 |
| Sep-09 | 103000 | 109000 | 140000 |
| Dec-09 | 95000 | 115000 | 149000 |
| Mar-10 | 79000 | 110000 | 134000 |
| Jun-10 | 82000 | 107000 | 150000 |
| Sep-10 | 91000 | 104000 | 138000 |
| Dec-10 | 83000 | 110000 | 142000 |
| Mar-11 | 89000 | 112000 | 138000 |
| Jun-11 | 93000 | 109000 | 140000 |
| Sep-11 | 83000 | 109000 | 137000 |
| Dec-11 | 85000 | 107000 | 139000 |
| Mar-12 | 90000 | 106000 | 147000 |
| Jun-12 | 92000 | 120000 | 148000 |
| Sep-12 | 94000 | 132000 | 156000 |
| Dec-12 | 91000 | 122000 | 146000 |
| Mar-13 | 79000 | 100000 | 134000 |
| Jun-13 | 81000 | 103000 | 139000 |
| Sep-13 | 97000 | 113000 | 137000 |
| Dec-13 | 107000 | 106000 | 134000 |
| Mar-14 | 90000 | 107000 | 134000 |
| Jun-14 | 98000 | 110000 | 126000 |
| Sep-14 | 94000 | 100000 | 128000 |
| Dec-14 | 99000 | 108000 | 135000 |
| Mar-15 | 98000 | 118000 | 135000 |
| Jun-15 | 94000 | 124000 | 136000 |
| Sep-15 | 90000 | 126000 | 139000 |
| Dec-15 | 81000 | 119000 | 123000 |
| Mar-16 | 97000 | 133000 | 132000 |
| Jun-16 | 109000 | 112000 | 129000 |
| Sep-16 | 112000 | 101000 | 129000 |
| Dec-16 | 106000 | 94000 | 138000 |
| Mar-17 | 109000 | 98000 | 129000 |
| Jun-17 | 102000 | 99000 | 126000 |
| Sep-17 | 115000 | 96000 | 127000 |
| Dec-17 | 121000 | 98000 | 120000 |
| Mar-18 | 114000 | 104000 | 117000 |
| Jun-18 | 115000 | 102000 | 122000 |
| Sep-18 | 110000 | 105000 | 108000 |
| Dec-18 | 118000 | 111000 | 119000 |
| Mar-19 | 103000 | 105000 | 113000 |
| Jun-19 | 108000 | 97000 | 109000 |
| Sep-19 | 94000 | 88000 | 114000 |
| Dec-19 | 90000 | 84000 | 112000 |
| Mar-20 | 92000 | 92000 | 117000 |
| Jun-20 | 125000 | 111000 | 111000 |
Record falls in hours
The number of hours worked fell sharply in the June 2020 quarter.
Actual hours and usual hours are collected in the household labour force survey (HLFS). Usual hours are the hours someone would work in a typical week or the average of the last four if they have no 'usual' hours. Actual hours are the hours someone actually worked in the previous week.
The total number of hours actually worked in the June 2020 quarter fell 9.3 million hours (10.3 percent) compared with last quarter and decreased 8.2 million hours (9.1 percent) compared with a year ago. These were the largest decreases recorded since the series began in 1986.
Paid hours, as collected in the quarterly employment survey (QES), measure the hours a business paid for, whether their employees were working or on paid leave. Paid hours fell by 3.4 percent over the June 2020 quarter, down to 60.6 million hours (seasonally adjusted). This was the largest quarterly fall in hours paid since the current series began in 1989. The annual decrease (down 1.9 percent) was the largest annual decrease since the December 2009 quarter.
| Quarter | HLFS - Actual hours | QES - Paid hours | HLFS - Usual hours |
| Mar-90 | 0.2 | -4.1 | -0.1 |
| Jun-90 | 0.1 | -4.1 | 0.2 |
| Sep-90 | 1.1 | -2.3 | 0.8 |
| Dec-90 | -1 | -1.6 | -1 |
| Mar-91 | -3 | 0.3 | -1.8 |
| Jun-91 | -1.7 | -0.9 | -2.4 |
| Sep-91 | -2.6 | -4.2 | -2.8 |
| Dec-91 | -2 | -4.4 | -2.4 |
| Mar-92 | 1.1 | -3.7 | -1.5 |
| Jun-92 | 1.1 | -1.8 | 0.1 |
| Sep-92 | 0.1 | -0.5 | 0.1 |
| Dec-92 | 1 | 1.5 | 0.8 |
| Mar-93 | 3.6 | 1.2 | 2.6 |
| Jun-93 | 2.2 | 1.4 | 1.9 |
| Sep-93 | 5.2 | 3.4 | 3.9 |
| Dec-93 | 9 | 2.9 | 4.7 |
| Mar-94 | 0.6 | 4.3 | 4.1 |
| Jun-94 | 5.4 | 6.7 | 4.9 |
| Sep-94 | 5.4 | 5.9 | 5.2 |
| Dec-94 | 4.5 | 6.6 | 5.9 |
| Mar-95 | 6.9 | 5.6 | 5.5 |
| Jun-95 | 4.2 | 3.2 | 5.9 |
| Sep-95 | 4 | 4.4 | 4.4 |
| Dec-95 | 2.4 | 3.4 | 3.5 |
| Mar-96 | 5.3 | 3.4 | 3.7 |
| Jun-96 | 3.7 | 3.3 | 3.3 |
| Sep-96 | 1.9 | 3.4 | 2.9 |
| Dec-96 | 0.5 | 3.7 | 1.8 |
| Mar-97 | 0.2 | -0.2 | 0.5 |
| Jun-97 | -0.3 | 2.3 | -0.2 |
| Sep-97 | -0.3 | 1.3 | -1.3 |
| Dec-97 | -0.6 | 0.2 | -0.5 |
| Mar-98 | -1.5 | 1.5 | -0.5 |
| Jun-98 | 0.2 | -0.1 | -1.4 |
| Sep-98 | 0 | -0.5 | -0.4 |
| Dec-98 | -1.2 | -1.2 | -1.7 |
| Mar-99 | 2.1 | 1.7 | -0.5 |
| Jun-99 | 0.5 | -0.1 | 0.5 |
| Sep-99 | 1.4 | -0.6 | 1.9 |
| Dec-99 | 5.8 | 2 | 3.7 |
| Mar-00 | 1.3 | 1.4 | 2.6 |
| Jun-00 | 1.4 | 2.1 | 1.5 |
| Sep-00 | 2.9 | 4.1 | 2.2 |
| Dec-00 | 1.1 | 3.2 | 2 |
| Mar-01 | 1.7 | 2 | 2.4 |
| Jun-01 | 3 | 3.9 | 3.5 |
| Sep-01 | 0.8 | 2.7 | 1.5 |
| Dec-01 | 1.2 | 3.1 | 1.9 |
| Mar-02 | 3.7 | 4.5 | 3 |
| Jun-02 | 3.3 | 4.4 | 3.6 |
| Sep-02 | 3.6 | 4.8 | 3.2 |
| Dec-02 | 2.4 | 3.8 | 2.7 |
| Mar-03 | 2.1 | 4 | 2 |
| Jun-03 | 1.3 | 2.5 | 1.6 |
| Sep-03 | 2.7 | 1.9 | 3.2 |
| Dec-03 | 3.5 | 2.2 | 3.4 |
| Mar-04 | 4.1 | 2.4 | 3.3 |
| Jun-04 | 5.5 | 2.4 | 3.8 |
| Sep-04 | 3.4 | 2.9 | 3.7 |
| Dec-04 | 4.6 | 4 | 3.8 |
| Mar-05 | 2.1 | 2.8 | 3.7 |
| Jun-05 | 0.8 | 2.1 | 3.3 |
| Sep-05 | 4 | 2.3 | 3.5 |
| Dec-05 | 0.4 | 0.2 | 2.4 |
| Mar-06 | 0.9 | 1.3 | 2.5 |
| Jun-06 | 2.7 | 2.4 | 3.2 |
| Sep-06 | 0 | 2.1 | 1.3 |
| Dec-06 | 2.2 | 3.1 | 1.4 |
| Mar-07 | 1.4 | 1.5 | 1.5 |
| Jun-07 | 0.6 | 1.9 | 1 |
| Sep-07 | 0.4 | 1.4 | 0.7 |
| Dec-07 | 0.4 | 2.2 | 1.2 |
| Mar-08 | 0.8 | 2.3 | 0.5 |
| Jun-08 | -0.8 | 1.3 | -0.3 |
| Sep-08 | -0.1 | 0.7 | 0.9 |
| Dec-08 | -1.1 | -1.9 | 0.4 |
| Mar-09 | -2 | -2.5 | -1.3 |
| Jun-09 | -2.1 | -4.1 | -2.3 |
| Sep-09 | -3.6 | -3.8 | -3 |
| Dec-09 | -3.3 | -2.4 | -3.1 |
| Mar-10 | -0.3 | -0.7 | -1 |
| Jun-10 | 0.5 | 1.6 | 0.6 |
| Sep-10 | 2.5 | 2.3 | 1.2 |
| Dec-10 | 3.4 | 2.2 | 1.9 |
| Mar-11 | -0.8 | 2.1 | 1.6 |
| Jun-11 | 1.9 | 1.4 | 1.6 |
| Sep-11 | 1.5 | 1.3 | 1.6 |
| Dec-11 | 0.2 | 2 | 0.5 |
| Mar-12 | 1 | 0.7 | 0 |
| Jun-12 | -0.6 | 2.2 | -0.4 |
| Sep-12 | -1.6 | 1.9 | -1.4 |
| Dec-12 | 0.5 | 1.9 | 0.1 |
| Mar-13 | 3.3 | 2.3 | 1.2 |
| Jun-13 | 1.4 | 1.7 | 1.4 |
| Sep-13 | 3.4 | 2.8 | 3.9 |
| Dec-13 | 1.9 | 2.4 | 2.8 |
| Mar-14 | 2.9 | 3.8 | 3.3 |
| Jun-14 | 4.2 | 3.7 | 3.4 |
| Sep-14 | 3 | 2.6 | 2.4 |
| Dec-14 | 3.4 | 2.9 | 3.4 |
| Mar-15 | 2.6 | 3.8 | 2.8 |
| Jun-15 | 1.3 | 2.5 | 3.1 |
| Sep-15 | 1.2 | 3.1 | 1.9 |
| Dec-15 | 2.2 | 3.7 | 1.8 |
| Mar-16 | 2.3 | 2.3 | 2.3 |
| Jun-16 | 5.6 | 3 | 5.8 |
| Sep-16 | 6.3 | 3.4 | 6.2 |
| Dec-16 | 6.4 | 3.4 | 6.8 |
| Mar-17 | 3.7 | 3.2 | 6 |
| Jun-17 | 2.3 | 3.5 | 2 |
| Sep-17 | 4 | 2.9 | 3.9 |
| Dec-17 | 2 | 2.3 | 2.7 |
| Mar-18 | 4.2 | 2 | 2.8 |
| Jun-18 | 4.8 | 2.4 | 3.5 |
| Sep-18 | 1.6 | 2.3 | 2 |
| Dec-18 | 3.3 | 1.9 | 2.1 |
| Mar-19 | 3.2 | 1.9 | 2 |
| Jun-19 | 1 | 1.1 | 2 |
| Sep-19 | 2.2 | 1.1 | 1.5 |
| Dec-19 | 0.6 | 1.6 | 1.6 |
| Mar-20 | 0.6 | 1.8 | 2 |
| Jun-20 | -9.1 | -1.9 | 0.5 |
As a result of this fall in paid hours, weekly hours per full-time equivalent (FTE) fell by 3.1 percent over the quarter to 37.4, the lowest level since the current series began in 1989.
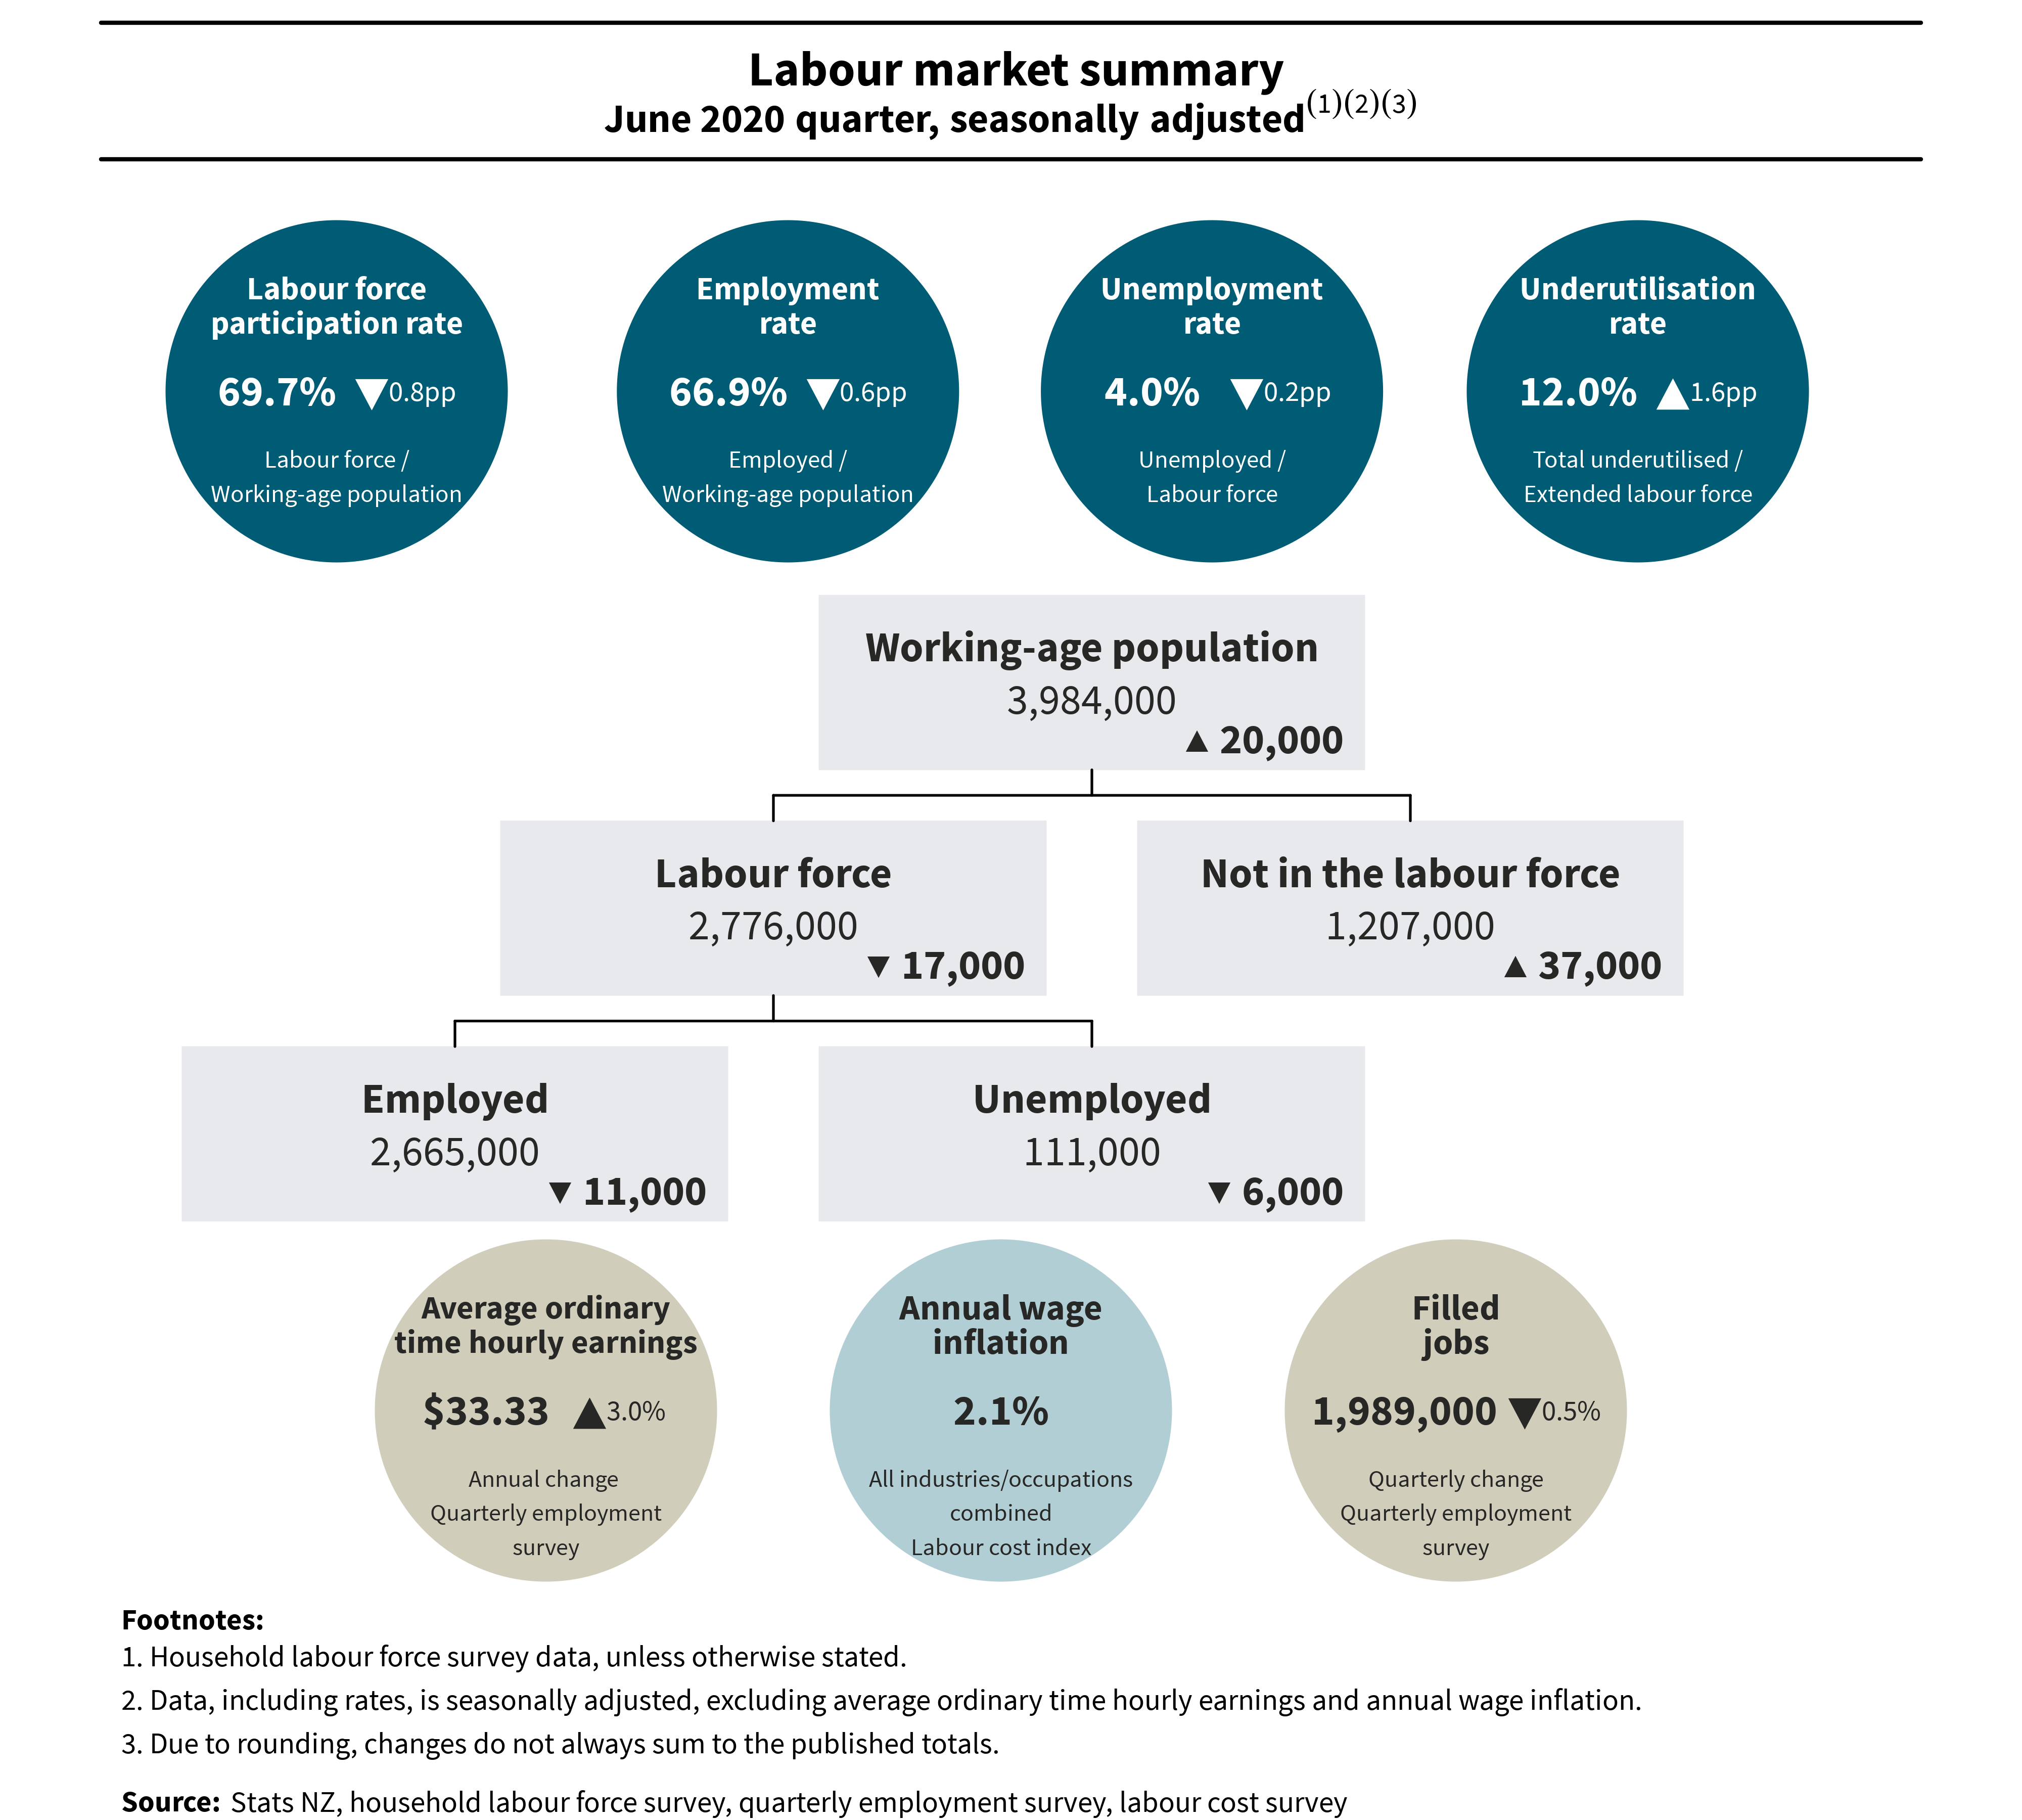
Slight fall in employment and jobs
The employment rate fell to 66.9 percent in the June 2020 quarter, down from 67.5 percent last quarter. This reflected a fall in the number of people employed (down 11,000) and a rise in the working-age population (up 20,000).
The fall in the number of people in employment and unemployment this quarter resulted in the labour force participation rate falling to 69.7 percent, down from 70.5 percent (revised) last quarter.
The number of people not in the labour force rose (up 37,000) this quarter, while the number of people in the labour force fell (down 17,000). This was the largest fall in the number of people in the labour force recorded since the global financial crisis.
Filled jobs, as measured by the QES, fell 10,800 in the June 2020 quarter to 1,989,400.
Differences between the filled jobs in the QES and employment numbers in the HLFS can largely be explained by differences in survey coverage. The QES excludes a number of industries, including agriculture, and those who are self-employed without employees, to better fit international standards. Conversely, the HLFS only includes usually resident New Zealanders, so can exclude some temporary seasonal labourers.
The wage subsidy scheme was in place throughout the June 2020 quarter. Over three-quarters (77 percent) of businesses surveyed in the QES had received a wage subsidy.
The monthly Employment indicators: June 2020 (MEI) provided an early gauge on employment this quarter. These showed a substantial fall in the number of filled jobs in April, followed by recovery in May and June. When averaged to create a quarterly measure, the MEI indicates that the seasonally adjusted number of filled jobs fell by 20,131 between the March and June 2020 quarters.
Labour force status classifications unchanged in response to COVID-19
Stats NZ adheres to best practice and required standards set by the International Labour Organization (ILO). These standards have not been changed in response to COVID-19 to ensure international comparability and consistency of estimates.
COVID-19 alert system and key events timeline
17 March 2020: Wage subsidy scheme announced and in place
23 March 2020: New Zealand entered COVID-19 alert level 3
25 March 2020: New Zealand entered COVID-19 alert level 4
27 April 2020: New Zealand entered COVID-19 alert level 3
13 May 2020: New Zealand entered COVID-19 alert level 2
14 May 2020: Extended wage subsidy scheme announced
8 June 2020: New Zealand entered COVID-19 alert level 1
10 June 2020: Extended wage subsidy scheme in place
1 September 2020: Applications for the extended wage subsidy scheme to close
Text alternative for labour market summary, June 2020 quarter, seasonally adjusted diagram.
Text alternatives
Text alternative for total underutilisation, June 2020 quarter, seasonally adjusted diagram
Diagram shows data from June 2020 quarter's household labour force survey (HLFS).
The underutilisation rate was 12.0%, up 1.6pp (percentage points). This rate is derived from total underutilised divided by the extended labour force. The unemployment rate was 4.0%, down 0.2pp. This is derived from unemployed divided by labour force.
Total underutilised was up 45,000, to 346,000. Underemployed was up 33,000 to 125,000. Unemployed was down 6,000 to 111,000. The potential labour force was up 18,000 to 111,000.
Within the potential labour force, available potential jobseekers were up 18,900 to 92,400 and unavailable jobseekers remained at 18,000.
Text alternative for labour market summary, June 2020 quarter, seasonally adjusted diagram
Diagram shows data from June 2020 quarter's household labour force survey (HLFS), quarterly employment survey (QES), and labour cost index (LCI).
HLFS results for the June 2020 quarter showed the labour force participation rate was 69.7%, down 0.8pp (percentage points). This rate is derived from labour force divided by working-age population. The employment rate was 66.9%, down 0.6pp. This is derived from employed divided by working-age population. The unemployment rate was 4.0%, down 0.2pp. This is derived from unemployed divided by labour force.
The underutilisation rate was 12.0%, up 1.6pp. This is derived from total underutilised divided by extended labour force. The working-age population was up 20,000 to 3,984,000. This is made up of the labour force, down 17,000 to 2,776,000, and people not in the labour force, up 37,000 to 1,207,000. The labour force is made up of employed people, down 11,000 to 2,665,000, and those unemployed, down 6,000 to 111,000.
Average ordinary time hourly earnings from the QES were up 3.0% annually, to $33.33.
Annual wage inflation from the LCI was 2.1%, for all industries and occupations combined.
Filled jobs from the QES were down 0.5% for the quarter, to 1,989,000.
Notes:
- Household labour force survey data, unless otherwise stated.
- Data, including rates, is seasonally adjusted, excluding average ordinary time hourly earnings and annual wage inflation.
- Due to rounding, changes do not always sum to the published totals.
Technical enquiries
Jessica Honey
04 931 4658
[email protected]