We want to hear about how you use this release.
Provide your feedback in our survey We want to hear about how you use Greenhouse gas emissions (consumption-based).
You can also contact us at [email protected].
Consumption-based greenhouse gas emissions statistics link the emissions from production, whether domestic or overseas, that become embodied in goods and services - including the extraction, manufacturing, and transport activities that take place throughout the entire supply chain - to the final consumer.
Emissions are reported by the domestic final consumption groups of households, government, non-profit institutions serving households, and investment in physical assets. Consumption-based emissions are often referred to as a nation's carbon footprint. Values are in carbon dioxide equivalents (CO2-e), based on the Intergovernmental Panel on Climate Change's Fifth Assessment Report.
Key facts
In the year ended December 2023:
- total consumption-based emissions were 58,301 kilotonnes, up 1.6 percent from 2022
- household consumption was the largest contributor, accounting for 70 percent (40,764 kilotonnes) of total emissions
- the carbon footprint of households increased the most, by 5.8 percent (2,221 kilotonnes), driven by higher emissions embodied in transport (up 12 percent, 1,502 kilotonnes) and food and non-alcoholic beverages (up 7.6 percent, 793 kilotonnes)
- total emissions embodied in the consumption by tourists (domestic and international) decreased 6.0 percent (408 kilotonnes). Emissions embodied in tourism consumption in 2023 remained 45 percent lower than pre-COVID-19 levels in 2019
- emissions embodied in imports increased 1.2 percent (360 kilotonnes)
- emissions embodied in exports decreased 2.3 percent (1,170 kilotonnes)
- New Zealand was a net exporter of greenhouse gas emissions in 2023, with emissions embodied in exports 70 percent greater than emissions embodied in imports
- emissions embodied in gross fixed capital formation decreased 3.4 percent (441 kilotonnes), driven by a 12 percent (373 kilotonnes) decrease in emissions from plant, machinery and equipment.
Consumption-based emissions for New Zealand residents adjust production-based emissions by accounting for emissions associated with imports and exports, allocating them to final use categories. On the production side, emissions from domestic industries and households are consistent with those reported in Greenhouse gas emissions (industry and household): Year ended 2023.
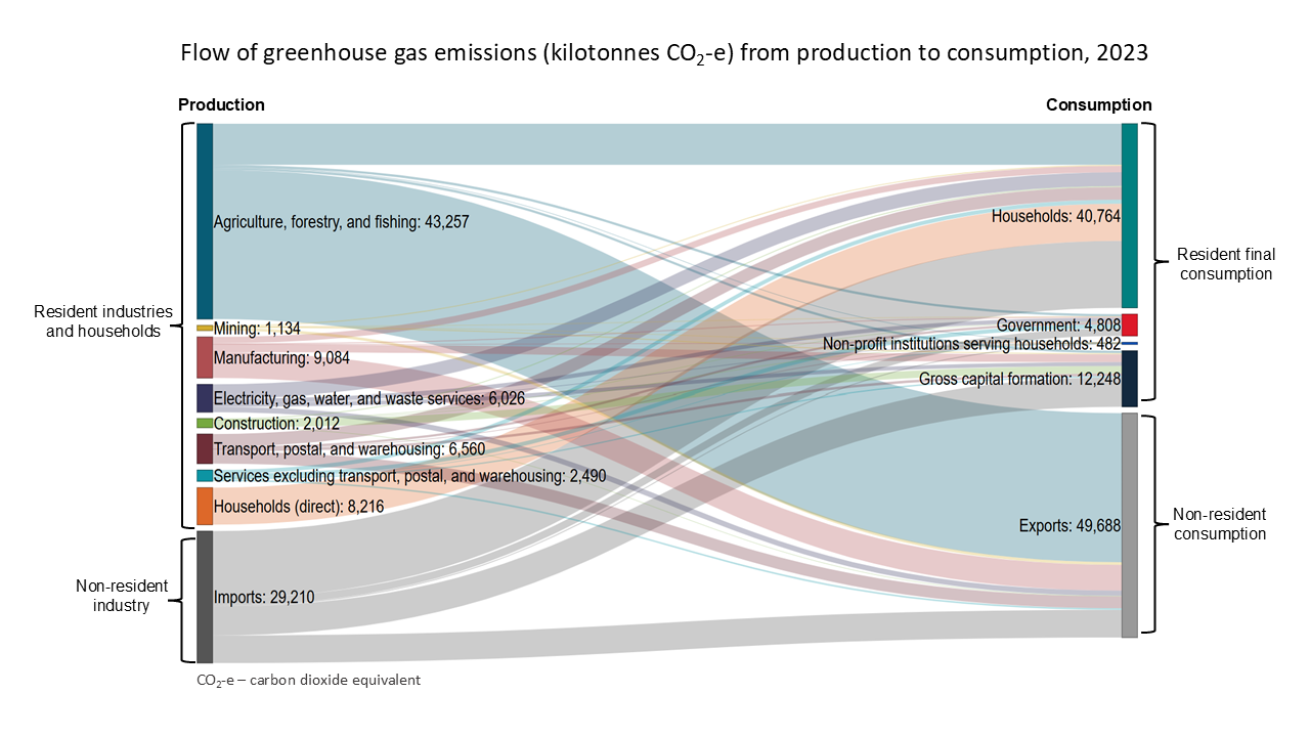
Text alternative for Flow of greenhouse gas emissions (kilotonnes CO2-e) from production to consumption, 2023.
Carbon footprint of New Zealand households
Household consumption emissions were 40,764 kilotonnes in 2023, up 2,221 kilotonnes (5.8 percent) from the previous year. These emissions are categorised by Classification of Individual Consumption According to Purpose (COICOP).
Significant upward drivers were:
- transport emissions, up 1,502 kilotonnes (12 percent)
- food and non-alcoholic beverage emissions, up 793 kilotonnes (7.6 percent).
A significant downward driver was:
- household contents and services emissions, down 135 kilotonnes (8.2 percent).
| Year | Transport | Food and non-alcoholic beverages | Housing and household utilities |
| 2007 | 14549 | 12747 | 5649 |
| 2008 | 13723 | 11175 | 6922 |
| 2009 | 13065 | 12329 | 6413 |
| 2010 | 13461 | 12379 | 5771 |
| 2011 | 13722 | 11374 | 5770 |
| 2012 | 13441 | 11871 | 6541 |
| 2013 | 13197 | 12006 | 5829 |
| 2014 | 13569 | 11706 | 5582 |
| 2015 | 14454 | 12097 | 5622 |
| 2016 | 14801 | 12303 | 4954 |
| 2017 | 15304 | 11948 | 5156 |
| 2018 | 15442 | 11166 | 5053 |
| 2019 | 15211 | 10935 | 5306 |
| 2020 | 11571 | 11913 | 5533 |
| 2021 | 11811 | 11095 | 5337 |
| 2022 | 12739 | 10482 | 4467 |
| 2023 | 14241 | 11274 | 4425 |
In 2023, households remained the largest contributor to New Zealand's carbon footprint, accounting for 70 percent of total emissions.
Transport consumption-based emissions showed the biggest increase in 2023, up by 1,502 kilotonnes (12 percent), but remained below the pre-COVID-19 level. Transport was the largest contributor to household consumption-based emissions at 35 percent.
Transport emissions are composed of direct emissions (emissions from personal vehicle use), which were up 86 kilotonnes (1.2 percent) in 2023; and indirect emissions (emissions embodied in transport expenditure, such as air travel and the emissions embodied in the production/extraction of fuels), which were up 1,415 kilotonnes (26 percent).
Food and non-alcoholic beverages contributed 28 percent to total household consumption emissions in 2023. Consumption emissions from this expenditure category increased 793 kilotonnes (7.6 percent).
Housing and household utilities was the third-largest contributor to household consumption emissions at 11 percent, falling 42 kilotonnes (0.9 percent) from 2022. Over the 2007-2023 period, housing and household utilities emissions fluctuated, reflecting changes in energy sources used for electricity generation.
Total household consumption emissions (carbon footprint) largely remained flat between 2007 and 2023, with falling emissions intensity (emissions in relation to expenditure) offsetting increases driven by population growth and higher expenditure per capita.
| Year | Population | Emissions intensity | Expenditure per capita | Household consumption emissions |
| 2007 | 1000 | 1000 | 1000 | 1000 |
| 2008 | 1008 | 955 | 999 | 962 |
| 2009 | 1020 | 946 | 981 | 946 |
| 2010 | 1030 | 922 | 1003 | 952 |
| 2011 | 1037 | 879 | 1022 | 932 |
| 2012 | 1043 | 884 | 1045 | 963 |
| 2013 | 1054 | 838 | 1072 | 946 |
| 2014 | 1074 | 810 | 1086 | 945 |
| 2015 | 1097 | 807 | 1107 | 980 |
| 2016 | 1121 | 770 | 1146 | 990 |
| 2017 | 1143 | 731 | 1186 | 991 |
| 2018 | 1162 | 685 | 1222 | 973 |
| 2019 | 1182 | 665 | 1240 | 974 |
| 2020 | 1198 | 646 | 1204 | 932 |
| 2021 | 1199 | 586 | 1291 | 908 |
| 2022 | 1205 | 542 | 1339 | 874 |
| 2023 | 1238 | 569 | 1311 | 924 |
Gross fixed capital formation
Gross fixed capital formation includes the consumption emissions embodied in capital expenditure. Emissions embodied in gross fixed capital formation decreased 441 kilotonnes (3.4 percent) in 2023, with the following key movements:
- plant, machinery, and equipment, down 373 kilotonnes (12 percent)
- residential buildings, down 260 kilotonnes (6.9 percent)
- other construction, up 115 kilotonnes (5.0 percent)
- non-residential buildings, up 101 kilotonnes (4.9 percent).
The emissions embodied in building include those from harvesting and extracting building materials, the processing and transporting of materials, and construction activity.
Government and non-profit institutions serving households
Emissions embodied in government expenditure increased 39 kilotonnes (0.8 percent) in 2023.
Local government, which represented 21 percent of total government emissions, was the main driver of this increase, up 33 kilotonnes (3.3 percent).
Emissions from non-profit institutions serving households, which include most charities, sports clubs, and religious institutions, decreased 6 kilotonnes (1.2 percent) in 2023.
Overseas trade emissions
Consumption-based emissions are estimated by subtracting estimates of emissions embodied in exports from production-based emissions, and adding estimates of emissions embodied in imports. Therefore, the difference between production- and consumption-based emissions is the difference between emissions embodied in exports and imports, or the net emissions embodied in trade.
In 2023, emissions embodied in exports were 70 percent greater than emissions embodied in imports, resulting in New Zealand being a net exporter of greenhouse gas emissions, and therefore New Zealand's consumption-based emissions being lower than the production-based estimates.
Emissions embodied in exports decline
Flow of greenhouse gas emissions (kilotonnes CO2-e) from production to consumption, 2023 shows how production-based emissions can ultimately become embodied in our exports for consumption by non-residents. These production-based emissions can be associated with either resident industries, recorded in Greenhouse gas emissions (industry and household): Year ended 2023, or non-resident industries, recorded in the production-based emissions of other countries.
In 2023, emissions embodied in exports declined by 1,170 kilotonnes (2.3 percent). The key industry movements were:
- agriculture, forestry, and fishing, down 1,394 kilotonnes (4.1 percent)
- transport, postal, and warehousing, up 624 kilotonnes (31 percent).
Of all the emissions embodied in our exports, 66 percent came from the agriculture, forestry, and fishing industry, representing 76 percent of this industry's production-based emissions.
An additional 11 percent came from manufacturing, representing 63 percent of this industry's production-based emissions.
Emissions embodied in imports increase
Emissions embodied in imports are the production-based emissions that become embodied in the goods and services supplied to New Zealand from overseas industries, as either inputs into domestic production or for consumption by final users.
Emissions embodied in imports increased 360 kilotonnes (1.2 percent) in 2023. Key industry movements in import emissions were:
- transport, postal, and warehousing, up 880 kilotonnes (51 percent)
- manufacturing, down 530 kilotonnes (2.4 percent).
In 2023, 75 percent of all emissions embodied in imports were supplied by non-resident manufacturing industries.
Imports and exports by gas
In 2023, greenhouse gas emissions embodied in exports comprised:
- methane 28,557 kilotonnes CO2-e (57 percent)
- carbon dioxide 15,469 kilotonnes (31 percent)
- nitrous oxide 5,371 kilotonnes CO2-e (11 percent)
- fluorinated gases 291 kilotonnes CO2-e (0.6 percent).
Methane emissions embodied in exports decreased by 1,119 kilotonnes (3.8 percent) in 2023, largely due to the decrease in exports of biological methane emissions from the agriculture, forestry, and fishing industry.
Greenhouse gas emissions embodied in imports comprised:
- carbon dioxide 19,852 kilotonnes (68 percent)
- methane 7,827 kilotonnes CO2-e (27 percent)
- nitrous oxide 1,196 kilotonnes CO2-e (4.1 percent)
- fluorinated gases 336 kilotonnes CO2-e (1.1 percent).
Tourism consumption-based emissions
Consumption-based emissions of tourism estimate the carbon footprint of the demand side of New Zealand tourism. The activity considered from a consumption perspective is the emissions embodied in the consumption of goods and services supplied by resident tourism industries. Additionally, it includes the emissions associated with the use of private vehicles by domestic (resident) and international (non-resident) tourists. Tourism consumption-based emissions can be broken down by domestic and international tourists consistent with the Tourism satellite account.
The consumption-based emissions of tourists can be broken down into direct and indirect emissions . Direct emissions result from the use of fuel in private vehicles. Indirect emissions are the emissions embodied in the goods and services consumed (purchased) from tourist industries such as electricity use and heating/cooling in accommodation, and the fuel use of air travel, as well as the emissions associated with producing and transporting the fuel used in private vehicles.
Direct emissions |
Indirect emissions |
Total emissions |
||||
Emissions |
Change in emissions |
Emissions |
Change in emissions |
Emissions |
Change in emissions |
|
Kilotonnes (CO2-e) |
||||||
Domestic tourists |
600 |
23 (4.0%) |
3,418 |
-408 (-11%) |
4,018 |
-384 (-8.7%) |
International tourists |
155 |
68 (78%) |
2,182 |
-92 (-4.0%) |
2,337 |
-24 (-1.0%) |
Total tourists |
756 |
91 (14%) |
5,600 |
-500 (-8.2%) |
6,355 |
-408 (-6.0%) |
Note: Contribution to emissions is based on the December 2023 year. CO2-e - carbon dioxide equivalent. |
||||||
In 2023, the total carbon footprint of New Zealand tourism was 6,355 kilotonnes (down 6.0 percent).
The biggest decrease to tourism consumption-based emissions in 2023 was from the indirect emissions of domestic tourists, down 408 kilotonnes (11 percent). The biggest increase to tourism consumption-based emissions in 2023 was from international direct emissions, up 68 kilotonnes (78 percent).
Total international tourist consumption-based emissions decreased 24 kilotonnes (1.0 percent) in 2023. As a result, international tourists contributed 37 percent (2,337 kilotonnes) to total consumption-based tourism emissions in 2023.
| Year | Domestic indirect | Domestic direct | International indirect | International direct |
| 2007 | 6374 | 777 | 5485 | 257 |
| 2008 | 5987 | 730 | 5046 | 237 |
| 2009 | 5725 | 763 | 4540 | 271 |
| 2010 | 5472 | 755 | 3982 | 303 |
| 2011 | 5352 | 692 | 3701 | 287 |
| 2012 | 5415 | 683 | 3581 | 292 |
| 2013 | 5339 | 676 | 3445 | 293 |
| 2014 | 5656 | 751 | 3771 | 326 |
| 2015 | 6052 | 852 | 4525 | 427 |
| 2016 | 6082 | 925 | 4371 | 428 |
| 2017 | 5976 | 916 | 4548 | 453 |
| 2018 | 5940 | 793 | 4607 | 378 |
| 2019 | 5723 | 705 | 4722 | 411 |
| 2020 | 5356 | 823 | 361 | 174 |
| 2021 | 4434 | 774 | 399 | 44 |
| 2022 | 3825 | 577 | 2274 | 87 |
| 2023 | 3418 | 600 | 2182 | 155 |
Text alternative for Flow of greenhouse gas emissions (kilotonnes CO2-e) from production to consumption, 2023
Image is of a Sankey chart, a type of flow diagram where the width of an arrow is proportional to the flow quantity. This chart shows how emissions from the production of goods and services (from the emissions production account) shown on the left side of chart, align (flow) to consumption emissions (emissions generated as a result of what we consume), on the right side. The industries that produce emissions are listed on the left: agriculture, forestry, and fishing; mining; manufacturing; electricity, gas, water, and waste services; construction; transport, postal, and warehousing; services excluding transport, postal, and warehousing. Households also produce emissions directly, for example, through cars burning fuel, and are also included on the production side. We also consume imports. Imports are included on the left as an input to consumption emissions. Final users/consumers of what we produce and import are listed on the right: households; government; non-profit institutions serving households, gross capital formation; and exports/foreign consumers.
Definitions and metadata
Greenhouse gas emissions (consumption-based): Year ended 2023 (provisional) - DataInfo+ gives information on the methodology underlying the data and outlines revisions made in this release.
Consumption-based greenhouse gas emissions (industry and household): Sources and methods - DataInfo+ presents the data sources and methods used for producing this account.
Technical enquiries
Adam Tipper
[email protected]
04 931 4944
Next release
Greenhouse gas emissions (industry and household): September 2025 quarter will be released on 5 February 2026.