| Measure | Percent |
| Cadmium (0 of 351) | 0 |
| Copper (0 of 644) | 0 |
| Lead (0 of 403) | 0 |
| Nickel (0 of 227) | 0 |
| Fluoride (2 of 812) | 0.2 |
| Chromium (1 of 382) | 0.3 |
| Aluminium (2 of 508) | 0.4 |
| Boron (4 of 719) | 0.6 |
| Nitrite (7 of 973) | 0.7 |
| Arsenic (46 of 904) | 5.1 |
| Manganese (127 of 1065) | 11.9 |
| Nitrate (146 of 1173) | 12.4 |
| E coli (450 of 998) | 45.1 |
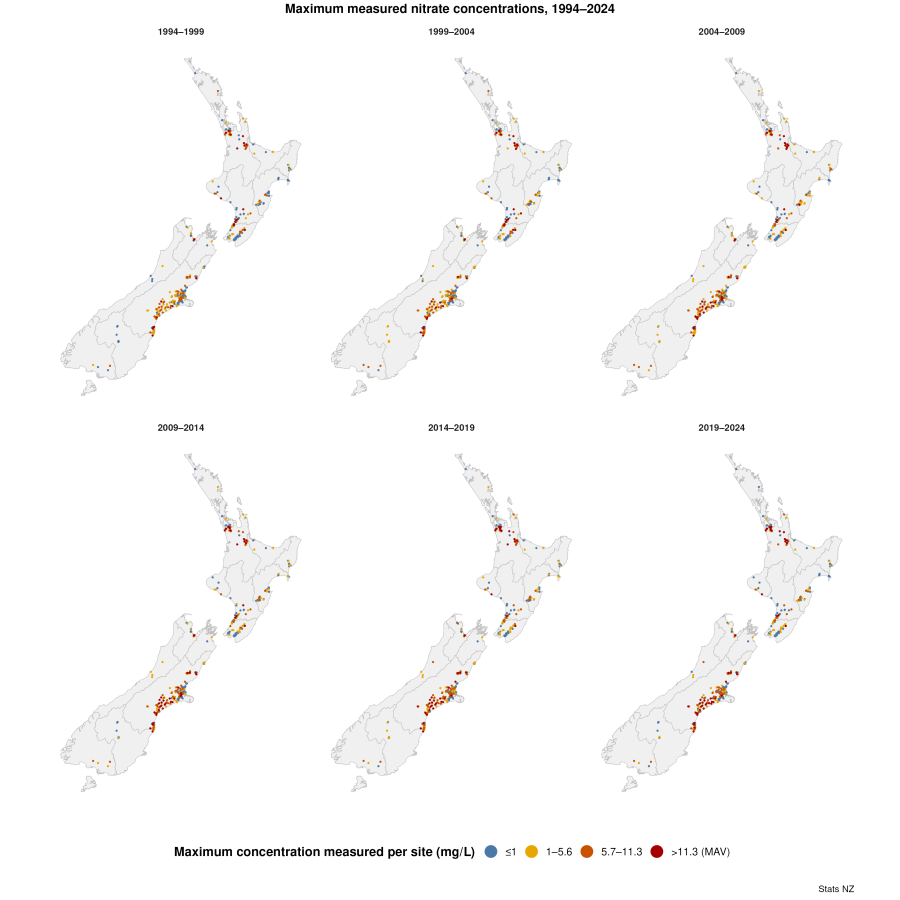
Text alternative for Maximum measured nitrate concentrations, 1994-2024
Six maps of New Zealand show maximum measured nitrate concentrations at groundwater monitoring sites across six five-year time windows: 1994-1999 (top left), 1999-2004 (top middle), 2004-2009 (top right), 2009-2014 (bottom left), 2014-2019 (bottom middle), and 2019-2024 (bottom right). Dots on maps are coloured to indicate the maximum nitrate concentration at the groundwater monitoring site: less than 1 mg/L (blue), between 1 and 5.6 mg/L (yellow), between 5.7 and 11.3 mg/L (orange), more than 11.3 mg/L (red). Nitrate is measured and reported as the elemental nitrogen equivalent, described as nitrate-nitrogen - 11.3 mg/L is the maximum acceptable value for nitrate-nitrogen from New Zealand drinking water standards.
Aesthetic values
Aesthetic values for New Zealand drinking water were not met at least once for 10 of 11 groundwater quality measures between April 2019 and March 2024 at:
- 52.5 percent of sites (376 of 716) for pH
- 45.2 percent of sites (531 of 1174) for temperature
- 38.6 percent of sites (291 of 753) for iron
- 34.5 percent of sites (367 of 1065) for manganese
- less than 10 percent of sites for ammonia (70 of 1144), chloride (33 of 1159), sodium (33 of 1184), aluminium (13 of 508), sulphate (5 of 1170), and zinc (3 of 778).
No sites were above the aesthetic value for New Zealand drinking water for copper.
| Measure | Percent |
| Copper (0 of 644) | 0 |
| Sulphate (5 of 1170) | 0.4 |
| Zinc (3 of 778) | 0.4 |
| Aluminium (13 of 508) | 2.6 |
| Chloride (33 of 1159) | 2.8 |
| Sodium (33 of 1184) | 2.8 |
| Ammonia (70 of 1144) | 6.1 |
| Manganese (367 of 1065) | 34.5 |
| Iron (291 of 753) | 38.6 |
| Temperature (531 of 1174) | 45.2 |
| pH (376 of 716) | 52.5 |
| Measure | Above reference range | Below reference range |
| Ammonia (10 of 971) | 1 | 0 |
| Bromide (4 of 322) | 1.2 | 0 |
| Dissolved reactive phosphorous (11 of 916) | 1.2 | 0 |
| Chloride (36 of 994) | 1.8 | 1.8 |
| Sodium (54 of 1020) | 3.1 | 2.2 |
| Potassium (59 of 1019) | 1.5 | 4.3 |
| Fluoride (12 of 398) | 3 | 0 |
| Sulphate (31 of 1004) | 3.1 | 0 |
| Magnesium (66 of 1014) | 2.8 | 3.7 |
| Calcium (65 of 984) | 1.8 | 4.8 |
| Manganese (30 of 907) | 3.3 | 0 |
| Iron (22 of 601) | 3.7 | 0 |
| Silica (76 of 813) | 7.9 | 1.5 |
| Bicarbonate (138 of 1003) | 1.8 | 12 |
Trends
Trends could be assessed for 24 groundwater quality measures between April 2004 and March 2024:
- Trends were likely or very likely increasing at more than half of sites for 12 groundwater quality measures. These measures were silica (344 of 406 sites), potassium (385 of 534), fluoride (138 of 195), calcium (340 of 488), magnesium (329 of 485), temperature (397 of 598), bromide (122 of 190), boron (74 of 117), sodium (348 of 563), conductivity (325 of 579), bicarbonate (154 of 285), and chloride (289 of 562).
- Trends were likely or very likely decreasing at more than half of sites for six groundwater quality measures. These measures were lead (26 of 35 sites), zinc (38 of 52), ammonia (367 of 507), pH (182 of 295), dissolved oxygen (189 of 348), and nitrite (38 of 73).
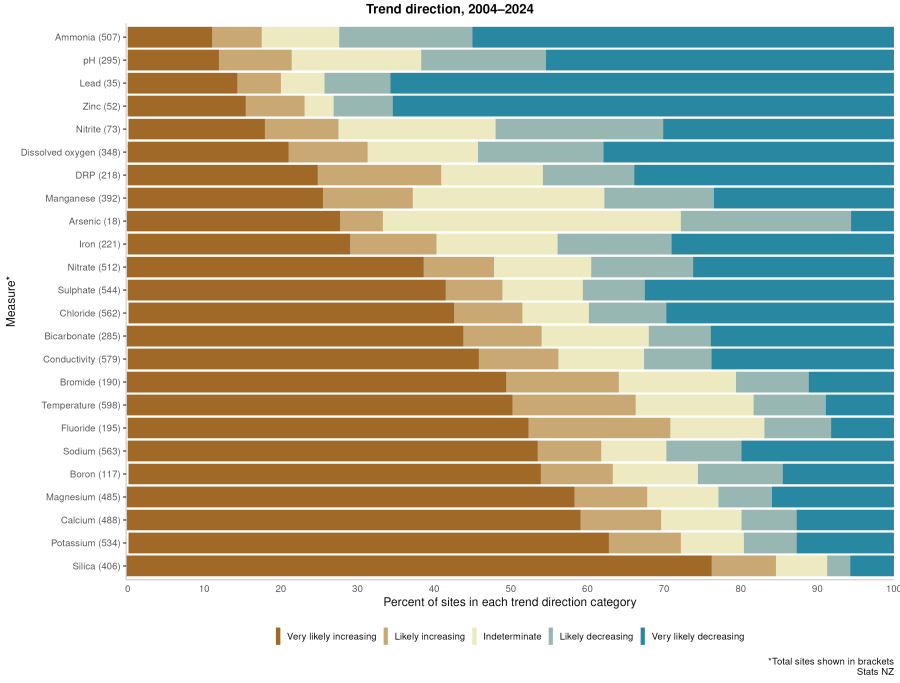
Text alternative for Trend direction, 2004-2024
Bar chart shows the percentage of groundwater monitoring sites assigned to each trend direction category for 24 groundwater measures where trends could be assessed between April 2004 and March 2024. Each measure is represented by a horizontal stacked bar, with colours indicating the trend direction category: very likely increasing (dark brown), likely increasing (light brown), indeterminate (beige), likely decreasing (light blue), and very likely decreasing (dark blue). The number of sites included for each measure is shown in brackets next to the measure name. The measures are sorted from top to bottom based on the proportion of sites in the very likely increasing category - from the lowest at the top (for example, ammonia, pH) to the highest at the bottom (for example, silica, potassium). The data is available from Trend direction, all measures, 2004-2024 (CSV, 7 KB).
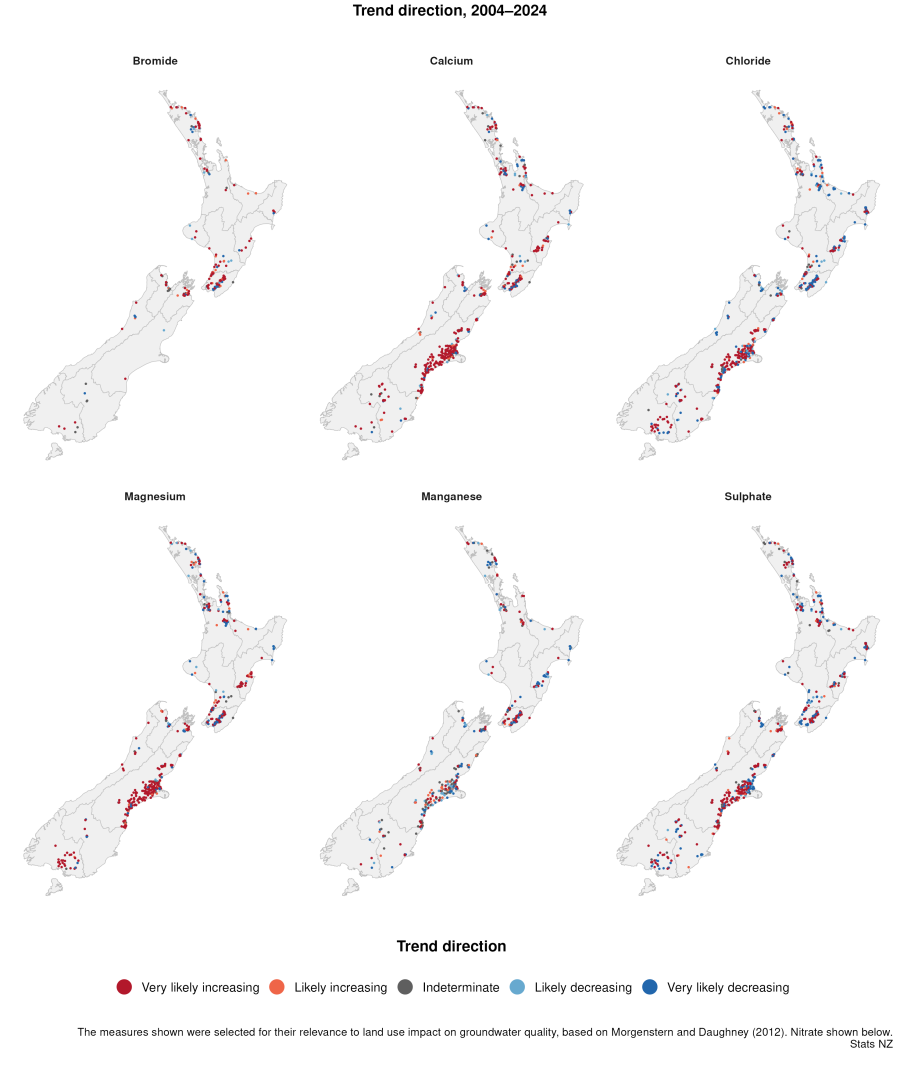
Text alternative for Trend direction, 2004-2024
Six maps of New Zealand show the trend direction of six groundwater quality measures between April 2004 and March 2024: bromide (top left), calcium (top middle), chloride (top right), magnesium (bottom left), manganese (bottom middle), and sulphate (bottom right). Each map displays groundwater monitoring sites as dots, coloured according to the assessed trend direction at each site: very likely increasing (dark red), likely increasing (light red), indeterminate (grey), likely decreasing (light blue), and very likely decreasing (dark blue).
| Measure | Min | Q1 | Median | Q3 | Max |
|---|---|---|---|---|---|
| Bromide (190) | -1.43 | -0 | 0 | 2.04 | 5 |
| Calcium (488) | -1.61 | -0 | 0.41 | 1.2 | 2.99 |
| Chloride (562) | -2.61 | -0.48 | 0 | 1.11 | 3.42 |
| Magnesium (485) | -1.87 | -0 | 0.43 | 1.27 | 3.18 |
| Manganese (392) | 0 | 0 | 0 | -0 | 0 |
| Nitrate (512) | -5.06 | -0.82 | 0.11 | 2.08 | 6.41 |
| Sulphate (544) | -3.67 | -0.64 | -0 | 1.55 | 4.69 |


