Migrant arrivals have continued to increase, reaching almost 150,000 in the year ended March 2019, however, more people are also leaving New Zealand long term, Stats NZ said today.
"The number of migrant arrivals for the year ended March 2019 is actually higher than when net migration peaked at almost 64,000 in the year ended July 2016," population insights manager Tehseen Islam said.
"However, migrant departures have continued to rise since mid-2016, bringing net migration to its current level. Net migration remains at historically high levels, but lower than the 2016 peak."
| 2015-05-01 | 135197 |
|---|---|
| 2015-06-01 | 135422 |
| 2015-07-01 | 136665 |
| 2015-08-01 | 137360 |
| 2015-09-01 | 138319 |
| 2015-10-01 | 139733 |
| 2015-11-01 | 140752 |
| 2015-12-01 | 141788 |
| 2016-01-01 | 142340 |
| 2016-02-01 | 144190 |
| 2016-03-01 | 144326 |
| 2016-04-01 | 144811 |
| 2016-05-01 | 145403 |
| 2016-06-01 | 145831 |
| 2016-07-01 | 146068 |
| 2016-08-01 | 145309 |
| 2016-09-01 | 145261 |
| 2016-10-01 | 144945 |
| 2016-11-01 | 144901 |
| 2016-12-01 | 144930 |
| 2017-01-01 | 145170 |
| 2017-02-01 | 144842 |
| 2017-03-01 | 144524 |
| 2017-04-01 | 144133 |
| 2017-05-01 | 143897 |
| 2017-06-01 | 144168 |
| 2017-07-01 | 144067 |
| 2017-08-01 | 144208 |
| 2017-09-01 | 143566 |
| 2017-10-01 | 143149 |
| 2017-11-01 | 142750 |
| 2017-12-01 | 142330 |
| 2018-01-01 | 140169 |
| 2018-02-01 | 138990 |
| 2018-03-01 | 139151 |
| 2018-04-01 | 138825 |
| 2018-05-01 | 138920 |
| 2018-06-01 | 138361 |
| 2018-07-01 | 138450 |
| 2018-08-01 | 139095 |
| 2018-09-01 | 139804 |
| 2018-10-01 | 140890 |
| 2018-11-01 | 142918 |
| 2018-12-01 | 145643 |
| 2019-01-01 | 147512 |
| 2019-02-01 | 149067 |
| 2019-03-01 | 148770 |
| 2019-04-01 | 148546 |
| 2019-05-01 | 148507 |
| 2019-06-01 | 149015 |
| 2019-07-01 | 150104 |
| 2019-08-01 | 149834 |
| 2015-05-01 | 82118 |
|---|---|
| 2015-06-01 | 82179 |
| 2015-07-01 | 82430 |
| 2015-08-01 | 82387 |
| 2015-09-01 | 82291 |
| 2015-10-01 | 82607 |
| 2015-11-01 | 82509 |
| 2015-12-01 | 82827 |
| 2016-01-01 | 82619 |
| 2016-02-01 | 82409 |
| 2016-03-01 | 82059 |
| 2016-04-01 | 82303 |
| 2016-05-01 | 82258 |
| 2016-06-01 | 81997 |
| 2016-07-01 | 82120 |
| 2016-08-01 | 82006 |
| 2016-09-01 | 82140 |
| 2016-10-01 | 81976 |
| 2016-11-01 | 82368 |
| 2016-12-01 | 82703 |
| 2017-01-01 | 83370 |
| 2017-02-01 | 83917 |
| 2017-03-01 | 83880 |
| 2017-04-01 | 84039 |
| 2017-05-01 | 84738 |
| 2017-06-01 | 85480 |
| 2017-07-01 | 86189 |
| 2017-08-01 | 87000 |
| 2017-09-01 | 87804 |
| 2017-10-01 | 88547 |
| 2017-11-01 | 88923 |
| 2017-12-01 | 89690 |
| 2018-01-01 | 87515 |
| 2018-02-01 | 87517 |
| 2018-03-01 | 88601 |
| 2018-04-01 | 88931 |
| 2018-05-01 | 89163 |
| 2018-06-01 | 89441 |
| 2018-07-01 | 89717 |
| 2018-08-01 | 89898 |
| 2018-09-01 | 89906 |
| 2018-10-01 | 90347 |
| 2018-11-01 | 91068 |
| 2018-12-01 | 91821 |
| 2019-01-01 | 92954 |
| 2019-02-01 | 93338 |
| 2019-03-01 | 93403 |
| 2019-04-01 | 93483 |
| 2019-05-01 | 93969 |
| 2019-06-01 | 94741 |
| 2019-07-01 | 95150 |
| 2019-08-01 | 96025 |
| 2015-05-01 | 53079 |
|---|---|
| 2015-06-01 | 53243 |
| 2015-07-01 | 54235 |
| 2015-08-01 | 54973 |
| 2015-09-01 | 56028 |
| 2015-10-01 | 57126 |
| 2015-11-01 | 58243 |
| 2015-12-01 | 58961 |
| 2016-01-01 | 59721 |
| 2016-02-01 | 61781 |
| 2016-03-01 | 62267 |
| 2016-04-01 | 62508 |
| 2016-05-01 | 63145 |
| 2016-06-01 | 63834 |
| 2016-07-01 | 63948 |
| 2016-08-01 | 63303 |
| 2016-09-01 | 63121 |
| 2016-10-01 | 62969 |
| 2016-11-01 | 62533 |
| 2016-12-01 | 62227 |
| 2017-01-01 | 61800 |
| 2017-02-01 | 60925 |
| 2017-03-01 | 60644 |
| 2017-04-01 | 60094 |
| 2017-05-01 | 59159 |
| 2017-06-01 | 58688 |
| 2017-07-01 | 57878 |
| 2017-08-01 | 57208 |
| 2017-09-01 | 55762 |
| 2017-10-01 | 54602 |
| 2017-11-01 | 53827 |
| 2017-12-01 | 52640 |
| 2018-01-01 | 52654 |
| 2018-02-01 | 51473 |
| 2018-03-01 | 50550 |
| 2018-04-01 | 49894 |
| 2018-05-01 | 49757 |
| 2018-06-01 | 48920 |
| 2018-07-01 | 48733 |
| 2018-08-01 | 49197 |
| 2018-09-01 | 49898 |
| 2018-10-01 | 50543 |
| 2018-11-01 | 51850 |
| 2018-12-01 | 53822 |
| 2019-01-01 | 54558 |
| 2019-02-01 | 55729 |
| 2019-03-01 | 55367 |
| 2019-04-01 | 55063 |
| 2019-05-01 | 54538 |
| 2019-06-01 | 54274 |
| 2019-07-01 | 54954 |
| 2019-08-01 | 53809 |
There were provisionally 148,800 migrant arrivals and 93,400 migrant departures in the year ended March 2019.
Annual net migration was provisionally estimated at 55,400 (± 900) in the year ended March 2019 compared with 50,600 in the previous year.
The top source countries for arrivals were:
- Australia (26,300 - 15,800 of whom were New Zealand citizens)
- China (15,700)
- India (11,800).
Migrant arrivals and departures include the flows of New Zealand citizens, as well as the flows of non-New Zealand citizens, as both affect the population living in New Zealand.
"While most migrant arrivals are overseas citizens, about one in four were New Zealand citizens in the year ended March 2019, returning after being away from New Zealand for more than a year," Mr Islam said.
Migrant arrivals are people who have been living overseas, including New Zealand citizens, who cumulatively spend 12 of the next 16 months in New Zealand after arriving.
Migrant departures are people who have been living in New Zealand, including non-New Zealand citizens, who cumulatively spend 12 of the next 16 months out of New Zealand after departing.
Citizenship
There were 10,400 more migrant arrivals of non-New Zealand citizens in the year ended March 2019 compared with the year ended March 2018. Migrant arrivals of New Zealand citizens were down 800, resulting in an overall increase of 9,600.

Text alternative for diagram, Estimated migration (mean estimate), year ended March 2019
There were 4,000 more migrant departures of New Zealand citizens in the year ended March 2019 compared with the year ended March 2018. Migrant departures of non-New Zealand citizens were up 800, leading to an overall increase of 4,800 departures.
Why are we talking about migration for March 2019?
Annual arrival and departure data are subject to notably less revision at 5-6 months after the reference period. By this time there is more certainty about whether travellers are short-term or long-term (migrants), according to the 12/16-month rule.
The first provisional estimate of net migration for the March 2019 year (published in May 2019) was 56,100 (± 1,600). Over the past five months, this figure has been revised each month and is now 55,400 (± 900). Revisions for migrant arrivals and migrant departures can move in either direction. If they move in opposite directions, the estimated net migration figure is subject to larger changes.
The uncertainty bounds reflect the model uncertainty, not the extent of future revisions to the estimates.
Year ended August 2019 - provisional migration estimates
Some users of migration data may still want to look at the most recent provisional data. These give a timelier indication of migration levels, although have higher uncertainty and are therefore subject to larger revisions than provisional estimates for earlier periods.
Provisional estimates for the year ended August 2019:
- migrant arrivals - 149,800 (± 1,600)
- migrant departures - 96,000 (± 1,100)
- net migration gain - 53,800 (± 1,800).
Migration estimates for the year ended April 2018 have now been finalised with a net migration of 49,900.
We encourage customers to make their own judgement on whether to use the initial provisional migration estimates which have higher uncertainty, or provisional migration estimates 5-6 months after the reference period which have lower uncertainty. The uncertainty reflects the number of migrant outcomes that need to be modelled, compared with those which can be definitively classified according to the 12/16-month rule.
Extended migration time series
New migration back series in October
On 30 October 2019, national-level estimates of migrant arrivals, migrant departures, and net migration using the outcomes-based approach will be available back to January 2001; subnational migration estimates will be extended back to January 2013.
The new estimates fully supersede the published experimental series which was an early indication of the outcomes-based migration. The new estimates will be available from existing Infoshare series. There will be some small revisions to final migration estimates for June 2014 to April 2018, reflecting the improved and longer travel histories now available.
Move to quarterly commentaries
After consulting with customers on the options for publishing this release, we have decided to continue releasing international migration data each month in Infoshare. As advised last month, we will move from monthly to quarterly commentaries as these are sufficient to describe migration trends, which tend to change gradually.
This means the last monthly commentary will be in November 2019 when we publish September 2019 data. After that we will publish a quarterly commentary with December 2019 data in February 2020, with March data in May, and with June data in August.
Text alternative for diagram, Estimated migration (mean estimate), year ended March 2019
Diagram shows estimates for migrant arrivals, migrant departures, and net migration, for the year ended March 2019. Arrivals of non-New Zealand citizens were 113,600 (± 700) and departures were 47,500 (± 400), making a net migration gain of 66,100 (± 800) non-New Zealand citizens. Arrivals of New Zealand citizens were 35,200 (± 300) and departures were 45,900 (± 400), making a net migration loss of 10,800 (± 500) New Zealand citizens. Result is a total net migration gain of 55,400 (± 900). Note: The provisional estimates have 95 percent confidence intervals (±) alongside them - the wider the interval, the greater the uncertainty about the estimate. However, these intervals reflect the model uncertainty, not the extent of future revisions to provisional data.
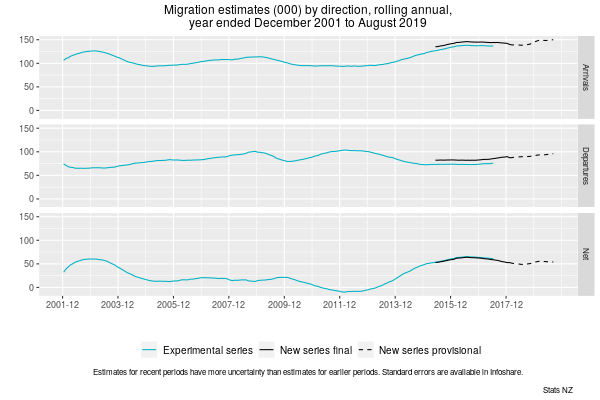
Text alternative for graph, Migration estimates (000) by direction, rolling annual, year ended December 2001 to August 2019
Three time-series line graphs show outcomes-based estimates for migrant arrivals, migrant departures, and net migration, from rolling annual years ended December 2001 to August 2019 - for experimental series and new series. The graphs show final estimates from May 2015 to March 2018, and provisional estimates from April 2018 to August 2019, for the new series of migration. An experimental series for December 2001 to June 2017 gives a longer time series.


