Migrant arrivals were provisionally estimated at 151,600 (± 1,500) and migrant departures at 93,200 (± 1,100) in the 12 months ended January 2019, Stats NZ said today. This resulted in a provisional estimate of annual net migration of 58,400 (± 1,600).
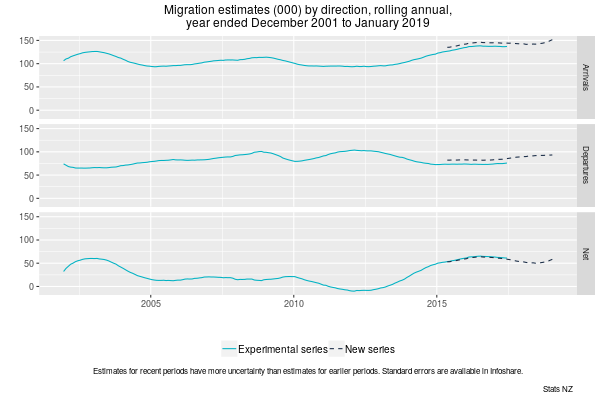
Figure 1 shows the final estimates from May 2015 to September 2017, and provisional estimates from October 2017 to January 2019, for the outcomes-based measure of migration. An experimental outcomes-based series is shown from December 2001 to June 2017 to give a longer time series.
Figure 1
The outcomes-based migration measure is a more accurate measure of migration than the previously used intentions-based permanent and long-term (PLT) measure, which concluded in October 2018 with the removal of the departure card. This is because the outcomes measure reflects actual – not intended – durations of stay/absence. The greater accuracy is also supported by historical population data.
With this new approach it takes 16 months before migration estimates are finalised. To produce timely results, we use a statistical model to produce provisional migration estimates. Our model will evolve as we get more data.
Migration data transformation has more information about the change to the outcomes-based migration measure, the use of modelling to provide provisional migration estimates, and the impact of revisions on the provisional migration estimates.
Revisions to previous estimates
Provisional migration estimates are a timely measure of migration but are subject to revision each month until they are finalised after 16 months using the outcomes-based measure. The revised estimates are more variable in the first few months, but the size of revisions to arrivals and departures are expected to reduce after about five months.
"The migration estimates generally become more certain after each subsequent month," population insights senior manager Brooke Theyers said. "Customers may prefer to wait a few months after the reference period to use the data depending on their needs."
Figure 2
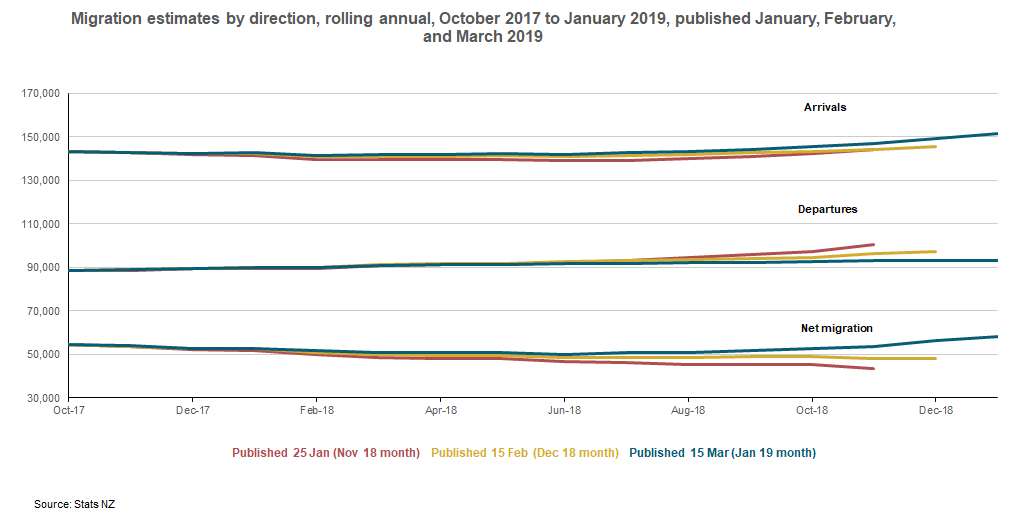
Figure 2 shows rolling annual migration estimates for migrant arrivals, migrant departures, and net migration, from October 2017 to January 2019. It shows the impact of revisions on previously published data.
Arrivals for the year ended December 2018 have been revised up 3,500 (2.4 percent) compared with last month's estimate. Departures have been revised down 4,500 (4.6 percent). The combined impact on estimated net migration is a revision from 48,300 to 56,200.
"Although the revisions are of a few percent for arrivals and departures, they were revised in opposite directions. As a result, the impact on net migration is larger," Mrs Theyers said.
Migration estimates up to September 2017 are now final. Provisional migration estimates from October 2017 to June 2018 are subject to small further revisions. Provisional migration estimates from July 2018 to January 2019 are subject to larger further revisions.
The large number of movements requiring modelling is the reason migration estimates are subject to revision. For example, nearly 14 million border movements occurred in the December 2018 year – 81 percent could be definitively classified as short-term or long-term when the provisional estimates were first released on 15 February 2019. The remaining 19 percent, or 2.6 million movements, were classified using our statistical model. In this release, the number of movements requiring modelling in the December 2018 year was down to 15 percent or 2.1 million.
The scale of monthly revisions to arrival and departure estimates is similar to modelled migration estimates in Australia.
Australian migration statistics
Official measures of Australia's migration have used the equivalent outcomes-based measure since 2007. The Australian Bureau of Statistics' provisional migration estimates are similarly revised . For example, 2016 is the latest calendar year to be finalised. Compared with the first provisional estimate published in June 2017, final migration estimates were:
- 1,500 (0.3 percent) lower for arrivals
- 36,400 (11.7 percent) lower for departures
- 34,900 higher for net migration.
New Zealand and non-New Zealand citizens
In the year ended January 2019, New Zealand was the largest country of citizenship for migrant arrivals – 36,400 (± 600), and migrant departures – 44,100 (± 700).
There was a net loss of 7,700 (± 800) New Zealand citizens – more left the country long-term than returned.
Figure 3
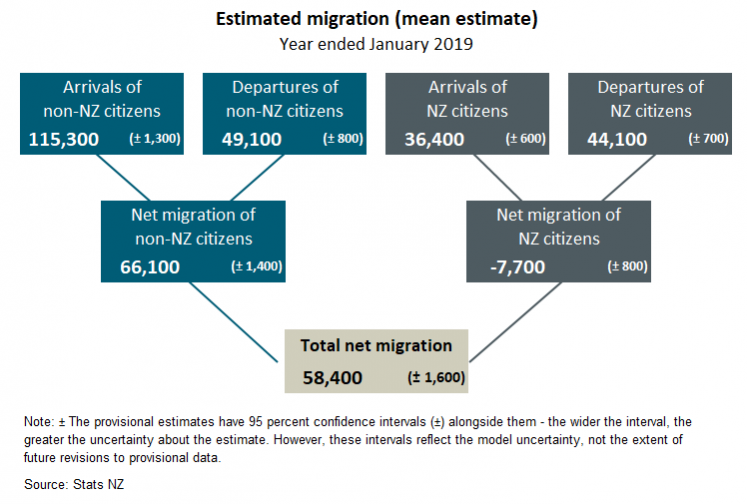
Text alternative for figure 3, Estimated migration (mean estimate), year ended January 2019.
Text alternative for figure 1
Three time-series line graphs show migration estimates for migrant arrivals, migrant departures, and net migration, from rolling annual years ended December 2001 to January 2019 – for experimental series and new series.
The graphs show final estimates from May 2015 to September 2017, and provisional estimates from October 2017 to January 2019, for the new series outcomes-based measure of migration. An experimental outcomes-based series for December 2001 to June 2017 gives a longer time series. The new series follows from the experimental series and shows similar ups and downs for migrant arrivals, migrant departures, and net migration.
Text alternative for figure 2
Time series line graph showing rolling annual migration estimates for migrant arrivals, migrant departures, and net migration, from October 2017 to January 2019.
The graph illustrates the impact of revisions on previously published data. Arrivals for the year ended December 2018 have been revised up, and departures revised down, compared with last month's estimates. As a result, the estimated net migration for the year ended December 2018 has been revised up.
Text alternative for figure 3
Diagram shows arrivals of non-NZ citizens were 115,300 (± 1,300) and departures were 49,100 (± 800), making a net migration gain of 66,100 (± 1,400) non-NZ citizens.
Arrivals of NZ citizens were 36,400 (± 600) and departures were 44,100 (± 700), making a net migration loss of 7,700 (± 800) NZ citizens.
Result is total net migration of 58,400 (± 1,600).
Note: ± The provisional estimates have 95 percent confidence intervals (±) alongside them - the wider the interval, the greater the uncertainty about the estimate. However, these intervals reflect the model uncertainty, not the extent of future revisions to provisional data.


