Annual net migration was provisionally estimated at 50,900 (± 900) in the year ended January 2019 compared with 52,700 in the previous year, Stats NZ said today.
Despite the fall in net migration, provisional estimates of migrant arrivals increased in the year ended January 2019, up 4,000 to 144,200. The top source countries for arrivals were:
- Australia (25,100 - 15,200 of which were NZ citizens)
- China (14,700)
- India (12,600)
- United Kingdom (10,200).
Provisional estimates of migrant departures were also up 5,800 to 93,300. The larger increase for departures meant net migration for the year ended January 2019 was down 1,800 when compared with the year ended January 2018.
"Net migration continues to remain at historically high levels," population indicators manager Tehseen Islam said.
"This has been the case since 2014, with a peak in 2016."
Citizenship
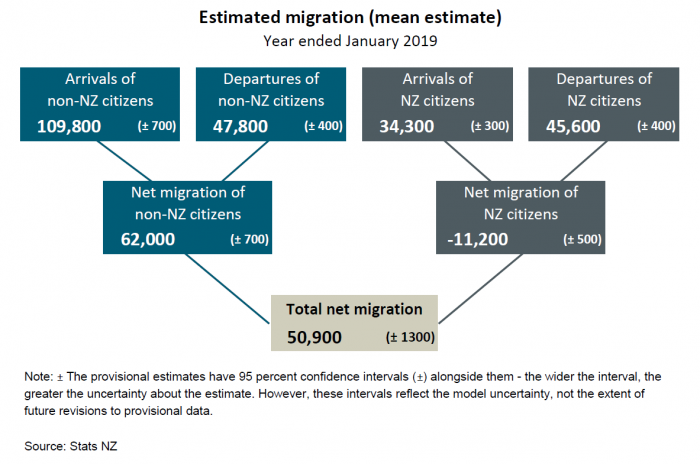
In the year ended January 2019 there were 109,800 migrant arrivals for non-New Zealand citizens and 47,800 migrant departures for a net gain of 62,000 non-New Zealand citizens.
The number of non-New Zealand citizen departures was higher than that of departures for New Zealand citizens (45,600), but New Zealand citizens had much fewer arrivals (34,300) leading to a net loss of 11,200 New Zealand citizens.
Text alternative for diagram, Estimated migration (mean estimate), year ended January 2019.
Why are we talking about migration for January 2019?
Annual arrival and departure data are subject to notably less revision at 5-6 months after the reference period. By this time there is more certainty about whether travellers are short-term or long-term (migrants), according to the 12/16-month rule.
The first provisional estimate of net migration for the January 2019 year (published in March 2019) was 58,400 (± 1,600). Over the past 5 months, this figure has been revised down to 50,900 (± 1,300). The uncertainty bounds reflect the model uncertainty, not the extent of future revisions to the estimates.
Year ended June 2019 - provisional migration estimates
Some users of migration data may still want to look at the most recent provisional data.
Provisional estimates for the year ended June 2019:
- migrant arrivals - 145,300 (± 1,400)
- migrant departures - 95,900 (± 1,400)
- net migration gain - 49,400 (± 1,700).
Migration estimates for the year ended February 2018 have now been finalised with a net migration of 51,500.
Final estimates of subnational migration now available
This month, we've resumed international migration statistics by New Zealand place of residence. These statistics previously relied on address information supplied on passenger cards, but now use geographic information from the Integrated Data Infrastructure (IDI). For the first time, statistics for Auckland can now be disaggregated further to the 21 local board areas. For information on the new method, see Subnational Migration - DataInfo+.
Subnational estimates of final migrant arrivals and departures, and net migration, are available for years ended May 2015 to February 2018 and monthly back to June 2014. The geographic breakdowns of migration are available for New Zealand's 16 regional council areas, 67 territorial authority areas, and 21 Auckland local board areas.
The graphs below show the difference in net migration between the 12/16-month rule outcomes-based measure and the old PLT (permanent and long term) intentions-based measure.
Differences in net migration between the two measures reflect several factors. The outcomes measure is a more accurate measure of national migration levels. It is also a better measure of where migrant arrivals end up going, and where migrant departures leave from, within New Zealand. This is because it is based on actual outcomes, not stated intentions on passenger cards. The new method for determining place of residence also has higher response rates than was obtained from passenger cards.
"Differences in net migration between the two measures have been more significant for Auckland where they appear to have been overstated by the PLT measure," Mr Islam said.
"This was true for New Zealand overall, where the old measure overstated net migration by about 34,000 between 2015 and 2017."
Over the three-year period ended February 2018, estimated net migration for Auckland based on the outcomes measure was 85,600 (187,800 migrant arrivals and 102,200 migrant departures). In comparison, net migration based on the intentions-based measure was 101,300 (168,200 PLT arrivals and 66,900 PLT departures).
"Other regions like Northland and Bay of Plenty, however, have been understated. This reflects the difference in where people say they are migrating to and where they actually end up going."
We are currently assessing the frequency that these subnational statistics will be released and assessing a method for producing subnational provisional migration estimates.
Update on statistics and methods
An extended migration series back to the early 2000s will be available by October 2019, following finalisation of longitudinal travel histories to enable the outcomes-based measure to be derived. Revised national population estimates back to the September 2013 quarter, being published on 15 August 2019, are using interim backcast net migration estimates. These population estimates for the 2013-18 period will be revised again by March 2020 to incorporate 2018 Census and 2018 Post-enumeration Survey results, and any updated final birth, death, and migration estimates.
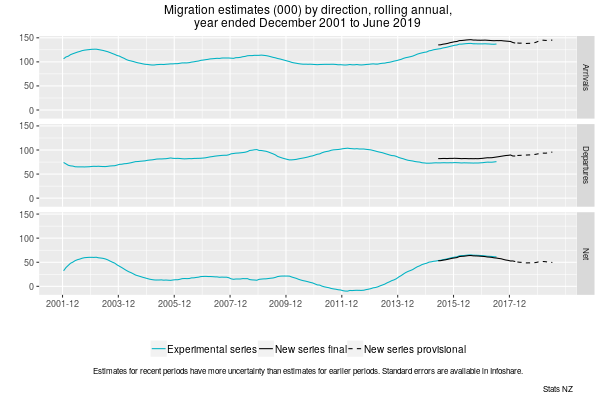
Text alternative for graph, Migration estimates (000) by direction, rolling annual, year ended December 2001 to June 2019
Three time-series line graphs show outcomes-based estimates for migrant arrivals, migrant departures, and net migration, from rolling annual years ended December 2001 to June 2019 - for experimental series and new series. The graphs show final estimates from May 2015 to February 2018, and provisional estimates from March 2018 to June 2019, for the new series of migration. An experimental series for December 2001 to June 2017 gives a longer time series.
Text alternative for diagram, Estimated migration (mean estimate), year ended January 2019
Diagram shows estimates for migrant arrivals, migrant departures, and net migration, for the year ended January 2019. Arrivals of non-New Zealand citizens were 109,800 (± 700) and departures were 47,800 (± 400), making a net migration gain of 62,000 (± 900) non-New Zealand citizens. Arrivals of New Zealand citizens were 34,300 (± 300) and departures were 45,600 (± 400), making a net migration loss of 11,200 (± 500) New Zealand citizens. Result is a total net migration gain of 50,900 (± 1300). Note: The provisional estimates have 95 percent confidence intervals (±) alongside them - the wider the interval, the greater the uncertainty about the estimate. However, these intervals reflect the model uncertainty, not the extent of future revisions to provisional data.
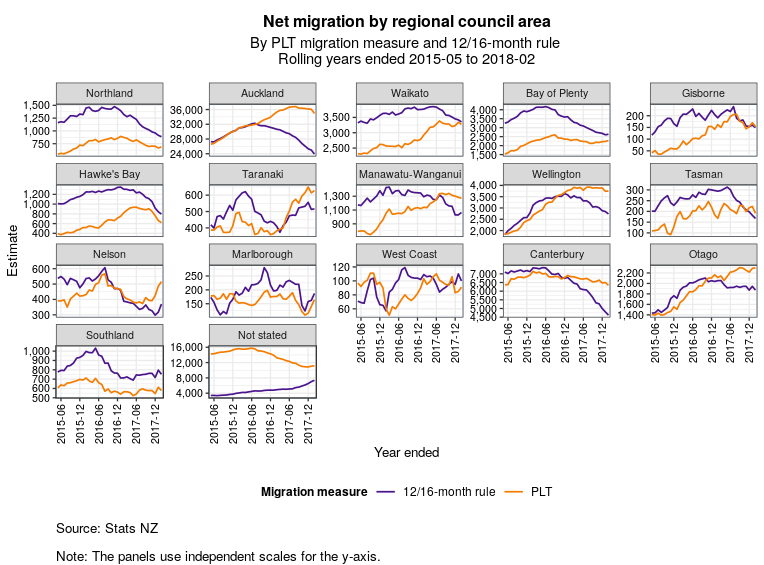
Text alternative for diagram, Net migration by regional council area by PLT migration measure and 12/16-month rule, rolling year ended 2015-05 to 2018-02
Sixteen time series line graphs show net migration by each of the regional council areas for rolling years ended May 2015 to February 2018. Each graph compares net migration figures using the PLT intentions-based migration measure and finalised migration estimates from the 12/16-month-rule outcomes-based measure. An additional time series line graph is included for the not stated category.
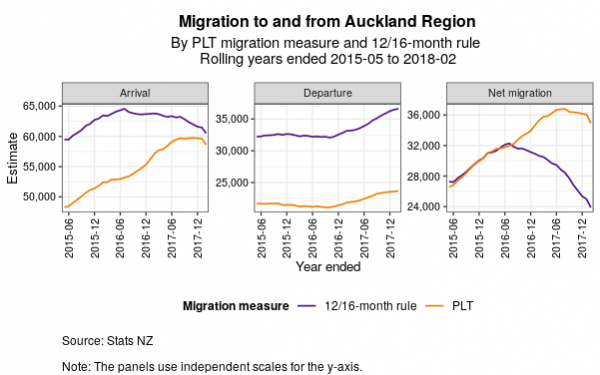
Text alternative for graph, Migration to and from the Auckland Region by PLT migration measure and 12/16-month rule, rolling year ended 2015-05 to 2018-02
Three times series line graphs show the migrant arrivals, migrant departures, and net migration for the Auckland region for rolling years ended May 2015 to February 2018. Each compares the rolling year ended figures for the PLT intentions-based migration measure and the second final estimates from the 12/16-month rule outcomes-based migration measure.


