The national number of new homes consented per 1,000 residents was 9.8 in the year ended October 2022, up from 9.4 in the previous year, Stats NZ said today.
The highest number of new homes consented per 1,000 residents nationally was 13.4 in the year ended December 1973, and the lowest was 3.0 in the July 2011 year, after the global financial crisis.
"The number of new homes consented per 1,000 residents is useful for comparing the number of new homes consented across the regions, as it accounts for the difference in population between areas," construction and property statistics manager Michael Heslop said.
The number of new homes consented fluctuates, while the estimated resident population changes gradually over time.
In the year ended October 2022, the territorial authorities with the highest number of new homes consented per 1,000 residents were Queenstown-Lakes district, Selwyn district, and Mackenzie district.
"The number of new homes consented per 1,000 residents can be high in popular holiday areas, as holidaymakers and tourists are excluded from the estimated resident population," Heslop said.
"But some of the places they stay, such as holiday homes, are included in the number of homes consented."
Maungakiekie-Tāmaki led Auckland local board areas with the number of 29.3 over the same period.
Regional breakdown
In the year ended October 2022, Canterbury had the highest number of new homes consented per 1,000 residents among 16 regions.
"Both Canterbury and Auckland reached records for the number of homes consented per 1,000 residents," Heslop said.
The four regions with the highest number of new homes consented per 1,000 residents were:
- Canterbury with 13.3 (up from 11.5 in the year ended October 2021)
- Auckland with 13.0 (up from 11.7)
- Tasman with 10.8 (up from 8.9)
- Otago with 10.1 (up from 9.2).
| Region | 2022 |
| Gisborne | 3.2 |
| Hawke's Bay | 4.4 |
| Southland | 4.4 |
| Taranaki | 4.6 |
| Marlborough | 4.8 |
| Manawatū-Whanganui | 5.4 |
| Nelson | 5.5 |
| Bay of Plenty | 6.1 |
| Wellington | 6.8 |
| Northland | 7.4 |
| West Coast | 8.5 |
| Waikato | 9.6 |
| Otago | 10.1 |
| Tasman | 10.8 |
| Auckland | 13 |
| Canterbury | 13.3 |
National population estimates are updated quarterly, and subnational population estimates are updated annually in October and are provisional. For more information about estimated resident population see Population.
More data on subnational population estimates can be found in the Excel table 'Subnational population estimates: At 30 June 2022 (provisional)', available under Download data.
More data on the number of homes consented per 1,000 residents can be found in tables 8 and 9 in the Excel table 'Building consents issued: October 2022', available under Download data.
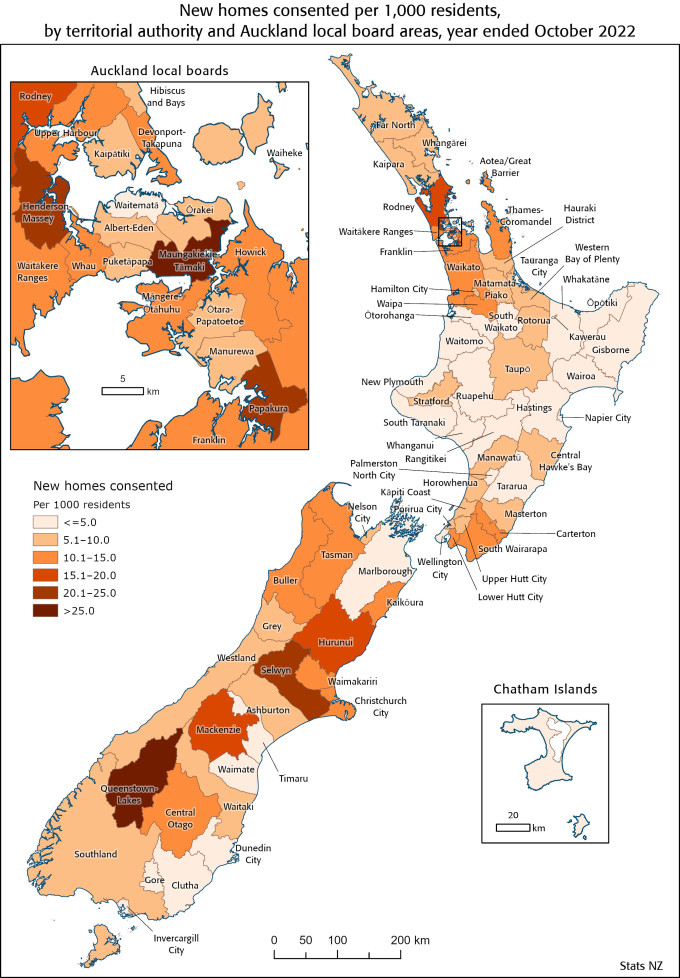
Text alternative for map New homes consented per 1,000 residents, by territorial authority and Auckland local board areas, year ended October 2022
New homes consented per 1,000 residents, by territorial authority and Auckland local board areas, year ended October 2022. The map shows the territorial authority and Auckland local board areas, each assigned a colour to show the range in number of new homes consented per 1,000 residents in the year ended October 2022. They are grouped into: less than 5.0; greater than 5.0 to 10.0; greater than 10.0 to 15.0; greater than 15.0 to 20.0; greater than 20.0 to 25.0; and greater than 25.0. The number of new homes consented per 1,000 residents ranged from 1.2 in Chatham Islands territory to 29.3 in Maungakiekie-Tāmaki local board area.


