New Zealand residents arrived back from 3.01 million short-term overseas trips (of less than 12 months) in the March 2025 year, according to data released by Stats NZ today.
March 2025 is the first annual period to exceed 3 million arrivals by New Zealand-resident travellers since March 2020 (3.05 million), and was up from 2.84 million in the March 2024 year.
"The number of short-term overseas trips by New Zealand residents climbed 6 percent in the March 2025 year, compared to the year before," international travel spokesperson Sarah Drake said.
"The increase was mainly driven by more trips to Australia, as well as Indonesia, China, and Japan."
| Year ended March | Number |
| 1996 | 942606 |
| 1997 | 1098660 |
| 1998 | 1123573 |
| 1999 | 1182095 |
| 2000 | 1210101 |
| 2001 | 1303702 |
| 2002 | 1293359 |
| 2003 | 1320404 |
| 2004 | 1451854 |
| 2005 | 1795279 |
| 2006 | 1883162 |
| 2007 | 1885577 |
| 2008 | 2012382 |
| 2009 | 1953712 |
| 2010 | 1942694 |
| 2011 | 2047483 |
| 2012 | 2128505 |
| 2013 | 2168179 |
| 2014 | 2253761 |
| 2015 | 2351884 |
| 2016 | 2502833 |
| 2017 | 2706605 |
| 2018 | 2874455 |
| 2019 | 3049723 |
| 2020 | 3048499 |
| 2021 | 37772 |
| 2022 | 181064 |
| 2023 | 1841872 |
| 2024 | 2844193 |
| 2025 | 3013326 |
COVID-19-related border and travel restrictions both in New Zealand and overseas from March 2020 to March 2022 saw international travel numbers fall to low levels.
Aucklanders and Wellingtonians most frequent flyers
New Zealand residents averaged 57 international trips for every 100 people living in New Zealand in the March 2025 year. This compared with 62 trips per 100 residents in the March 2019 year, before the COVID-19 pandemic.
Among New Zealand's 16 regions, residents of Auckland and Wellington typically take more than the national average number of international trips per 100 residents. This was again the case in the March 2025 year.
Auckland region residents averaged 75 trips per 100 residents, followed by Wellington region residents who averaged 59 trips per 100 residents.
These rates were both down from the March 2019 year, when Auckland region residents averaged 82 trips per 100 residents, and Wellington region residents averaged 64 trips per 100 residents.
| Regional Council area | Year ended March 2019 | Year ended March 2025 |
| New Zealand | 62.2 | 57 |
| Northland Region | 37.3 | 37.2 |
| Auckland Region | 81.7 | 75.4 |
| Waikato Region | 46.3 | 44.7 |
| Bay of Plenty Region | 47.4 | 46.2 |
| Gisborne Region | 29.3 | 31.4 |
| Hawke's Bay Region | 37.9 | 38.7 |
| Taranaki Region | 37.5 | 37.6 |
| Manawatū-Whanganui Region | 34.2 | 33.5 |
| Wellington Region | 63.6 | 58.8 |
| Tasman Region | 41.6 | 40.5 |
| Nelson Region | 47.6 | 45.2 |
| Marlborough Region | 41 | 38.6 |
| West Coast Region | 31.2 | 29.7 |
| Canterbury Region | 55.7 | 52.7 |
| Otago Region | 51.5 | 51.2 |
| Southland Region | 30.9 | 31.6 |
West Coasters least frequent flyers
West Coast region residents averaged 30 trips per 100 residents in the March 2025 year, the lowest of the regions. This was behind residents of the Gisborne region and Southland region with 31 trips per 100 residents and 32 trips per 100 residents, respectively.
Auckland local board areas lead smaller geographies
Auckland local board areas held 9 of the top 10 highest overseas trip rates in the March 2025 year. This is across New Zealand's 67 territorial authority and 21 Auckland local board areas, which are below the regional level.
They were led by residents of Ōrākei (124 trips per 100 residents), Waitematā (118 trips per 100), and Devonport-Takapuna (101 trips per 100).
Queenstown-Lakes District residents had the fifth highest rate, averaging 90 trips per 100 residents, and was the only area outside of the Auckland local board areas in the top 10.
By comparison, the lowest overseas trip rates were for residents of Kawerau District (18 per 100 residents), Wairoa District (20 per 100), and the Chatham Islands (24 per 100).
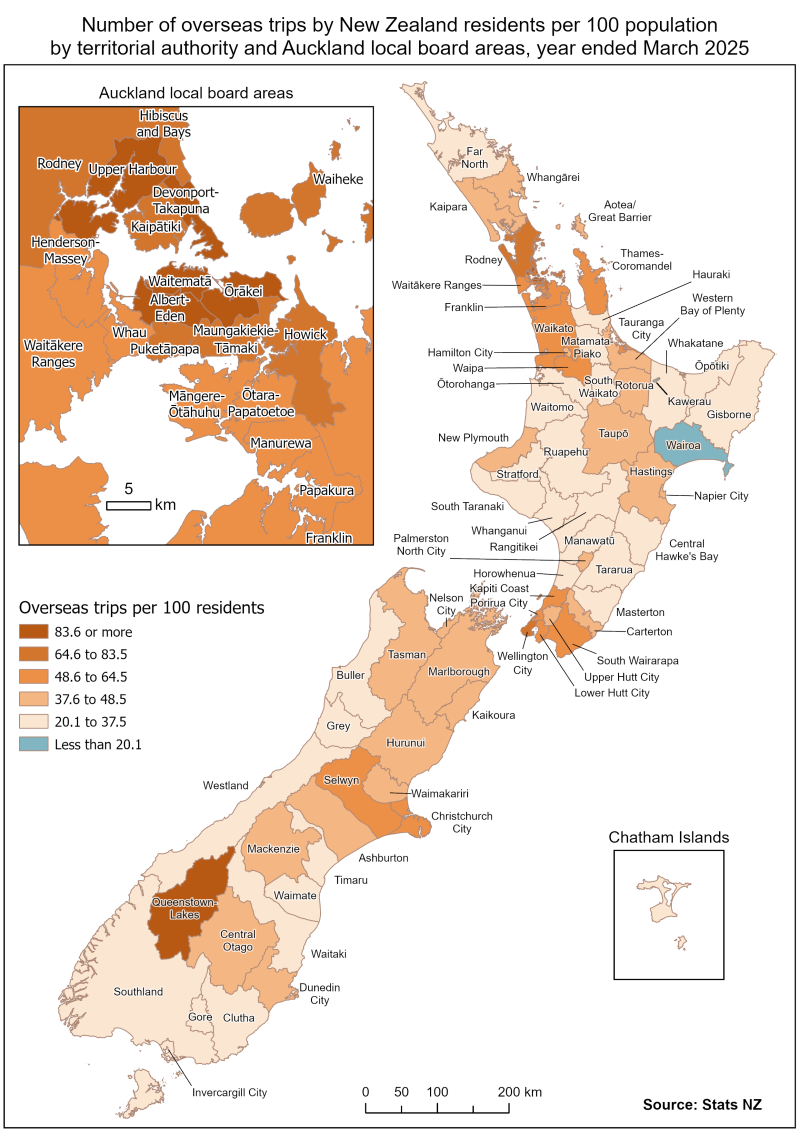
Text alternative for Number of overseas trips by New Zealand residents per 100 population by territorial authority and Auckland local board areas, year ended March 2025
The map shows the territorial authority and Auckland local board areas, each of which is assigned a colour to show the number of overseas trips by New Zealand residents per 100 population. The colours are grouped as: less than 20.1 trips per 100 residents; 20.1 to 37.5 trips per 100 residents; 37.6 to 48.5 trips per 100 residents; 48.6 to 64.5 trips per 100 residents; 64.6 to 83.5 trips per 100 residents; and 83.6 trips or more per 100 residents. The number of New Zealand resident trips per 100 residents in the year ended March 2025 ranged from 18.2 per 100 residents in Kawerau District, to 123.9 per 100 residents in the Ōrākei Auckland local board area. The New Zealand average was 57.0 trips per 100 residents.
The population denominator for the rates is the estimated resident population at 30 June in each year.


