Overseas merchandise trade statistics provide information on imports and exports of merchandise goods between New Zealand and other countries.
Key facts
This release refers to trade in goods only.
In September 2025, compared with September 2024:
- goods exports rose by $928 million (19 percent), to $5.8 billion
- goods imports rose by $116 million (1.6 percent), to $7.2 billion
- the monthly trade balance was a deficit of $1.4 billion.
| Year | Exports | Imports |
| 2005 | 2352508990 | 3323596602 |
| 2006 | 2824062679 | 3449535246 |
| 2007 | 2932976619 | 3505031320 |
| 2008 | 3173002222 | 4424918455 |
| 2009 | 2.82E+09 | 3.38E+09 |
| 2010 | 3171664736 | 3626300053 |
| 2011 | 3441832820 | 4230267229 |
| 2012 | 3287453264 | 4078255803 |
| 2013 | 3817109089 | 4038045426 |
| 2014 | 3616123559 | 4975086593 |
| 2015 | 3676655263 | 4816669481 |
| 2016 | 3466365718 | 4854353107 |
| 2016 | 3792008319 | 4957218173 |
| 2018 | 4252716558 | 5832638270 |
| 2019 | 4355729863 | 5665667011 |
| 2020 | 3900138418 | 5032472847 |
| 2021 | 4396198190 | 6562231976 |
| 2022 | 5910355840 | 8430027312 |
| 2023 | 4765886803 | 7186725659 |
| 2024 | 4895409646 | 7061877726 |
| 2025 | 5823216644 | 7178182396 |
Exports
Goods exports rose by $928 million (19 percent) in September 2025 (to $5.8 billion), compared with September 2024.
Milk powder, butter, and cheese rose $289 million (27 percent), to $1.4 billion.
September ($ million) |
Change ($ million) |
Change |
Change |
Change |
|
Milk powder, butter, and cheese |
1,361 |
289 |
27% |
* |
* |
Milk powder |
579 |
165 |
40% |
10% |
27% |
Milk fats (including butter) |
325 |
23 |
7.7% |
-4.5% |
13% |
Cheese |
207 |
41 |
25% |
7.0% |
16% |
Fresh milk and cream |
166 |
43 |
36% |
* |
9.3% |
* Changes in total quantity and unit price are omitted due to differences in units of measure. |
|||||
Kiwifruit export value rose $1.2 billion (36 percent) to $4.5 billion in the year ended September 2025, compared with the year ended September 2024.
| Year ended | Value |
| Sep-05 | 668703280 |
| Sep-06 | 765485754 |
| Sep-07 | 737100617 |
| Sep-08 | 970422695 |
| Sep-09 | 1051532229 |
| Sep-10 | 971401855 |
| Sep-11 | 1020750255 |
| Sep-12 | 1056688712 |
| Sep-13 | 832899922 |
| Sep-14 | 1004250337 |
| Sep-15 | 1374279998 |
| Sep-16 | 1665031741 |
| Sep-17 | 1733905041 |
| Sep-18 | 2049726606 |
| Sep-19 | 2328368188 |
| Sep-20 | 2676270845 |
| Sep-21 | 2690779474 |
| Sep-22 | 2708133691 |
| Sep-23 | 2563348009 |
| Sep-24 | 3311694096 |
| Sep-25 | 4491014930 |
Top monthly export movements by country
The monthly movements in September 2025, compared with September 2024, for our top export partners (in order of total annual goods exports) were:
- China: total exports were up $266 million (24 percent).
- The largest rises were milk powder, butter, and cheese, up $176 million; preparations of milk, cereals, flour, and starch, up $51 million; and casein and caseinates, up $32 million.
- The largest falls were fruit, down $78 million and fish, crustaceans, and molluscs, down $24 million.
- Australia: total exports were up $205 million (28 percent).
- The largest rises were precious metals, jewellery, and coins, up $71 million; crude oil, up $68 million; and milk powder, butter, and cheese, up $34 million.
- The largest fall was beverages, spirits, and vinegar, down $13 million.
- USA: total exports were up $58 million (10 percent).
- The largest rises were animal or vegetable fats and oils, up $26 million; fruit, up $15 million; and pharmaceutical products, up $12 million.
- The largest fall was mechanical machinery and equipment, down $20 million.
- EU: total exports were up $67 million (15 percent).
- The largest rises were aluminium and aluminium articles, up $41 million; fruit, up $27 million; and meat and edible offal, up $21 million.
- The largest fall was mechanical machinery and equipment, down $46 million.
- Japan: total exports were up $55 million (23 percent).
- The largest rises were fruit, up $34 million; milk powder, butter, and cheese, up $17 million; and meat and edible offal, up $14 million.
- The largest fall was logs, wood, and wood articles, down $15 million.
Imports
Goods imports rose by $116 million (1.6 percent), in September 2025 (to $7.2 billion), compared with September 2024.
Passenger cars driving increase in imports
Vehicles, parts, and accessories imports rose $220 million (35 percent). This was led by motor vehicles, up $133 million (34 percent).
| Year ended | Value |
| Jan-17 | 4877055874 |
| Feb-17 | 4949715576 |
| Mar-17 | 5078676973 |
| Apr-17 | 5096730680 |
| May-17 | 5182835943 |
| Jun-17 | 5297703035 |
| Jul-17 | 5429265997 |
| Aug-17 | 5387765276 |
| Sep-17 | 5377941838 |
| Oct-17 | 5441149246 |
| Nov-17 | 5487473220 |
| Dec-17 | 5441568277 |
| Jan-18 | 5444804922 |
| Feb-18 | 5318703887 |
| Mar-18 | 5316368951 |
| Apr-18 | 5426215241 |
| May-18 | 5504253157 |
| Jun-18 | 5459351437 |
| Jul-18 | 5412651735 |
| Aug-18 | 5428244207 |
| Sep-18 | 5482499992 |
| Oct-18 | 5401825359 |
| Nov-18 | 5223174679 |
| Dec-18 | 5204093758 |
| Jan-19 | 5256784402 |
| Feb-19 | 5349443640 |
| Mar-19 | 5255391383 |
| Apr-19 | 5071184216 |
| May-19 | 4930813579 |
| Jun-19 | 4863172943 |
| Jul-19 | 4850096291 |
| Aug-19 | 4810002215 |
| Sep-19 | 4832201247 |
| Oct-19 | 4805916033 |
| Nov-19 | 4905581400 |
| Dec-19 | 4914815313 |
| Jan-20 | 4808179724 |
| Feb-20 | 4779488260 |
| Mar-20 | 4807755969 |
| Apr-20 | 4688907491 |
| May-20 | 4444544070 |
| Jun-20 | 4255152924 |
| Jul-20 | 4021422715 |
| Aug-20 | 3888709240 |
| Sep-20 | 3778528069 |
| Oct-20 | 3795395944 |
| Nov-20 | 3713452222 |
| Dec-20 | 3753454113 |
| Jan-21 | 3813330622 |
| Feb-21 | 3935217932 |
| Mar-21 | 4033951313 |
| Apr-21 | 4223092506 |
| May-21 | 4626554737 |
| Jun-21 | 4980174141 |
| Jul-21 | 5296648767 |
| Aug-21 | 5563156002 |
| Sep-21 | 5703499830 |
| Oct-21 | 5849409721 |
| Nov-21 | 5936747992 |
| Dec-21 | 6040953164 |
| Jan-22 | 6006841597 |
| Feb-22 | 6054954472 |
| Mar-22 | 6073193069 |
| Apr-22 | 6111119683 |
| May-22 | 6106109455 |
| Jun-22 | 6074010471 |
| Jul-22 | 6166189132 |
| Aug-22 | 6144853269 |
| Sep-22 | 6249706306 |
| Oct-22 | 6421763376 |
| Nov-22 | 6698800344 |
| Dec-22 | 6748800191 |
| Jan-23 | 6798885477 |
| Feb-23 | 6829367209 |
| Mar-23 | 6857282682 |
| Apr-23 | 6866090791 |
| May-23 | 6894906517 |
| Jun-23 | 7000225243 |
| Jul-23 | 7004231584 |
| Aug-23 | 7180961302 |
| Sep-23 | 7230908749 |
| Oct-23 | 7165390935 |
| Nov-23 | 6982857871 |
| Dec-23 | 6895031271 |
| Jan-24 | 6857455176 |
| Feb-24 | 6780814056 |
| Mar-24 | 6675314093 |
| Apr-24 | 6607170807 |
| May-24 | 6492628010 |
| Jun-24 | 6352253413 |
| Jul-24 | 6185374106 |
| Aug-24 | 5818035659 |
| Sep-24 | 5548834044 |
| Oct-24 | 5354347101 |
| Nov-24 | 5247062065 |
| Dec-24 | 5150369452 |
| Jan-25 | 5139044217 |
| Feb-25 | 5062572158 |
| Mar-25 | 5013540208 |
| Apr-25 | 4963223944 |
| May-25 | 4915731814 |
| Jun-25 | 4918668720 |
| Jul-25 | 5017893878 |
| Aug-25 | 5112301452 |
| Sep-25 | 5246246598 |
Top monthly import movements by country
The monthly movements in September 2025, compared with September 2024, for our top import partners (in order of total annual goods imports) were:
- China: total imports were up $228 million (16 percent).
- The largest rises were vehicles, parts, and accessories, up $68 million; mechanical machinery and equipment, up $53 million; and electrical machinery and equipment, up $39 million.
- There were no significant falls over $10 million.
- EU: total imports were up $79 million (7.3 percent).
- The largest rises were aircraft and parts, up $53 million; mechanical machinery and equipment, up $29 million; and pharmaceutical products, up $26 million.
- The largest fall was vehicles, parts, and accessories, down $74 million.
- Australia: total imports were up $46 million (6.4 percent).
- The largest rises were inorganic chemicals, up $46 million and cereals, up $13 million.
- The largest falls were sugars and sugar confectionery, down $25 million; salt, earths, stone, lime, and cement, down $14 million; and precious metals, jewellery, and coins, down $11 million.
- USA: total imports were down $286 million (30 percent).
- The largest rises were mechanical machinery and equipment, up $64 million and cereals, up $15 million.
- The largest falls were aircraft and parts, down $352 million and electrical machinery and equipment, down $19 million.
- South Korea: total imports were down $28 million (4.8 percent).
- There were no significant rises over $10 million.
- The largest fall was petroleum and products, down $49 million.
Trade deficit in September 2025
The monthly trade balance was a deficit of $1.4 billion.
| Date | Trade balance |
| Sep-16 | -1387987389 |
| Oct-16 | -797651150 |
| Nov-16 | -723201112 |
| Dec-16 | -1435171 |
| Jan-17 | -226543047 |
| Feb-17 | -42276469 |
| Mar-17 | 261589138 |
| Apr-17 | 546879922 |
| May-17 | 62020162 |
| Jun-17 | 243117487 |
| Jul-17 | 92027349 |
| Aug-17 | -1174342582 |
| Sep-17 | -1165209854 |
| Oct-17 | -839633458 |
| Nov-17 | -1222417301 |
| Dec-17 | 614310559 |
| Jan-18 | -662421494 |
| Feb-18 | 188256546 |
| Mar-18 | -150609406 |
| Apr-18 | 199745211 |
| May-18 | 199288004 |
| Jun-18 | -285260079 |
| Jul-18 | -203110333 |
| Aug-18 | -1566757996 |
| Sep-18 | -1579921712 |
| Oct-18 | -1305105133 |
| Nov-18 | -1003973060 |
| Dec-18 | 9286883 |
| Jan-19 | -934926531 |
| Feb-19 | -93584137 |
| Mar-19 | 825181314 |
| Apr-19 | 360963002 |
| May-19 | 174927698 |
| Jun-19 | 329812747 |
| Jul-19 | -732335397 |
| Aug-19 | -1641634097 |
| Sep-19 | -1309937148 |
| Oct-19 | -1038380593 |
| Nov-19 | -786493088 |
| Dec-19 | 379772255 |
| Jan-20 | -395635011 |
| Feb-20 | 550639307 |
| Mar-20 | 522807892 |
| Apr-20 | 1374019783 |
| May-20 | 1222702687 |
| Jun-20 | 416538602 |
| Jul-20 | 387761796 |
| Aug-20 | -320606284 |
| Sep-20 | -1132334429 |
| Oct-20 | -465913506 |
| Nov-20 | 679104 |
| Dec-20 | 230069561 |
| Jan-21 | -729765438 |
| Feb-21 | 449847010 |
| Mar-21 | -182555509 |
| Apr-21 | 557914991 |
| May-21 | 404936125 |
| Jun-21 | 442108253 |
| Jul-21 | -387158502 |
| Aug-21 | -2132508281 |
| Sep-21 | -2166033786 |
| Oct-21 | -1282573004 |
| Nov-21 | -1085761728 |
| Dec-21 | -990246456 |
| Jan-22 | -1106744295 |
| Feb-22 | -714801157 |
| Mar-22 | -593488596 |
| Apr-22 | 469495559.5 |
| May-22 | 148263036 |
| Jun-22 | -1132868318 |
| Jul-22 | -1415192071 |
| Aug-22 | -2634137110 |
| Sep-22 | -2519671472 |
| Oct-22 | -2315527621 |
| Nov-22 | -2183787239 |
| Dec-22 | -650530508 |
| Jan-23 | -2095237898 |
| Feb-23 | -846757630 |
| Mar-23 | -1602490156 |
| Apr-23 | 220854073 |
| May-23 | 41615990.2 |
| Jun-23 | -114738381 |
| Jul-23 | -1174149043 |
| Aug-23 | -2266681329 |
| Sep-23 | -2420838856 |
| Oct-23 | -1732504563 |
| Nov-23 | -1258971689 |
| Dec-23 | -372771305 |
| Jan-24 | -1064170538 |
| Feb-24 | -318989147 |
| Mar-24 | 469883412 |
| Apr-24 | -11882445 |
| May-24 | 59494662 |
| Jun-24 | 577124190 |
| Jul-24 | -1021575122 |
| Aug-24 | -2316015330 |
| Sep-24 | -2166468080 |
| Oct-24 | -1653634248 |
| Nov-24 | -449804544 |
| Dec-24 | 36046105 |
| Jan-25 | -549356414 |
| Feb-25 | 443569867 |
| Mar-25 | 789871688 |
| Apr-25 | 1197956921 |
| May-25 | 1101679700 |
| Jun-25 | 158296735 |
| Jul-25 | -731615938 |
| Aug-25 | -1234532520 |
| Sep-25 | -1354965752 |
September 2025 quarter
September 2025 values are seasonally adjusted and compared with the June 2025 quarter.
- Goods exports rose 3.6 percent ($704 million) to $20.3 billion, following a 3.4 percent fall in the June 2025 quarter.
- Goods imports fell 0.1 percent ($23 million) to $20.4 billion, following a 0.6 percent fall in the June 2025 quarter.
- The quarterly trade balance was a deficit of $20 million.
September 2025 year
Annual values are actual and compared with the year ended September 2024.
- Annual goods exports were valued at $78.6 billion, up $9.4 billion from the previous year.
- Annual goods imports were valued at $80.9 billion, up $2.5 billion from the previous year.
- The annual trade deficit was $2.2 billion. In the year ended September 2024 the deficit was $9.2 billion.
| Month | Trade balance |
| Sep-16 | -3353967015 |
| Oct-16 | -3246795580 |
| Nov-16 | -3174570464 |
| Dec-16 | -3134099782 |
| Jan-17 | -3372963060 |
| Feb-17 | -3782164840 |
| Mar-17 | -3709425552 |
| Apr-17 | -3512075703 |
| May-17 | -3793134384 |
| Jun-17 | -3656807285 |
| Jul-17 | -3213352131 |
| Aug-17 | -3147802862 |
| Sep-17 | -2925025327 |
| Oct-17 | -2967007635 |
| Nov-17 | -3466223824 |
| Dec-17 | -2850478094 |
| Jan-18 | -3286356541 |
| Feb-18 | -3055823526 |
| Mar-18 | -3468022070 |
| Apr-18 | -3815156781 |
| May-18 | -3677888939 |
| Jun-18 | -4206266505 |
| Jul-18 | -4501404187 |
| Aug-18 | -4893819601 |
| Sep-18 | -5308531459 |
| Oct-18 | -5774003134 |
| Nov-18 | -5555558893 |
| Dec-18 | -6160582569 |
| Jan-19 | -6433087606 |
| Feb-19 | -6714928289 |
| Mar-19 | -5739137569 |
| Apr-19 | -5577919778 |
| May-19 | -5602280084 |
| Jun-19 | -4987207258 |
| Jul-19 | -5516432322 |
| Aug-19 | -5591308423 |
| Sep-19 | -5321323859 |
| Oct-19 | -5054599319 |
| Nov-19 | -4837119347 |
| Dec-19 | -4466633975 |
| Jan-20 | -3927342455 |
| Feb-20 | -3283119011 |
| Mar-20 | -3585492433 |
| Apr-20 | -2572435652 |
| May-20 | -1524660663 |
| Jun-20 | -1437934808 |
| Jul-20 | -317837615 |
| Aug-20 | 1003190198 |
| Sep-20 | 1180792917 |
| Oct-20 | 1753260004 |
| Nov-20 | 2540432196 |
| Dec-20 | 2390729502 |
| Jan-21 | 2056599075 |
| Feb-21 | 1955806778 |
| Mar-21 | 1250443377 |
| Apr-21 | 434338585 |
| May-21 | -383427977 |
| Jun-21 | -357858326 |
| Jul-21 | -1132778624 |
| Aug-21 | -2944680621 |
| Sep-21 | -3978379978 |
| Oct-21 | -4795039476 |
| Nov-21 | -5881480308 |
| Dec-21 | -7101796325 |
| Jan-22 | -7478775182 |
| Feb-22 | -8643423349 |
| Mar-22 | -9054356436 |
| Apr-22 | -9142775867 |
| May-22 | -9399448956 |
| Jun-22 | -10974425528 |
| Jul-22 | -12002459097 |
| Aug-22 | -12504087926 |
| Sep-22 | -12857725612 |
| Oct-22 | -13890680229 |
| Nov-22 | -14988705740 |
| Dec-22 | -14648989792 |
| Jan-23 | -15637483395 |
| Feb-23 | -15769439868 |
| Mar-23 | -16778441428 |
| Apr-23 | -17027082914 |
| May-23 | -17133729960 |
| Jun-23 | -16115600023 |
| Jul-23 | -15874556995 |
| Aug-23 | -15507101214 |
| Sep-23 | -15408268598 |
| Oct-23 | -14825245540 |
| Nov-23 | -13900429990 |
| Dec-23 | -13622670787 |
| Jan-24 | -12591603427 |
| Feb-24 | -12063834944 |
| Mar-24 | -9991461376 |
| Apr-24 | -10224197894 |
| May-24 | -10206319222 |
| Jun-24 | -9514456651 |
| Jul-24 | -9361882730 |
| Aug-24 | -9411216731 |
| Sep-24 | -9156845955 |
| Oct-24 | -9077975640 |
| Nov-24 | -8268808495 |
| Dec-24 | -7859991085 |
| Jan-25 | -7345176961 |
| Feb-25 | -6582617947 |
| Mar-25 | -6262629671 |
| Apr-25 | -5052790305 |
| May-25 | -4010605267 |
| Jun-25 | -4429432722 |
| Jul-25 | -4139473538 |
| Aug-25 | -3057990728 |
| Sep-25 | -2246488400 |
| Month | Exports | Imports |
| Sep-16 | 48583604241 | 51937571256 |
| Oct-16 | 48696300602 | 51943096182 |
| Nov-16 | 48493856234 | 51668426698 |
| Dec-16 | 48486904078 | 51621003860 |
| Jan-17 | 48527688853 | 51900651913 |
| Feb-17 | 48305011954 | 52087176794 |
| Mar-17 | 48694076739 | 52403502291 |
| Apr-17 | 49076148830 | 52588224533 |
| May-17 | 49424472301 | 53217606685 |
| Jun-17 | 49873491508 | 53530298793 |
| Jul-17 | 50528773127 | 53742125258 |
| Aug-17 | 50834401328 | 53982204190 |
| Sep-17 | 51160043929 | 54085069256 |
| Oct-17 | 51791672041 | 54758679676 |
| Nov-17 | 52532859588 | 55999083412 |
| Dec-17 | 53625488161 | 56475966255 |
| Jan-18 | 53965184420 | 57251540961 |
| Feb-18 | 54395355682 | 57451179208 |
| Mar-18 | 54602966051 | 58070988121 |
| Apr-18 | 54860205151 | 58675361932 |
| May-18 | 55304076433 | 58981965372 |
| Jun-18 | 55490192916 | 59696459421 |
| Jul-18 | 56206201587 | 60707605774 |
| Aug-18 | 56493336022 | 61387155623 |
| Sep-18 | 56954044261 | 62262575720 |
| Oct-18 | 57226558637 | 63000561771 |
| Nov-18 | 57470599037 | 63026157930 |
| Dec-18 | 57251104265 | 63411686834 |
| Jan-19 | 57320341207 | 63753428813 |
| Feb-19 | 57583937302 | 64298865591 |
| Mar-19 | 58386241764 | 64125379333 |
| Apr-19 | 58900924296 | 64478844074 |
| May-19 | 59293597157 | 64895877241 |
| Jun-19 | 59378412551 | 64365619809 |
| Jul-19 | 58963308257 | 64479740579 |
| Aug-19 | 59050318141 | 64641626564 |
| Sep-19 | 59153331446 | 64474655305 |
| Oct-19 | 59330562863 | 64385162182 |
| Nov-19 | 59689705163 | 64526824510 |
| Dec-19 | 59899236281 | 64365870256 |
| Jan-20 | 60232430772 | 64159773227 |
| Feb-20 | 60412604751 | 63695723762 |
| Mar-20 | 60424643728 | 64010136161 |
| Apr-20 | 60267881085 | 62840316737 |
| May-20 | 59860029862 | 61384690525 |
| Jun-20 | 59923371349 | 61361306157 |
| Jul-20 | 59958852127 | 60276689742 |
| Aug-20 | 60267415950 | 59264225752 |
| Sep-20 | 59811824505 | 58631031588 |
| Oct-20 | 59608519266 | 57855259262 |
| Nov-20 | 59310670094 | 56770237898 |
| Dec-20 | 59352090268 | 56961360766 |
| Jan-21 | 58791158732 | 56734559657 |
| Feb-21 | 58648923039 | 56693116261 |
| Mar-21 | 58509007529 | 57258564152 |
| Apr-21 | 58727983912 | 58293645327 |
| May-21 | 59187764622 | 59571192599 |
| Jun-21 | 60317064345 | 60674922671 |
| Jul-21 | 61137731227 | 62270509851 |
| Aug-21 | 61130377632 | 64075058253 |
| Sep-21 | 61626437404 | 65604817382 |
| Oct-21 | 62203301840 | 66998341316 |
| Nov-21 | 62957144846 | 68838625154 |
| Dec-21 | 63494172023 | 70595968348 |
| Jan-22 | 64179336420 | 71658111602 |
| Feb-22 | 64623309414 | 73266732763 |
| Mar-22 | 65620086364 | 74674442800 |
| Apr-22 | 66238532811 | 75381308679 |
| May-22 | 67249624549 | 76649073506 |
| Jun-22 | 67320451696 | 78294877224 |
| Jul-22 | 67880911372 | 79883370469 |
| Aug-22 | 68799762323 | 81303850249 |
| Sep-22 | 70313919973 | 83171645585 |
| Oct-22 | 70886872314 | 84777552543 |
| Nov-22 | 71544229919 | 86532935659 |
| Dec-22 | 71970611821 | 86619601613 |
| Jan-23 | 72476808672 | 88114292067 |
| Feb-23 | 72353029898 | 88122469766 |
| Mar-23 | 72141630258 | 88920071686 |
| Apr-23 | 72569483052 | 89596565966 |
| May-23 | 72717557731 | 89851287691 |
| Jun-23 | 72672011431 | 88787611454 |
| Jul-23 | 71711512987 | 87586069982 |
| Aug-23 | 71402878992 | 86909980206 |
| Sep-23 | 70258409955 | 85666678553 |
| Oct-23 | 69672337565 | 84497583105 |
| Nov-23 | 69280620301 | 83181050291 |
| Dec-23 | 68620962133 | 82243632920 |
| Jan-24 | 68136465013 | 80728068440 |
| Feb-24 | 68854669181 | 80918504125 |
| Mar-24 | 68969169693 | 78960631069 |
| Apr-24 | 68673149211 | 78897347105 |
| May-24 | 68719391678 | 78925710900 |
| Jun-24 | 68567972772 | 78082429423 |
| Jul-24 | 69269795361 | 78631678091 |
| Aug-24 | 69130797935 | 78542014666 |
| Sep-24 | 69260320778 | 78417166733 |
| Oct-24 | 69512025393 | 78590001033 |
| Nov-24 | 69976656237 | 78245464732 |
| Dec-24 | 70797191828 | 78657182913 |
| Jan-25 | 72028232122 | 79373409083 |
| Feb-25 | 72849974491 | 79432592438 |
| Mar-25 | 73879888401 | 80142518072 |
| Apr-25 | 75262870141 | 80315660446 |
| May-25 | 75780088365 | 79790693632 |
| Jun-25 | 76236161353 | 80665594075 |
| Jul-25 | 76696961664 | 80836435202 |
| Aug-25 | 77710079273 | 80768070001 |
| Sep-25 | 78637886271 | 80884374671 |
Text alternative for Goods exports and imports, September 2025 month compared with September 2024 month
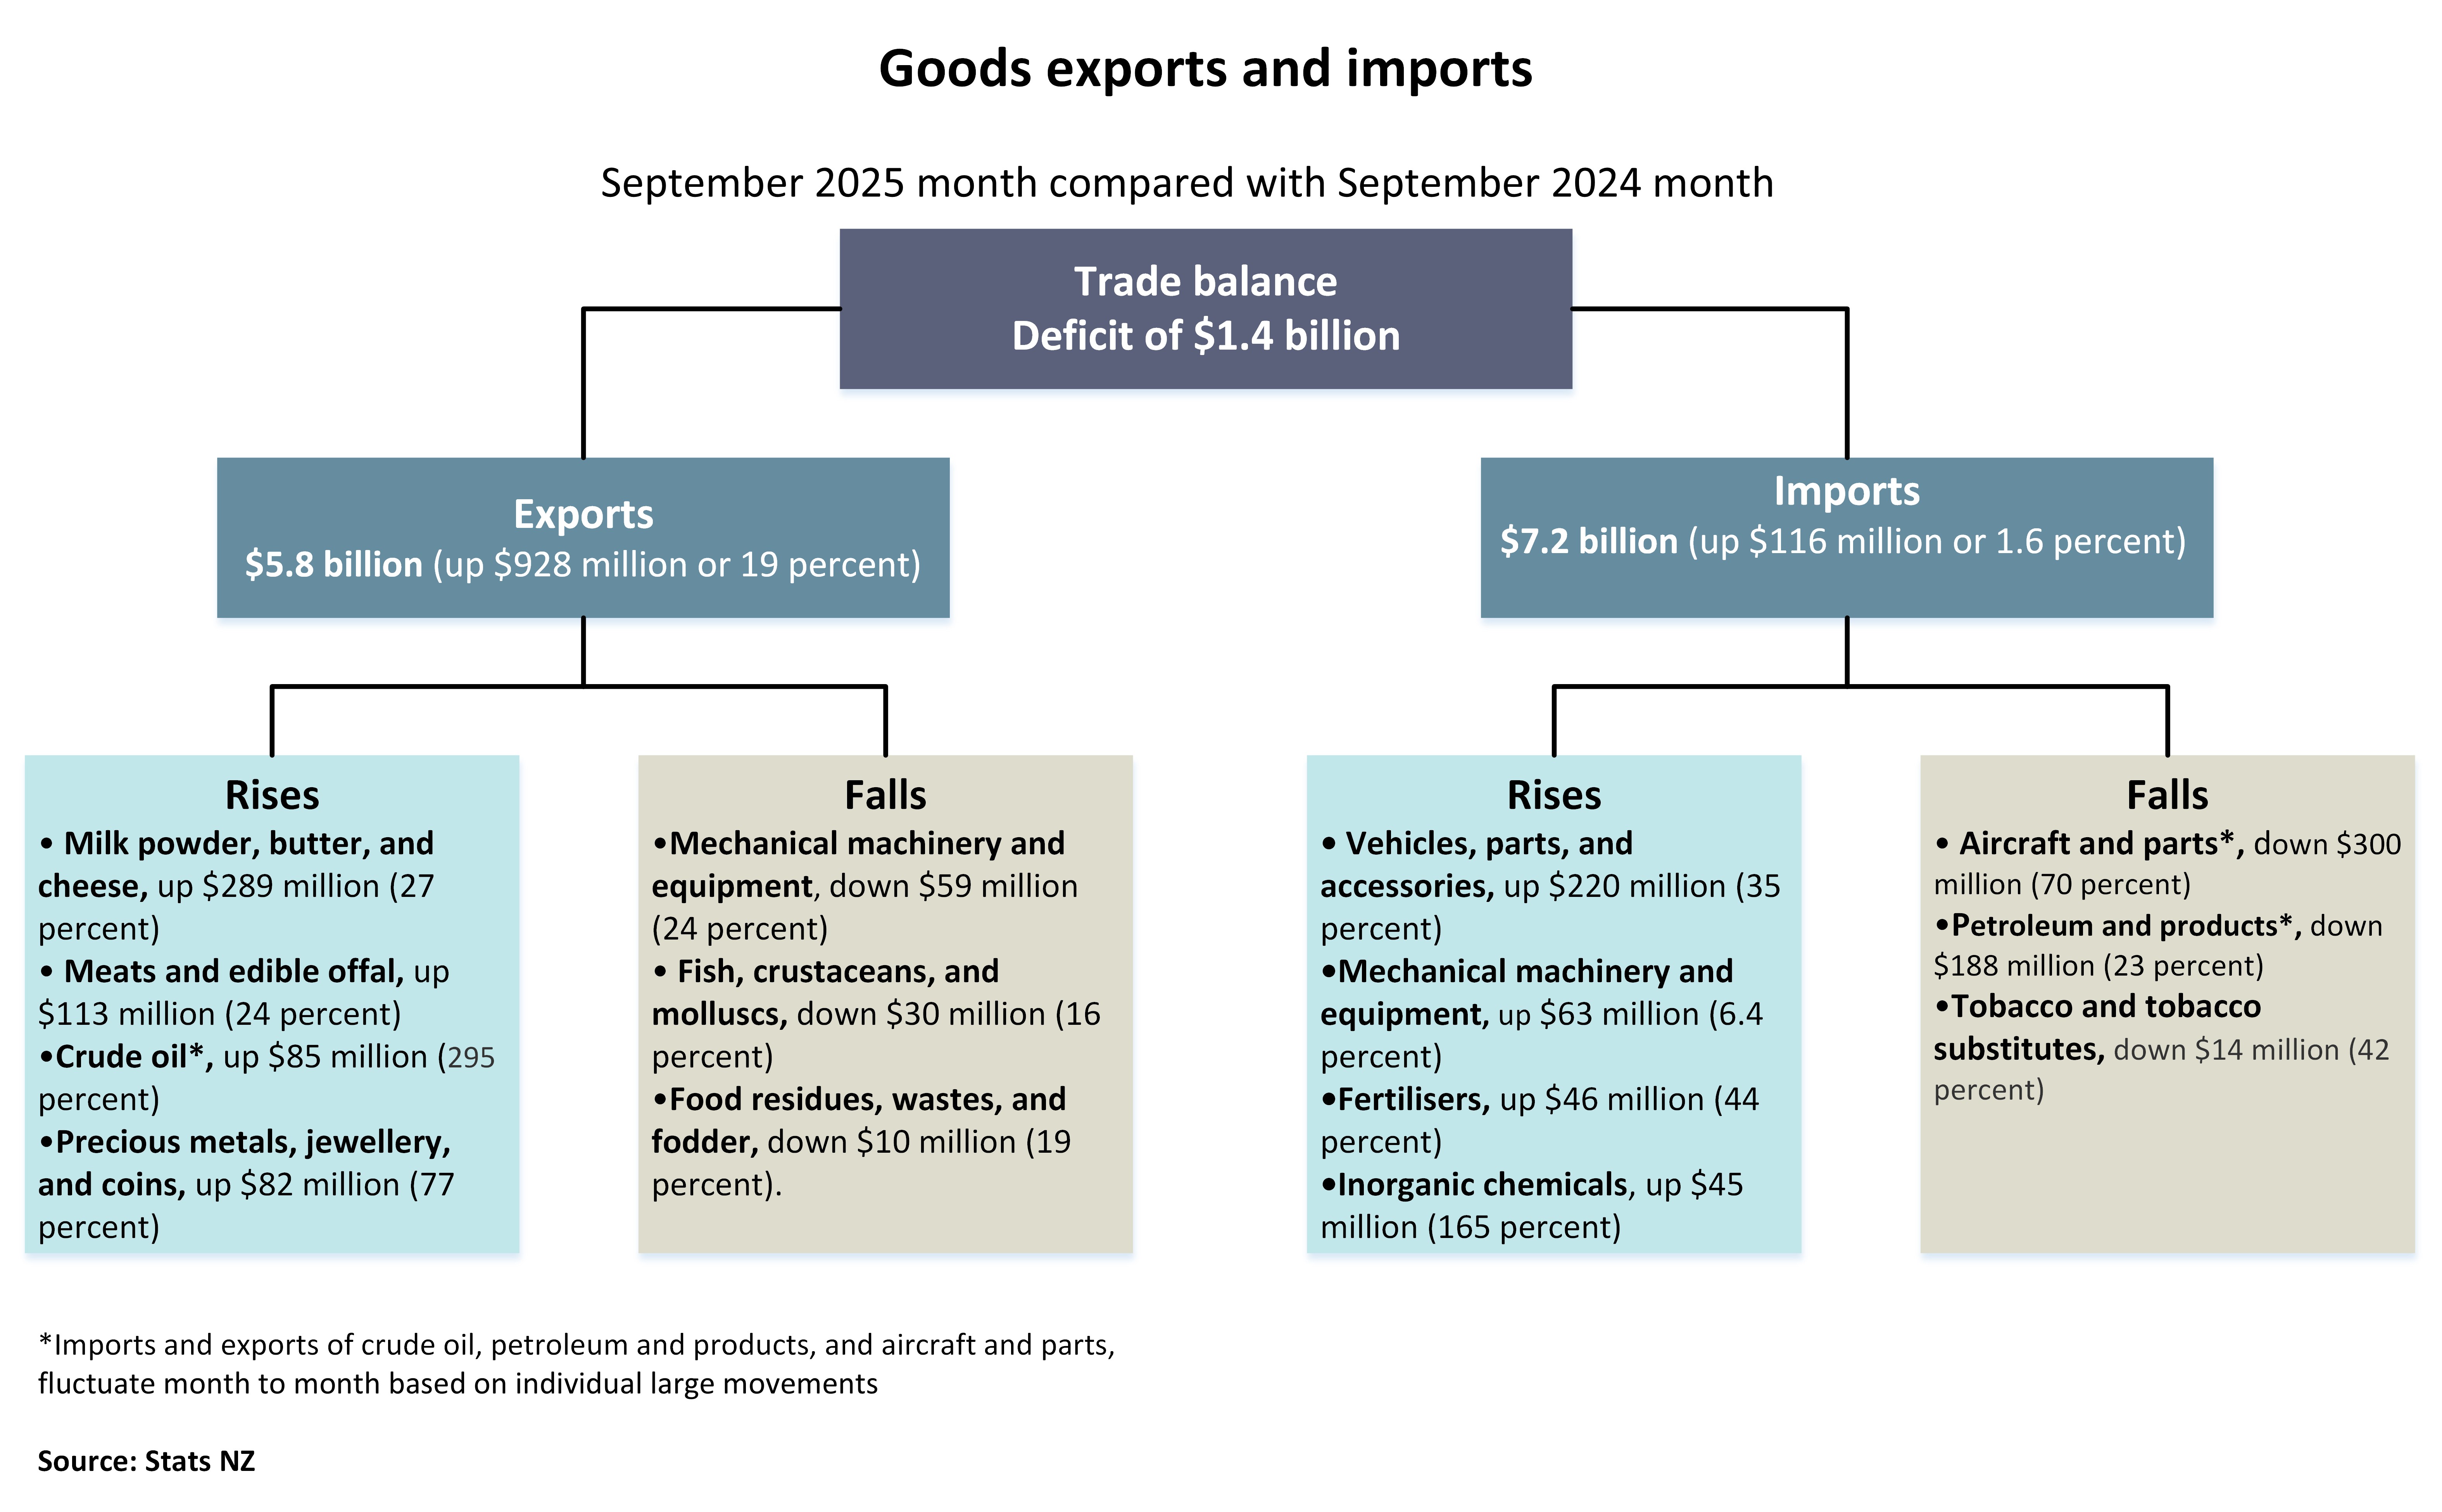
The diagram shows goods exports and imports for the September 2025 month compared with the September 2024 month.
The trade balance is a deficit of $1.4 billion. This is the difference between exports valued at $5.8 billion (up $928 million or 19 percent) and imports valued at $7.2 billion (up $116 million or 1.6 percent).
Export commodities that rose included: milk powder, butter, and cheese, up $289 million (27 percent); meat and edible offal, up $113 million (24 percent); crude oil* up $85 million (295 percent); and precious metals, jewellery, and coins, up $82 million (77 percent).
Export commodities that fell included: mechanical machinery and equipment, down $59 million (24 percent); fish, crustaceans, and molluscs, down $30 million (16 percent); and food residues, wastes, and fodder, down $10 million (19 percent).
Import commodities that rose included: vehicles, parts, and accessories, up $220 million (35 percent); mechanical machinery and equipment, up $63 million (6.4 percent); fertilisers, up $46 million (44 percent); and inorganic chemicals, up $45 million (165 percent).
Import commodities that fell included: aircraft and parts*, down $300 million (70 percent); petroleum and products*, down $188 million (23 percent); and tobacco and tobacco substitutes, down $14 million (42 percent).
* Imports and exports of crude oil, petroleum and products, and aircraft and parts, fluctuate month to month based on individual large movements.
Source: Stats NZ
More data
Use Infoshare to access time-series data for imports and exports (subject category: Imports and exports).
Overseas merchandise trade datasets has CSV data for goods imports and exports.
International trade: June 2025 quarter has information on trade in goods and services.
Definitions and metadata
Overseas merchandise trade - DataInfo+ provides the definitions of terms used in this release and general methodology used to produce overseas merchandise trade statistics.
Technical enquiries
Shannon Garrick
[email protected]
04 931 4600
ISSN 1178-0320
Next release
Overseas merchandise trade: October 2025 will be released on 21 November 2025.


