Population growth slowed in all of Aotearoa New Zealand's 16 regions in the year ended June 2025, according to provisional estimates released by Stats NZ today.
"Lower net migration gains in the June 2025 year led to slower population growth across all regions," population estimates, projections, and coverage spokesperson Victoria Treliving said.
New Zealand's resident population grew 0.7 percent in the year ending June 2025, to 5.3 million people. This growth was slower than in the previous two June years (2.3 percent in 2023 and 1.7 percent in 2024).
For the first time since 2013 - excluding the COVID-19 pandemic years of 2021 and 2022 - natural increase (births minus deaths) made a larger contribution to population growth than net migration (arrivals minus departures).
Canterbury's population growing the fastest
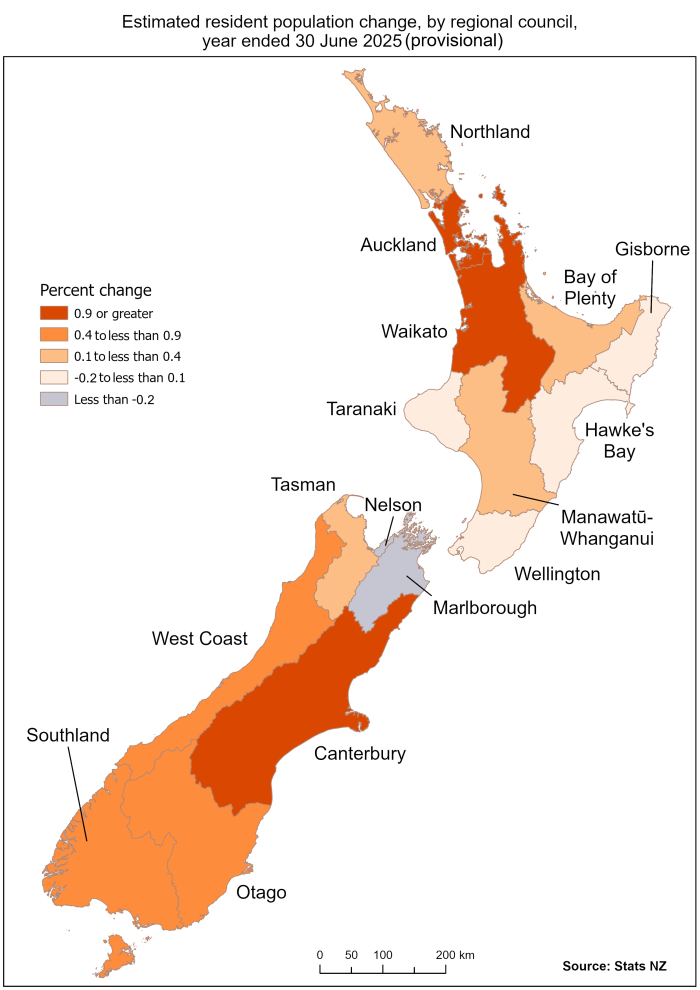
Canterbury was the fastest growing region in the June 2025 year (1.1 percent), followed by Auckland and Waikato (each 1.0 percent). These three regions were also the fastest in the June 2024 year when they grew 2.1, 2.5, and 2.0 percent, respectively.
Nelson and Marlborough provisionally decreased in population by 0.3 percent in the June 2025 year, while Gisborne and Hawke's Bay populations also dropped slightly (by 0.1 percent). Wellington and Taranaki regions had almost no change in the total population over the June 2025 year. By comparison, there were no regions with population decreases in the June 2024 year.
Seven regions have more people move out than in
All regions had lower net migration gains in the June 2025 year than in the previous year, with seven having net migration losses. By comparison, there were no regions with a net migration loss in the June 2024 year.
"The six slowest growing regions all experienced net migration losses in the last year," Treliving said.
"Net migration is the difference between migrant arrivals and migrant departures. It includes both internal migration, where people move within New Zealand, and international migration, where people move to or from New Zealand."
The Wellington region provisionally had the largest net migration loss (1,700), with this driven by moves overseas rather than to other parts of New Zealand. Other regions with net migration losses included Hawke's Bay (470), Taranaki (220), Bay of Plenty (210), Gisborne (170), Marlborough (120), and Nelson (110).
Auckland population passes 1.8 million
Auckland's population surpassed 1.8 million, growing by 17,700 in the year ending 30 June 2025 to reach 1,816,000. Across the regions, Auckland had the largest net migration gain (6,300) in the June 2025 year. This gain was much lower than in the June 2024 year (32,000).
Auckland had a net internal migration loss of 3,200 in the June 2025 year, but this was offset by an international migration gain of 9,500. Natural increase (11,400) also contributed to Auckland's population growth.
Text alternative for map Estimated resident population change, by regional council, year ended 30 June 2025 (provisional)
The map shows the regional council areas, each assigned a colour to show the range of change in the provisional estimated resident population in the year ended 30 June 2025. The colours are grouped into annual percent change from July 2024 to June 2025 of: less than negative 0.2 percent; negative 0.2 percent to less than 0.1 percent; 0.1 percent to less than 0.4 percent; 0.4 percent to less than 0.9 percent; and 0.9 percent or greater. The annual change ranged from a 1.1 percent increase in the Canterbury region to a 0.3 percent decrease in the Nelson region.


