Goods-producing industries made up about one-fifth of the New Zealand economy in 2019, second to service industries, which made up about two-thirds, Stats NZ said today.
This composition shifted from the 1970s, when goods-producing industries made up about a third of the economy while services made up about half.
Stats NZ's online tool Which industries contributed to New Zealand's GDP? shows the changing structure of the economy and contributions to gross domestic product (GDP) from 1972 to 2019. The tool measures GDP in current prices (also known as nominal GDP), that is, they are not adjusted for the effect of changing prices over time (inflation), unlike real GDP. Real GDP is measured in volume terms where prices are held constant.
"By using the online visual tool, you can see which industries contributed the most to GDP in a given year," national accounts senior manager Paul Pascoe said.
The tool was updated this year to let you drill down from a broad industry to a detailed industry level and to let you compare nominal GDP of one industry against another over a period of time.
"For example, of the goods-producing industries, construction contributed $20 billion to GDP in 2019 compared with $11 billion from the food, beverage, and tobacco product manufacturing industry."
Figure 1
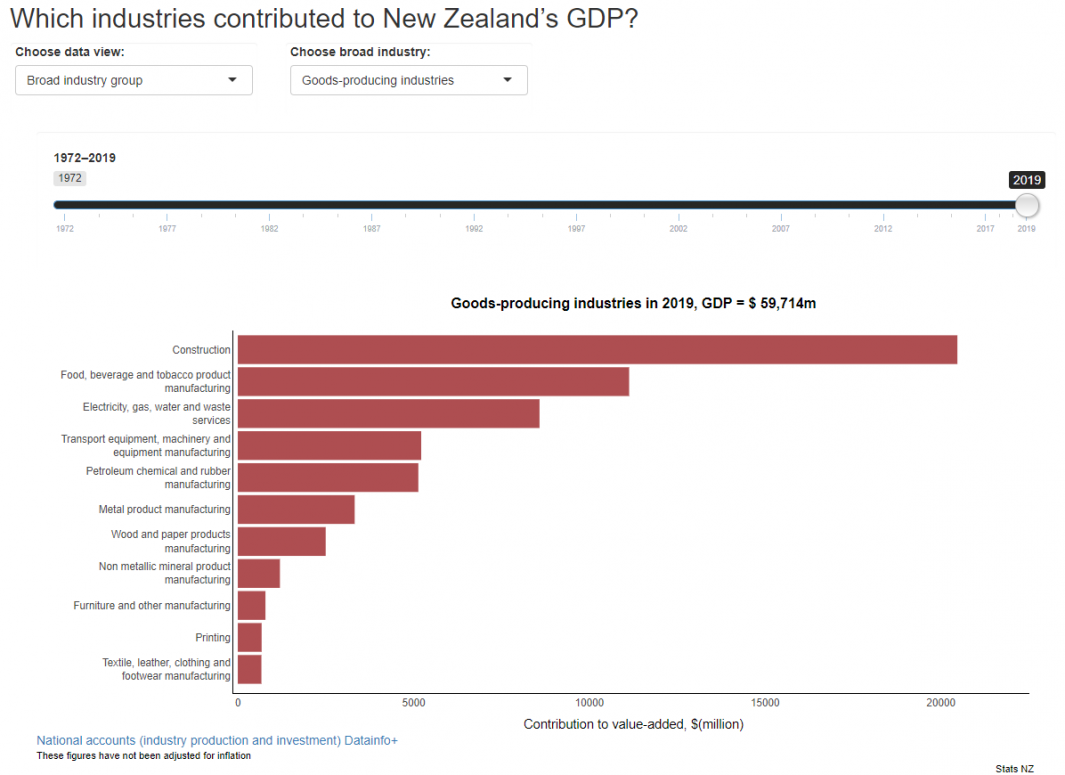
Text alternative for figure 1, Goods-producing industries in 2019.
Construction's share of the economy was more than 80 percent bigger than food and drink manufacturing in 2019.
In contrast, in the 1970s, the contribution to GDP of the food and drink manufacturing industry was the biggest of the goods-producing industries, closely followed by construction.
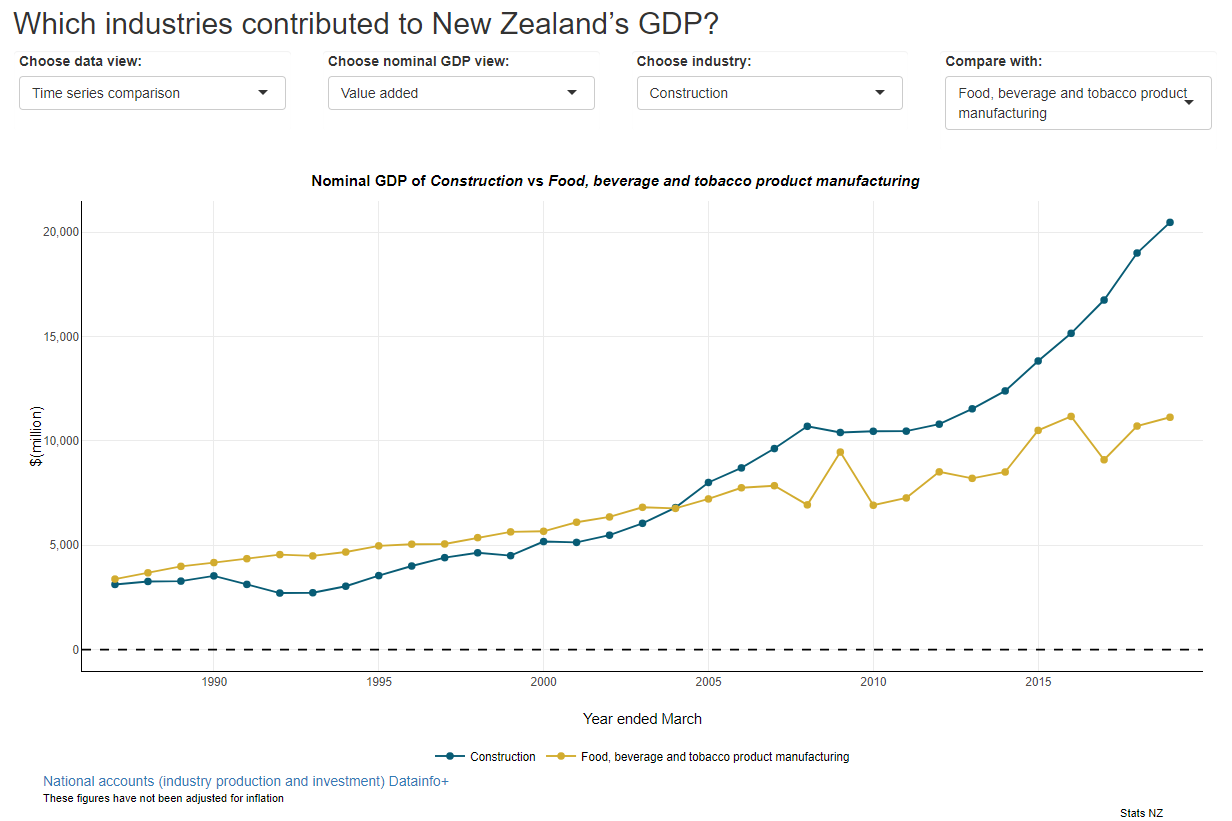
"Using the time-series comparison, you can see that construction's nominal GDP overtook food and beverage manufacturing in 2004," Mr Pascoe said.
Figure 2
To see other industries, view the tool Which industries contributed to New Zealand's GDP?
Data is sourced from the National accounts (industry production and investment): Year ended March 2019.
Text alternative for figure 1, Goods-producing industries in 2019
Image is of a horizontal bar graph from the tool Which industries contributed to New Zealand's GDP? The graph shows a list of goods-producing industries that contributed most to the production measure of GDP in 2019 in descending order. The x-axis gives contribution to value added in million dollars. The y-axis lists all goods producing industries in descending order: construction - 20,475; food, beverage, and tobacco product manufacturing - 11,135; electricity, gas, water, and waste services - 8,585; transport equipment, machinery and equipment manufacturing - 5,219; petroleum chemical and rubber manufacturing - 5,137; metal product manufacturing - 3,326; wood and paper product manufacturing - 2,501; non-metallic mineral product manufacturing - 1,199; furniture and other manufacturing - 787; printing - 678; textile, leather, clothing, and footwear manufacturing - 672.
Text alternative for figure 2, nominal GDP of construction versus food, beverage and tobacco product manufacturing
Image is of time-series plots from the tool Which industries contributed to New Zealand's GDP? The plots show the nominal GDP for construction compared with food, beverage, and tobacco product manufacturing. The x-axis shows the time period for the year ended March from 1987 to 2019. The y-axis shows the contribution to value added in million dollars: 1987: construction - 3,124; food, beverage, and tobacco product manufacturing - 3,381; 2004: construction - 6,806; food, beverage, and tobacco product manufacturing - 6,768; 2019: construction, 20,475; food, beverage, and tobacco product manufacturing - 11,135.


