Of New Zealand's 16 regions, 12 experienced lower population growth in the June 2022 year than in 2021, Stats NZ said today.
"While two-thirds of regions experienced population growth in the past year, for most regions this growth was lower than in 2021," population estimates and projections acting manager Rebekah Hennessey said.
"Population decline also occurred in five regions - Auckland, Wellington, Nelson, West Coast, and Southland."
| Region | Percentage change 2021 | Percentage change 2022 |
| Northland | 2.2 | 1.3 |
| Bay of Plenty | 1.4 | 1.1 |
| Tasman | 1.3 | 1.1 |
| Waikato | 1.7 | 1 |
| Taranaki | 1 | 0.7 |
| Canterbury | 1 | 0.7 |
| Gisborne | 0.8 | 0.6 |
| Manawatū-Whanganui | 0.9 | 0.6 |
| Marlborough | 0.5 | 0.6 |
| Otago | -0.1 | 0.6 |
| Hawke's Bay | 1 | 0.5 |
| NEW ZEALAND | 0.4 | 0.2 |
| Wellington | 0.3 | 0 |
| Southland | -0.3 | -0.1 |
| Nelson | -0.4 | -0.4 |
| Auckland | -0.6 | -0.5 |
| West Coast | 0.3 | -0.5 |
Components of population change
Nationally, annual population growth has slowed over the last two years, dropping from 2.2 percent in the June 2020 year, to 0.4 percent in the June 2021 year, and to 0.2 percent in the June 2022 year, the lowest since the late 1980s.
"Slowing regional growth reflects what is happening nationally, particularly annual net migration loss, partly due to the impact of COVID-19 on international migration," Hennessey said.
"This net migration loss was combined with the lowest natural increase since World War II."
Population change is the result of natural increase (births minus deaths) and net migration (migrant arrivals minus migrant departures). For subnational areas, migration comprises both external (international) migration and internal migration (people moving between areas within New Zealand).
Internal migration was the main driver of population change in 12 of the 16 regions, while natural increase was the main driver in the other four. No regions had international migration as the main driver of population change in the June 2022 year.
Two regions - West Coast and Marlborough - experienced natural decrease (more deaths than births) in the June 2022 year. These regions have more older people, with 23 percent of their population aged 65 years and over. New Zealand overall had 16 percent of its population aged 65 years and over at 30 June 2022.
| Area | Natural increase | Net internal migration | Net international migration |
| Northland | 490 | 2300 | -230 |
| Auckland | 12000 | -15000 | -5900 |
| Waikato | 2800 | 3400 | -860 |
| Bay of Plenty | 1400 | 2600 | -290 |
| Gisborne | 350 | -60 | 10 |
| Hawke's Bay | 640 | 510 | -200 |
| Taranaki | 390 | 410 | 30 |
| Manawatū-Whanganui | 790 | 650 | 0 |
| Wellington | 2100 | -550 | -1800 |
| Tasman | 60 | 690 | -140 |
| Nelson | 30 | -130 | -120 |
| Marlborough | -10 | 220 | 80 |
| West Coast | -40 | -140 | 10 |
| Canterbury | 2300 | 3600 | -1200 |
| Otago | 550 | 1900 | -950 |
| Southland | 240 | -400 | 60 |
| NEW ZEALAND | 24100 | 0 | -11500 |
Auckland's population falls further
Auckland's population continued to decline in the June 2022 year, after falling for the first time in June 2021 . In the June 2022 year, Auckland's population declined by 0.5 percent, slightly less than the decline in 2021 of 0.6 percent.
"While people leaving the bigger cities such as Auckland is not new, internal migration losses have historically been offset by international migration gains," Hennessey said.
"With international migration losses now occurring, Auckland had an overall population loss of 8,900 people in the June 2022 year."
Auckland had a provisional net loss of 15,000 people through internal migration (people moving between Auckland and other parts of New Zealand). This comes after net losses of 11,300 and 15,400 people in the previous two years. It continues a trend of net flows out of Auckland that began in the late 1990s.
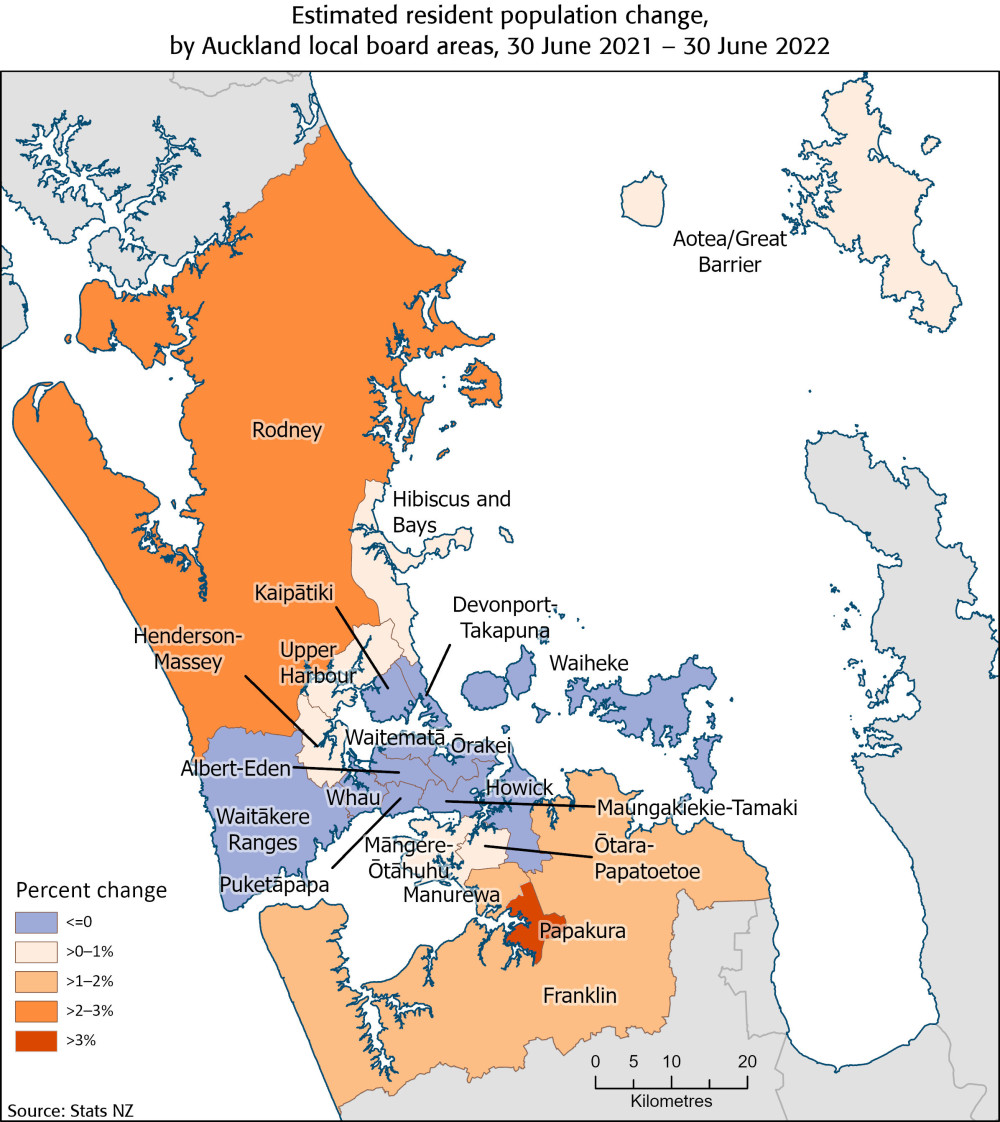
Within Auckland, the highest population growth rates continued to occur in local board areas at the edges of the region, such as Papakura (up 3.9 percent) and Rodney (up 2.7 percent). In contrast, central local board areas experienced declining populations, particularly Waitematā (down 5.8 percent) and Albert-Eden (down 3.1 percent).
The population in districts adjacent to Auckland also experienced significant population growth. Kaipara and Waikato districts both increased by 2.5 percent, and Hauraki district increased by 1.3 percent, in the June 2022 year.
All estimates for 2021 and 2022 are provisional and subject to revision. Further information on regional council, territorial authority, and Auckland local board area populations can be found in Subnational population estimates: At 30 June 2022 (provisional).
Text alternative for map Estimated resident population change, by Auckland local board areas, 30 June 2021-30 June 2022
The map shows the Auckland local board areas, each assigned a colour to show the range of change in estimated resident population in the year ended 30 June 2022. The colours are grouped into annual percent change 2021-2022 of: less than zero; greater than zero to 1 percent; greater than 1 to 2 percent; greater than 2 to 3 percent; greater than 3 percent. The annual change ranged from 3.9 percent growth in Papakura local board area to 5.8 percent decline in Waitematā local board area. Data is available from Subnational population estimates (TA, SA2), by age and sex, at 30 June 1996-2021 (2021 boundaries).