Research and development (R&D) statistics report on research and development activity, including expenditure and related employment across the business, government, and higher education sectors in New Zealand.
Every two years, including 2024, all three sectors are surveyed. In 2019, 2021, and 2023, the survey was conducted for the business sector only.
R&D expenditure figures are in nominal terms and are not adjusted for inflation.
This release focuses on data from 2024, with comparisons back to 2018. The survey design has remained comparable over this time. Previous data, gathered under old survey designs, date back to 2006 and is available in Infoshare.
Key facts
Between 2022 and 2024, for all three sectors:
- total R&D expenditure reached $6.4 billion, up 21 percent
- the number of entities that reported R&D activity fell 2 percent to 2,337
- average R&D expenditure per entity that performed R&D activity increased $524,000 (24 percent) to $2.8 million
- R&D expenditure as a proportion of gross domestic product (GDP expenditure measure) rose from 1.49 percent to 1.54 percent
- the number of full-time equivalent (FTE) staff who worked on R&D rose 9 percent to 42,000.
Between 2023 and 2024, for the business sector:
- R&D expenditure reached $4.0 billion, up 9 percent
- the number of businesses that reported R&D activity remained similar, at 2,283
- average R&D expenditure per business that performed R&D activity increased $143,000 (8.8 percent) to $1.8 million
- R&D expenditure as a proportion of gross domestic product (GDP expenditure measure) increased from 0.95 percent to 0.97 percent
- the number of FTE staff who worked on R&D remained at 21,000
- 39 percent of businesses surveyed expected the amount of R&D they would undertake in the next financial year would stay the same
- the main reasons businesses performed R&D were to 'gain entry into new markets' and to 'maintain position in market' (both at 30 percent).
Overall R&D expenditure reaches $6.4 billion
In 2024, total R&D expenditure reached $6.4 billion. This was up 21 percent from 2022, when R&D data was last collected for all sectors (business, government, and higher education).
| Year | All sectors R&D expenditure |
| 2018 | 3922000000 |
| 2019 | |
| 2020 | 4734000000 |
| 2021 | |
| 2022 | 5336000000 |
| 2023 | |
| 2024 | 6435000000 |
| 3658000000 | 4186000000 |
|---|---|
| 4568000000 | 4900000000 |
| 5158000000 | 5515000000 |
| 6165000000 | 6704000000 |
Wages and salaries made up 53 percent of R&D expenditure in 2024, while other current expenditure contributed 36 percent, and capital expenditure contributed 11 percent. These proportions have been relatively stable since 2018.
Although R&D expenditure is not adjusted for inflation, movements in relevant price indexes suggest that the volume of R&D activity increased between the March 2022 quarter and the March 2024 quarter. Compared with a 21 percent change in R&D expenditure, relevant inflation movements were:
- labour cost index (all salary and wage rates for all sectors): 8.7 percent increase
- producers price index (inputs): 7.2 percent increase
- capital goods price index: 12.7 percent increase.
Price indexes has more information on inflation.
The business sector was the largest contributor to total R&D expenditure, accounting for 63 percent ($4.0 billion) in 2024. The rest was covered by higher education (universities) and government sectors (includes crown research institutes), contributing 21 and 16 percent to overall R&D expenditure, respectively.
| Sector | Higher education | Government | Business |
| 2018 | 960000000 | 828000000 | 2134000000 |
| 2019 | 2427000000 | ||
| 2020 | 1202000000 | 802000000 | 2731000000 |
| 2021 | 2867000000 | ||
| 2022 | 1254000000 | 900000000 | 3182000000 |
| 2023 | 3721000000 | ||
| 2024 | 1349000000 | 1038000000 | 4047000000 |
Large entities (100 or more employees) contributed almost three-quarters of the total R&D expenditure but only accounted for 16 percent of entities carrying out R&D.
Business R&D expenditure reaches $4.0 billion
The business sector spent $4.0 billion on internal R&D expenditure in 2024. This was 9 percent higher than in 2023.
In 2024 for the business sector:
- 2,283 businesses carried out R&D
- the main reasons businesses performed R&D were to 'gain entry into new markets' and to 'maintain position in market' (both at 30 percent)
- 21,000 FTE staff worked on R&D activities in the business sector
- over three-quarters (77 percent) of business sector R&D was funded by the business sector, while 16 percent came from overseas sources.
Businesses in the services industries contributed 66 percent of total business R&D expenditure in 2024, or $2.7 billion. Services businesses make up a large proportion of the total New Zealand economy and account for a wide range of industries, such as construction, wholesale trade, health care, and information and communication technology (ICT).
The scientific research and technical services industry saw the biggest increase in R&D expenditure from 2023; up $82 million (21%) to $465 million.
R&D for the purpose of health continues to grow significantly
When entities carry out R&D, it could be for their own benefit, or for that of other businesses, industries, or sectors.
For example, the manufacturing industry performed $1,156 million worth of R&D in 2024. Of this expenditure, respondents reported that 61 percent was intended to benefit industries other than manufacturing, such as primary industries (12 percent).
In recent years, the largest proportion of total R&D expenditure has been for the purpose of the manufacturing industry. However, since 2018 (the earliest comparable year of the R&D survey) R&D expenditure for the purpose of health has grown significantly (86 percent), to $972 million in 2024. In 2024, it was the highest-spending purpose group, with manufacturing being the second highest ($862 million).
| Purpose/sector that benefits | 2018 | 2024 |
| Health | 524000000 | 972000000 |
| Manufacturing | 671000000 | 862000000 |
| Information and communication services | 429000000 | 859000000 |
| Environment | 373000000 | 563000000 |
| Animal production and animal primary products | 326000000 | 490000000 |
| Plant production and plant primary products | 328000000 | 414000000 |
| Other | 226000000 | 393000000 |
| Commercial services and tourism | 240000000 | 374000000 |
| Energy | 108000000 | 311000000 |
| Transport | 135000000 | 242000000 |
| Construction | 90000000 | 241000000 |
| Economic framework | 58000000 | 145000000 |
| Education and training | 126000000 | 137000000 |
| "Law | 53000000 | 131000000 |
| politics | 119000000 | 119000000 |
| and community services" | 40000000 | 50000000 |
| Cultural understanding | ||
| Mineral resources |
R&D for the purpose of health also saw the biggest dollar value increase between 2022 and 2024 ($261 million).
39 percent of businesses expect their level of R&D to stay the same over the next year
Businesses were asked what they expect to happen to the amount of R&D they carry out or fund in their next financial year.
When we asked businesses about future R&D expenditure:
- 39 percent expected it to stay the same
- 37 percent expected an increase
- 15 percent expected a decrease.
These proportions have remained similar since 2018.
Data updates
We made updates and corrections to 2022 and 2023 results as part of the 2024 release, due to updated respondent data across the majority of the business sector figures.
All updates and corrections are noted with a revision flag on the affected series in the published tables, CSV files, and relevant Infoshare series.
Consistency of rounding
The Infoshare data for 2022 and 2023 has been updated to ensure consistent rounding across different release products.
Future releases will also have consistent rounding across different products.
Research and Development Survey - Survey series - DataInfo+ has information on how rounding is applied to the R&D survey.
Information about the survey
The Stats NZ Research and Development Survey runs every two years and surveys the business, government, and higher education sectors. The 2019, 2021, and 2023 R&D surveys were conducted for the business sector only.
The 2024 survey was conducted from August to December 2024, and entities were asked to report on the last financial year for which information was available, as at August 2024. The majority of responders reported for the period 1 April 2023 to 31 March 2024.
A sample of 5,221 entities was selected from known R&D performers.
The R&D expenditure and personnel figures stated in this release refer only to internal R&D carried out within an organisation or business. External R&D expenditure is collected in the survey and is available in the downloadable CSV under Download data.
Relative sampling errors
Relative sampling errors (RSEs) are not only published for headline figures, but for all the figures collected in the survey. They are available in the RSEs Excel file or the downloadable CSV under Download data.
Research and Development Survey - Survey series - DataInfo+ has more information on relative sampling errors.
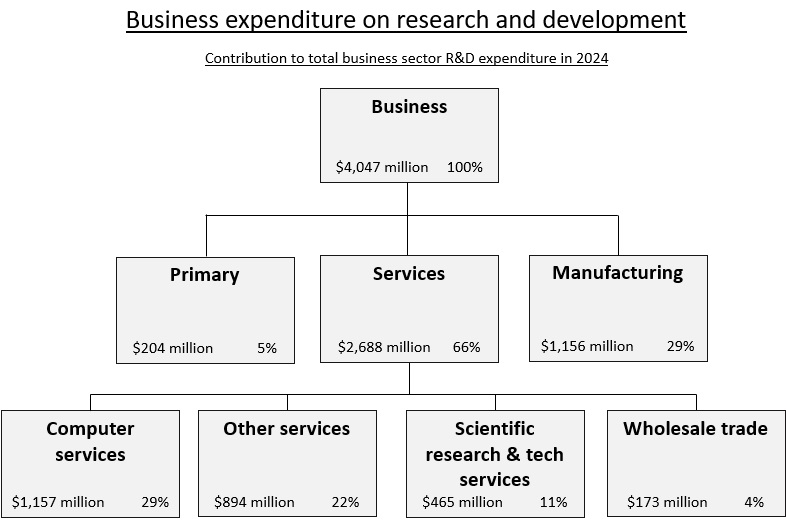
Text alternative for Business expenditure on research and development, contribution to total business sector R&D expenditure in 2024
Diagram shows sector contribution to total expenditure on research and development in 2024. Total business sector R&D expenditure: $4,047 million, 100 percent. Primary industry group: $204 million, 5 percent. Services industry group: $2,688 million, 66 percent. Manufacturing industry group: $1,156 million, 29 percent. Computer services: $1,157 million, 29 percent. Other services: $894 million, 22 percent. Scientific research and technical services: $465 million, 11 percent. Wholesale trade: $173 million, 4 percent.
More data
Use Infoshare to access the research and development survey time series.
Subject category: Industry sectors
Group: Research and Development survey - RAD
Definitions and metadata
Research and Development Survey - Survey series - DataInfo+ details the general methodology used to produce research and development statistics.
Research and Development Survey - Concepts - DataInfo+ details the definitions used to produce research and development statistics.
Research and Development Survey - 2024 data collection - DataInfo+ details the methodology used for this release.
Technical enquiries
Kathy Jackson
04 931 4600
[email protected]
ISSN 1178-0657
Next release
Research and development survey: 2025 will be released in 2026.


