The seasonally adjusted unemployment rate fell to 3.9 percent in the June 2019 quarter, down from 4.2 percent in the March 2019 quarter, Stats NZ said today.
This is the lowest unemployment rate since the June 2008 quarter, when it was 3.8 percent.
The fall in the unemployment rate in the latest quarter reflected a fall in the number of unemployed people (down 7,000), bringing the total number of unemployed to 109,000. This fall was driven by 4,000 fewer unemployed men.
"Labour market data is most useful when placed in the context of a time series. Since late 2012, the seasonally adjusted unemployment rate has largely been tracking down, towards levels seen before the global financial crisis in 2008," labour market and household statistics senior manager Sean Broughton said.
| Quarter | Seasonally adjusted | Trend series |
| Jun-05 | 3.8 | 3.9 |
| Sep-05 | 3.8 | 3.8 |
| Dec-05 | 3.7 | 3.8 |
| Mar-06 | 4.1 | 3.8 |
| Jun-06 | 3.7 | 3.8 |
| Sep-06 | 3.9 | 3.8 |
| Dec-06 | 3.8 | 3.8 |
| Mar-07 | 3.9 | 3.8 |
| Jun-07 | 3.6 | 3.7 |
| Sep-07 | 3.5 | 3.5 |
| Dec-07 | 3.3 | 3.5 |
| Mar-08 | 3.8 | 3.7 |
| Jun-08 | 3.8 | 3.8 |
| Sep-08 | 4 | 4 |
| Dec-08 | 4.4 | 4.4 |
| Mar-09 | 5 | 5 |
| Jun-09 | 5.7 | 5.7 |
| Sep-09 | 6.1 | 6.2 |
| Dec-09 | 6.5 | 6.4 |
| Mar-10 | 5.9 | 6.3 |
| Jun-10 | 6.5 | 6.1 |
| Sep-10 | 6 | 6.1 |
| Dec-10 | 6.2 | 6.1 |
| Mar-11 | 6 | 6 |
| Jun-11 | 6 | 6 |
| Sep-11 | 5.9 | 5.9 |
| Dec-11 | 6 | 6 |
| Mar-12 | 6.3 | 6.2 |
| Jun-12 | 6.3 | 6.4 |
| Sep-12 | 6.7 | 6.5 |
| Dec-12 | 6.2 | 6.2 |
| Mar-13 | 5.7 | 5.9 |
| Jun-13 | 5.9 | 5.8 |
| Sep-13 | 5.8 | 5.8 |
| Dec-13 | 5.6 | 5.7 |
| Mar-14 | 5.6 | 5.5 |
| Jun-14 | 5.2 | 5.3 |
| Sep-14 | 5.3 | 5.3 |
| Dec-14 | 5.5 | 5.4 |
| Mar-15 | 5.5 | 5.5 |
| Jun-15 | 5.4 | 5.5 |
| Sep-15 | 5.6 | 5.4 |
| Dec-15 | 4.9 | 5.2 |
| Mar-16 | 5.2 | 5.1 |
| Jun-16 | 5 | 5 |
| Sep-16 | 5 | 5 |
| Dec-16 | 5.2 | 5.1 |
| Mar-17 | 4.9 | 5 |
| Jun-17 | 4.7 | 4.9 |
| Sep-17 | 4.7 | 4.7 |
| Dec-17 | 4.5 | 4.5 |
| Mar-18 | 4.4 | 4.4 |
| Jun-18 | 4.4 | 4.3 |
| Sep-18 | 4 | 4.2 |
| Dec-18 | 4.3 | 4.2 |
| Mar-19 | 4.2 | 4.2 |
| Jun-19 | 3.9 | 3.9 |
Māori unemployment falls
The Māori unemployment rate was 7.7 percent in the June 2019 quarter, down from 9.4 percent last year. This reflects a decrease in the number of unemployed Māori (down 6,400). At the same time, the number of Māori who were not in the labour force (NILF) increased (up 14,600).
This is the lowest Māori unemployment rate since the June 2008 quarter, when it was 7.2 percent.
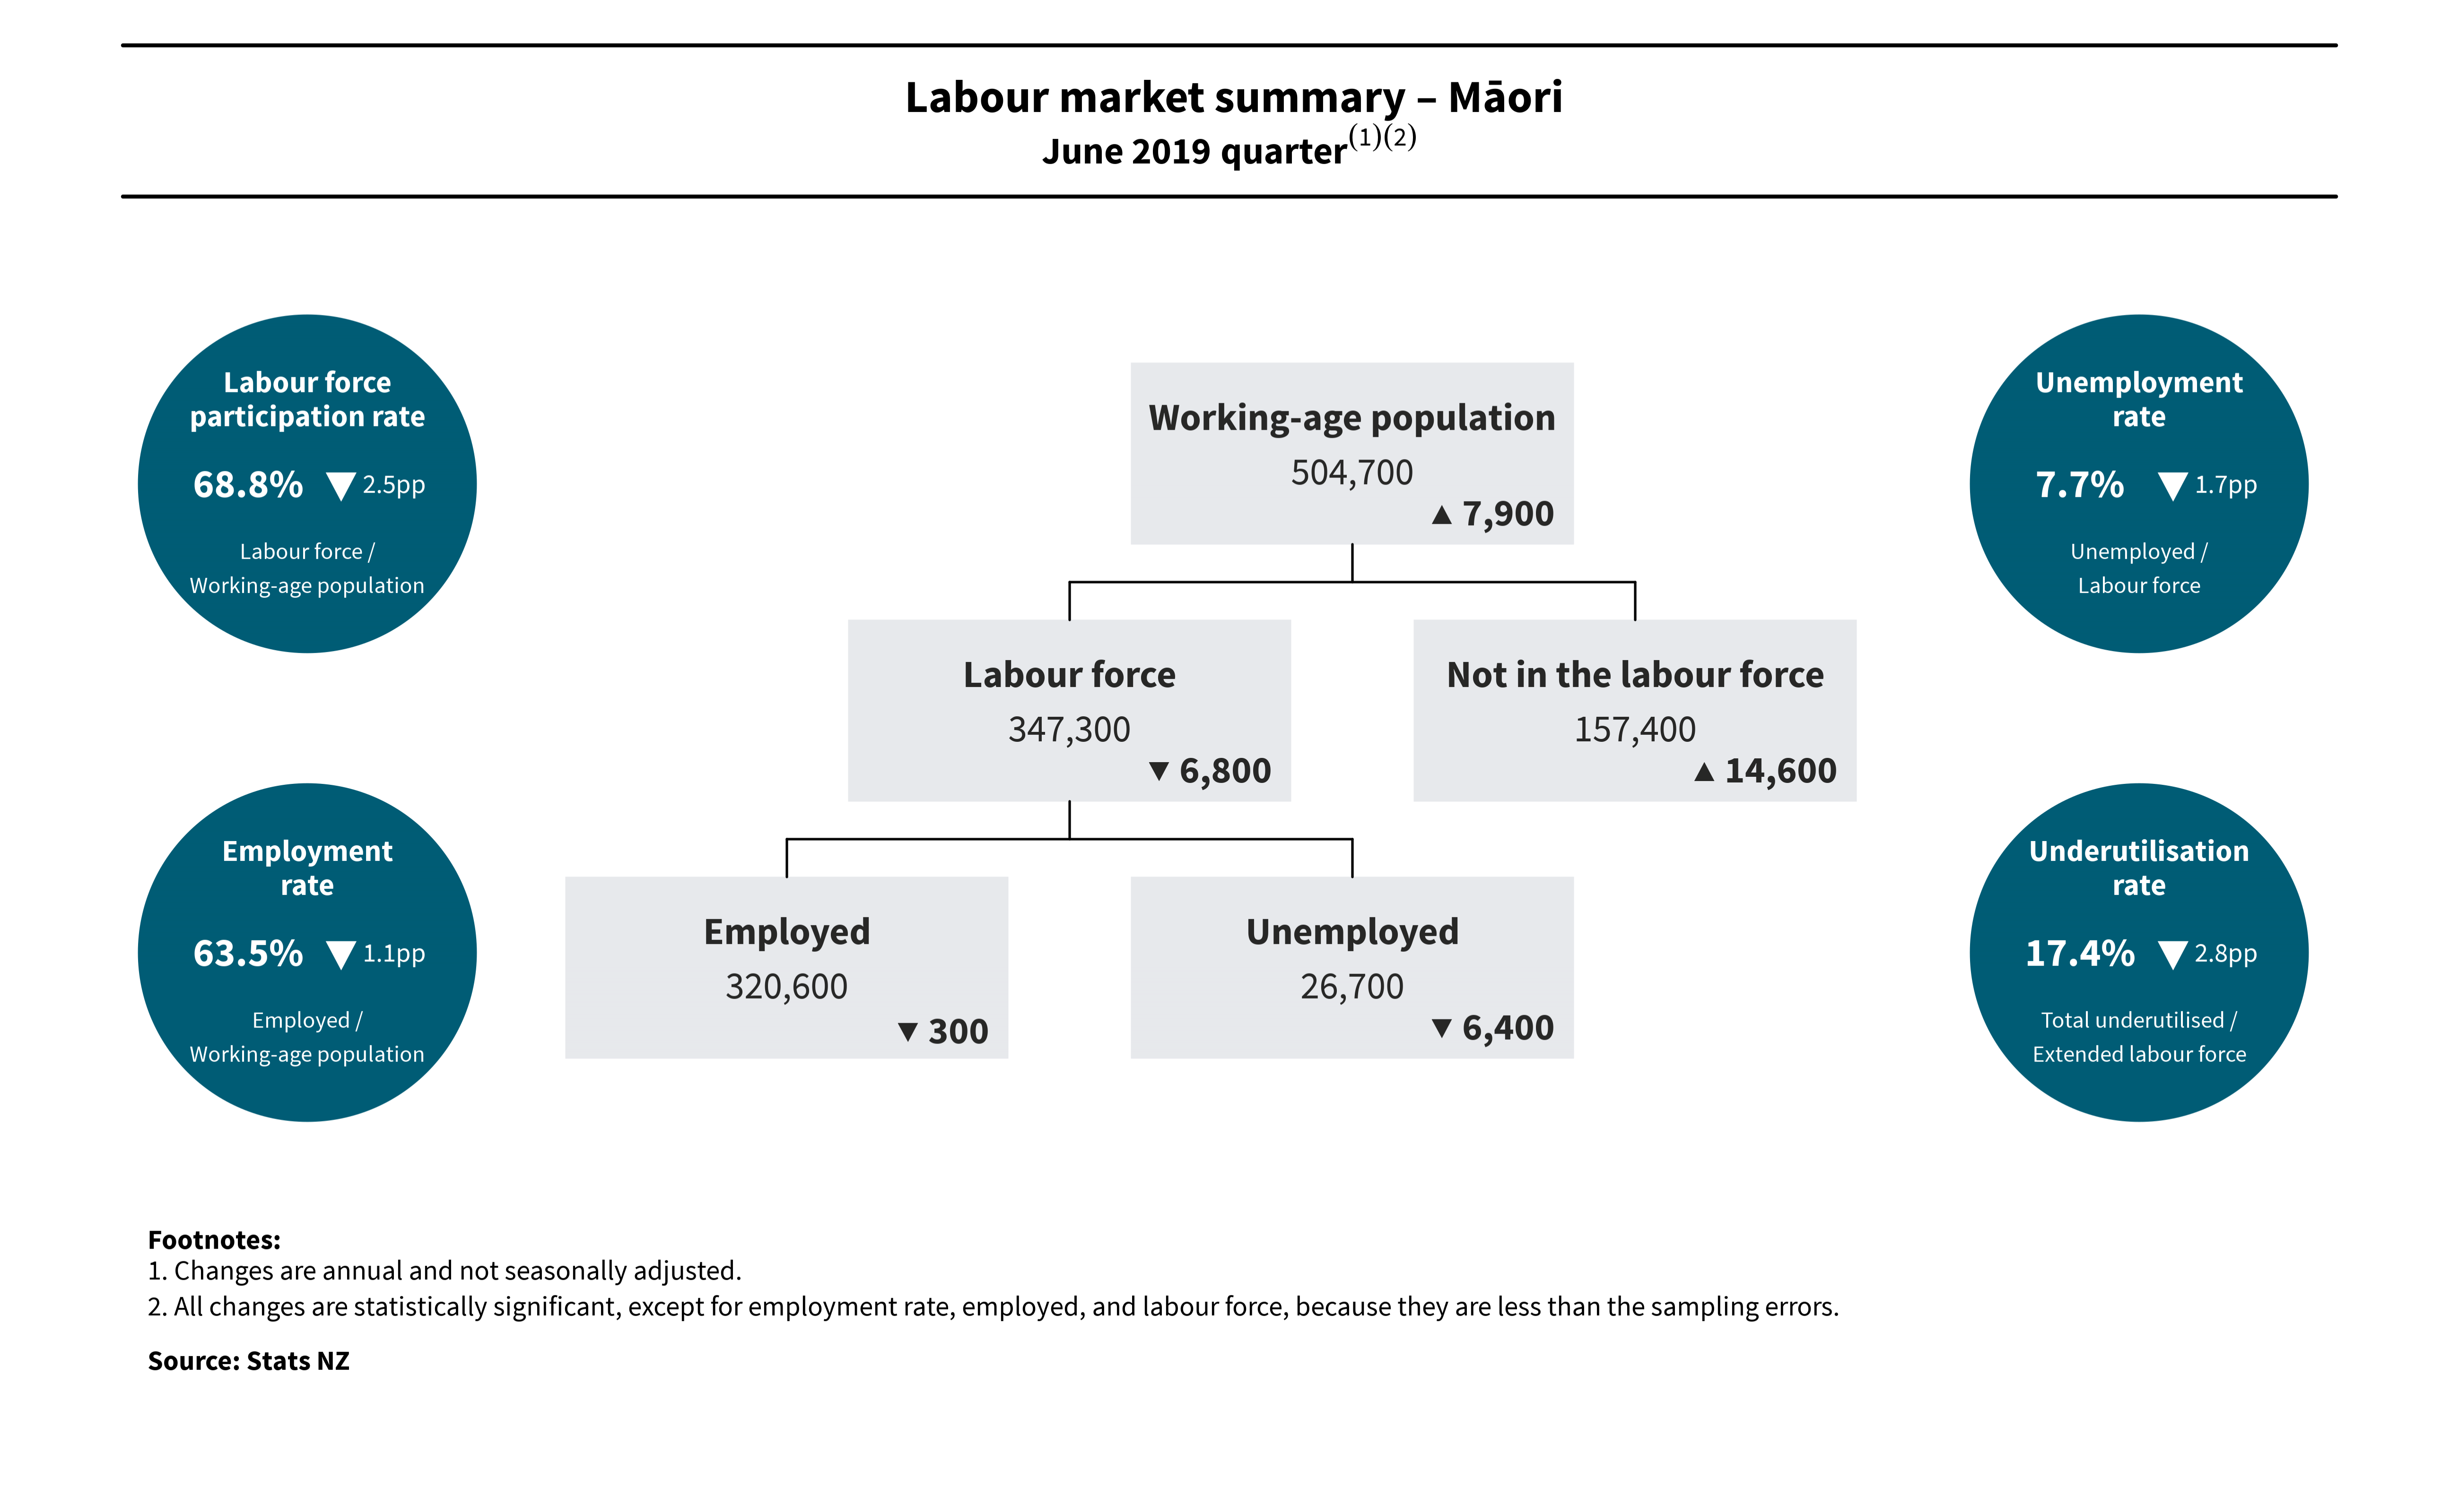
Text alternative for diagram, Labour market summary - Māori, June 2019 quarter
Underutilisation lowest since 2008
In the June 2019 quarter, the seasonally adjusted underutilisation rate fell to 11.0 percent, down from 11.3 percent last quarter. This is the lowest underutilisation rate since the September 2008 quarter, when it was 10.5 percent.
The underutilisation rate provides a broader measure of spare capacity or slack in New Zealand's labour market.
For women, the underutilisation rate was 13.0 percent, down from 13.7 percent in the March 2019 quarter. This is the lowest underutilisation rate for women since the September 2008 quarter, when it was 12.6 percent. For men, it was 9.1 percent, up slightly from 9.0 percent last quarter.
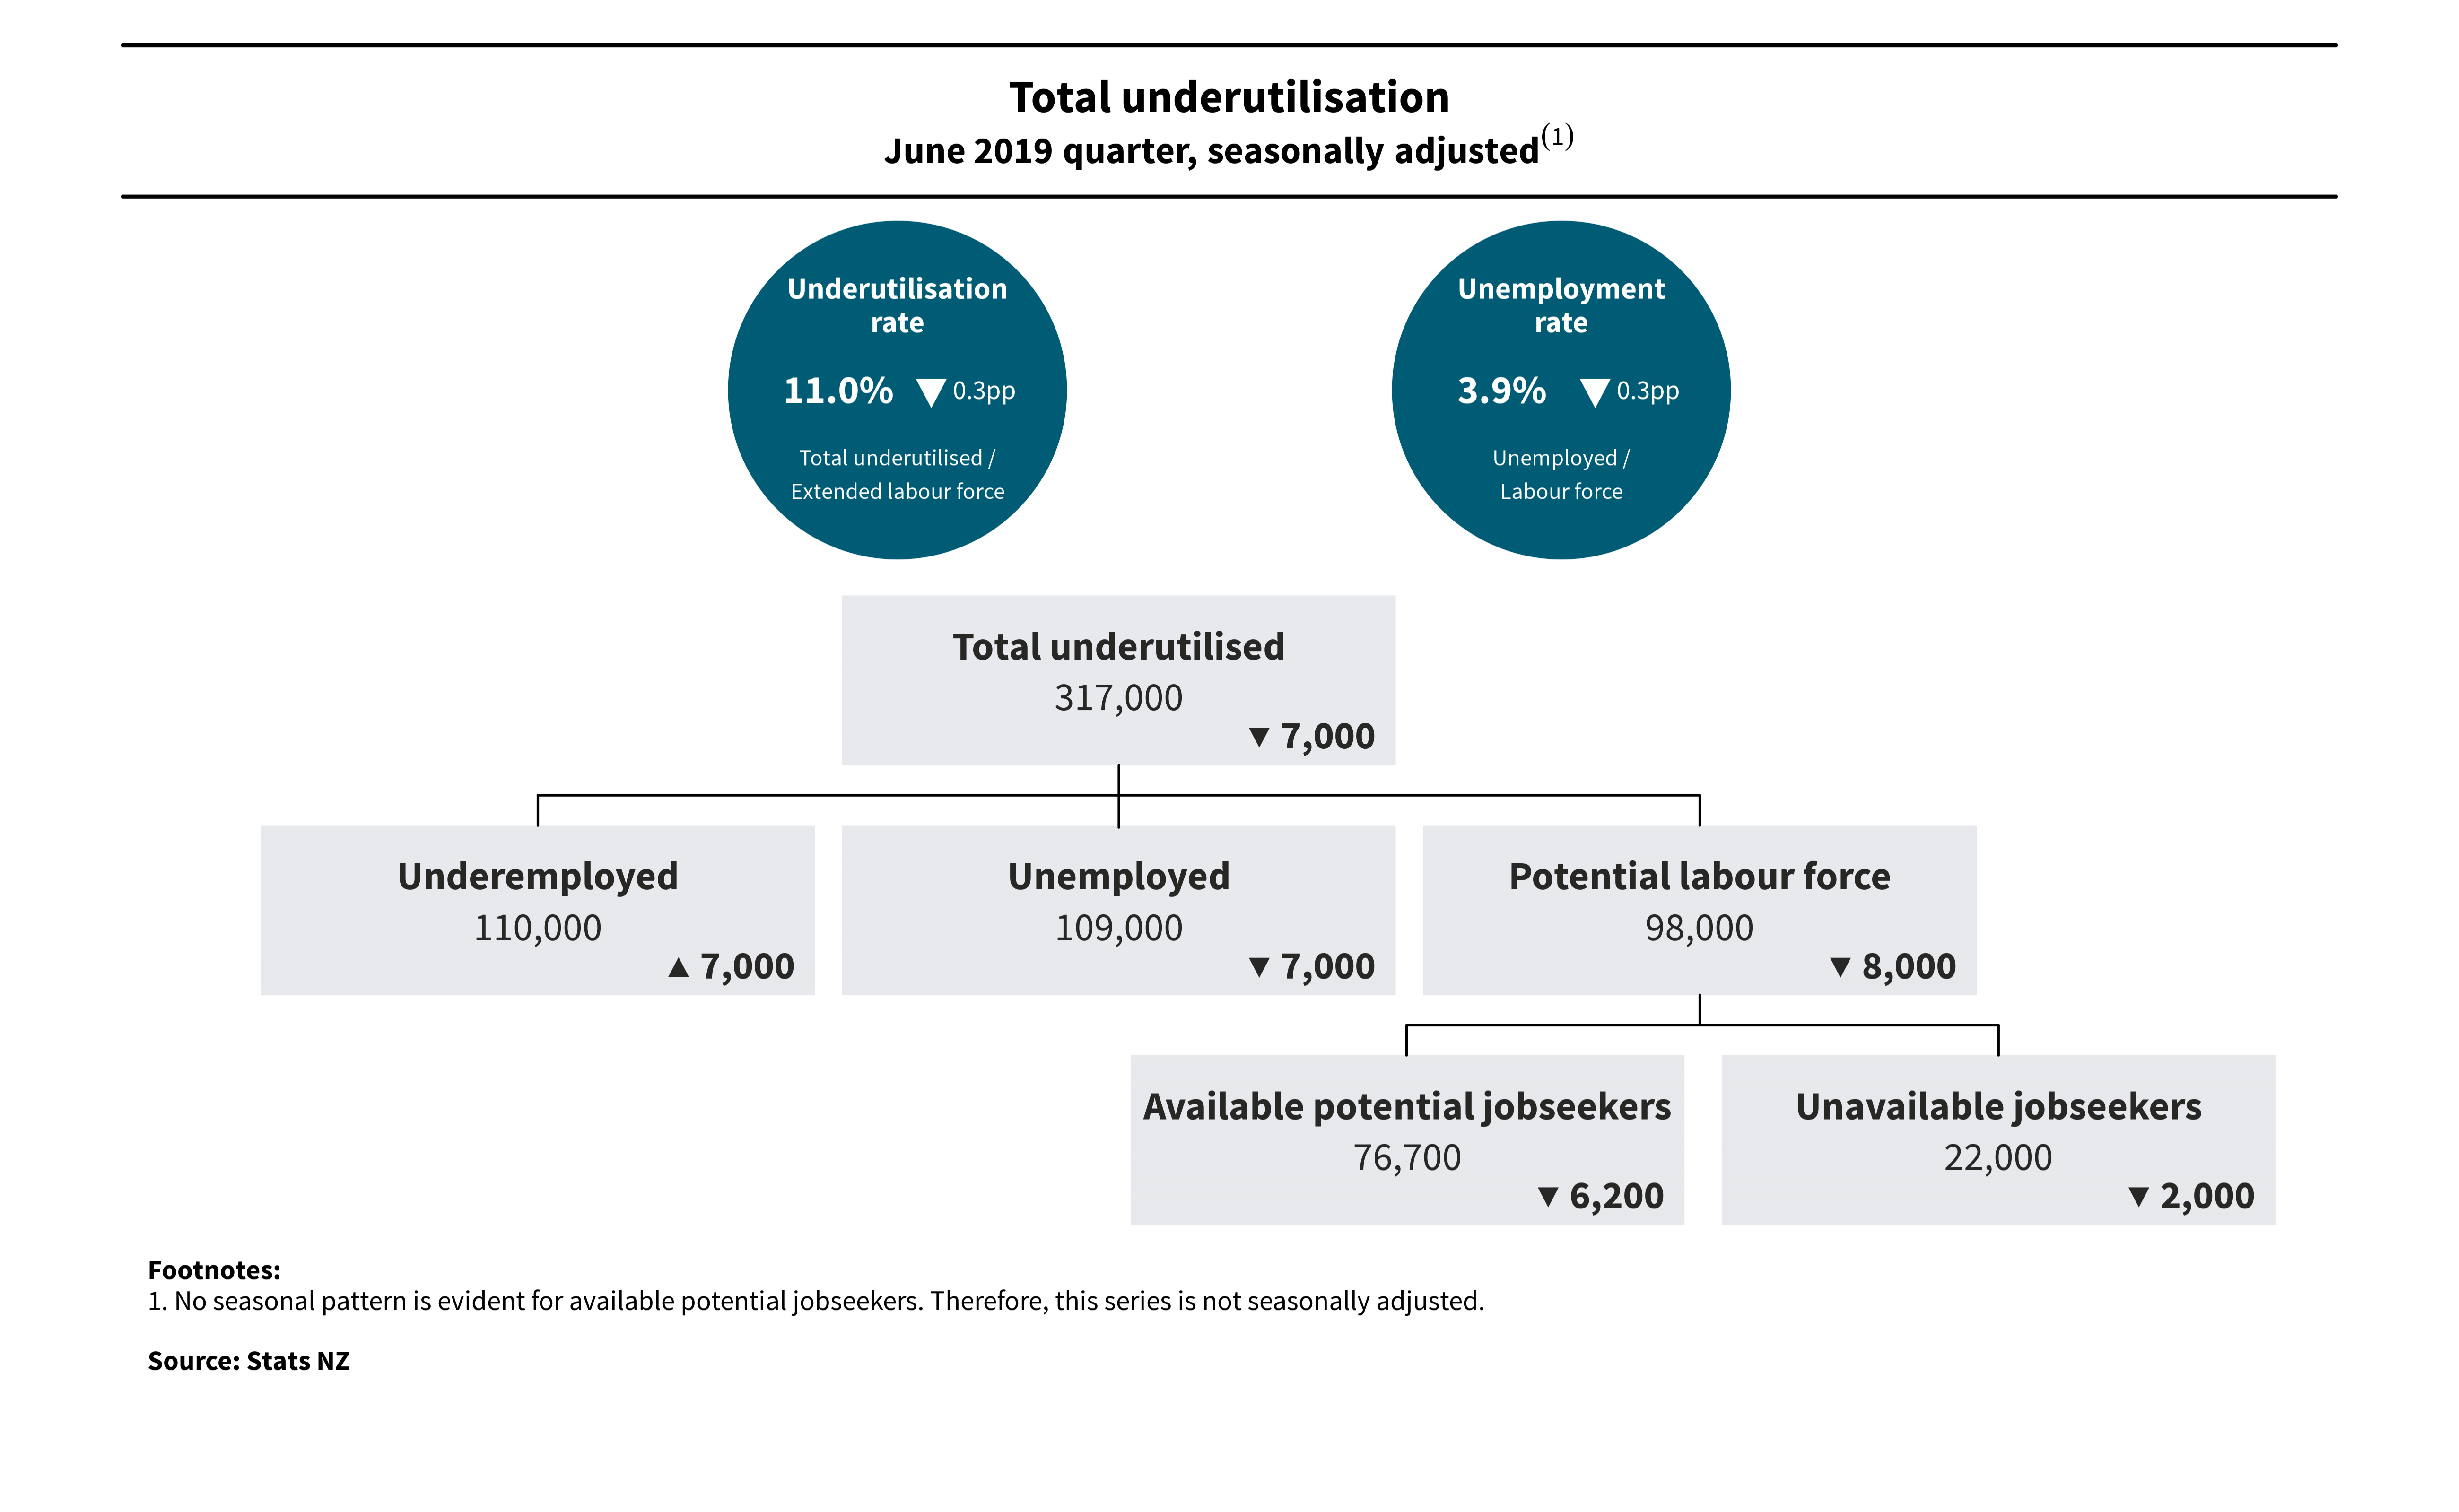
Text alternative for diagram, Total underutilisation, June 2019 quarter, seasonally adjusted
Overall, the seasonally adjusted number of people who were underutilised fell by 7,000, to 317,000 in the June 2019 quarter. The fall in underutilisation was driven by women (down 9,000), while the number of underutilised men increased (up 2,000).
| Quarter | Total both sexes - persons officially unemployed | Total both sexes - persons underemployed | Total both sexes - total potential labour force |
| Jun-08 | 86000 | 65000 | 83000 |
| Sep-08 | 92000 | 68000 | 87000 |
| Dec-08 | 101000 | 77000 | 91000 |
| Mar-09 | 113000 | 82000 | 94000 |
| Jun-09 | 131000 | 91000 | 104000 |
| Sep-09 | 140000 | 103000 | 109000 |
| Dec-09 | 149000 | 95000 | 115000 |
| Mar-10 | 134000 | 79000 | 110000 |
| Jun-10 | 150000 | 82000 | 106000 |
| Sep-10 | 138000 | 91000 | 104000 |
| Dec-10 | 142000 | 83000 | 110000 |
| Mar-11 | 138000 | 89000 | 112000 |
| Jun-11 | 140000 | 93000 | 109000 |
| Sep-11 | 137000 | 83000 | 109000 |
| Dec-11 | 139000 | 85000 | 107000 |
| Mar-12 | 147000 | 90000 | 106000 |
| Jun-12 | 148000 | 92000 | 120000 |
| Sep-12 | 156000 | 94000 | 132000 |
| Dec-12 | 146000 | 91000 | 122000 |
| Mar-13 | 134000 | 79000 | 100000 |
| Jun-13 | 139000 | 81000 | 103000 |
| Sep-13 | 137000 | 98000 | 113000 |
| Dec-13 | 135000 | 107000 | 106000 |
| Mar-14 | 134000 | 90000 | 107000 |
| Jun-14 | 126000 | 98000 | 111000 |
| Sep-14 | 128000 | 94000 | 100000 |
| Dec-14 | 136000 | 98000 | 108000 |
| Mar-15 | 136000 | 98000 | 118000 |
| Jun-15 | 135000 | 94000 | 124000 |
| Sep-15 | 140000 | 90000 | 127000 |
| Dec-15 | 123000 | 81000 | 120000 |
| Mar-16 | 133000 | 96000 | 134000 |
| Jun-16 | 129000 | 110000 | 113000 |
| Sep-16 | 130000 | 113000 | 101000 |
| Dec-16 | 139000 | 106000 | 94000 |
| Mar-17 | 131000 | 109000 | 99000 |
| Jun-17 | 125000 | 103000 | 99000 |
| Sep-17 | 129000 | 115000 | 97000 |
| Dec-17 | 122000 | 121000 | 99000 |
| Mar-18 | 119000 | 114000 | 105000 |
| Jun-18 | 122000 | 117000 | 103000 |
| Sep-18 | 111000 | 110000 | 106000 |
| Dec-18 | 120000 | 118000 | 112000 |
| Mar-19 | 115000 | 103000 | 106000 |
| Jun-19 | 109000 | 110000 | 98000 |
In the June 2019 quarter, the fall in the number of underutilised women was driven by a fall in the number of women in the potential labour force (down 6,000). This fall occurred alongside falls in the number of unemployed women (down 2,000), and in the number of underemployed women (down 1,000).
"Alongside falls in the unemployment and underutilisation rates, the employment rate has risen. Women fared particularly well, with the second-highest employment rate on record," Mr Broughton said.
Employment rate up
The seasonally adjusted employment rate rose to 67.7 percent in the June 2019 quarter, up from 67.5 percent last quarter.
The employment rate for men rose slightly to 72.4 percent, up from 72.3 percent last quarter. For women, the employment rate rose to 63.1 percent, up from 62.9 percent.
Annually, 44,100 (unadjusted) more people were employed (up 1.7 percent) - 27,100 more women, and 17,100 more men.
On an annual basis, filled jobs, as measured in the quarterly employment survey (QES), increased 1.0 percent (unadjusted) - 19,900 more jobs. Jobs held by women increased by 21,000, while jobs held by men decreased by 1,100.
Differences between filled jobs in the QES and employment numbers in the household labour force survey (HLFS) can largely be explained by differences in survey coverage. The QES excludes some industries (including agriculture), and people who are self-employed without employees (to better fit international standards). Conversely, the HLFS only includes usually resident New Zealanders, so can exclude some temporary seasonal labourers.
The labour cost index (LCI) salary and wage rates (including overtime) increased 2.1 percent in the year to the June 2019 quarter, while the unadjusted LCI increased 3.6 percent.
Over the year, wages within the QES also grew. Average ordinary time hourly earnings increased to $32.37 (up 4.4 percent). This is the largest percentage increase in average ordinary time hourly earnings since June 2009, when it was 4.7 percent.
Wage measures in both the LCI and the QES were driven up by several collective agreements, which came into force over the year (most notably for nurses), as well as the Government increase to the minimum wage on 1 April 2019 to $17.70.
See Minimum wage rise boosts private sector pay rates for more information on the impact of the increase to the minimum wage.
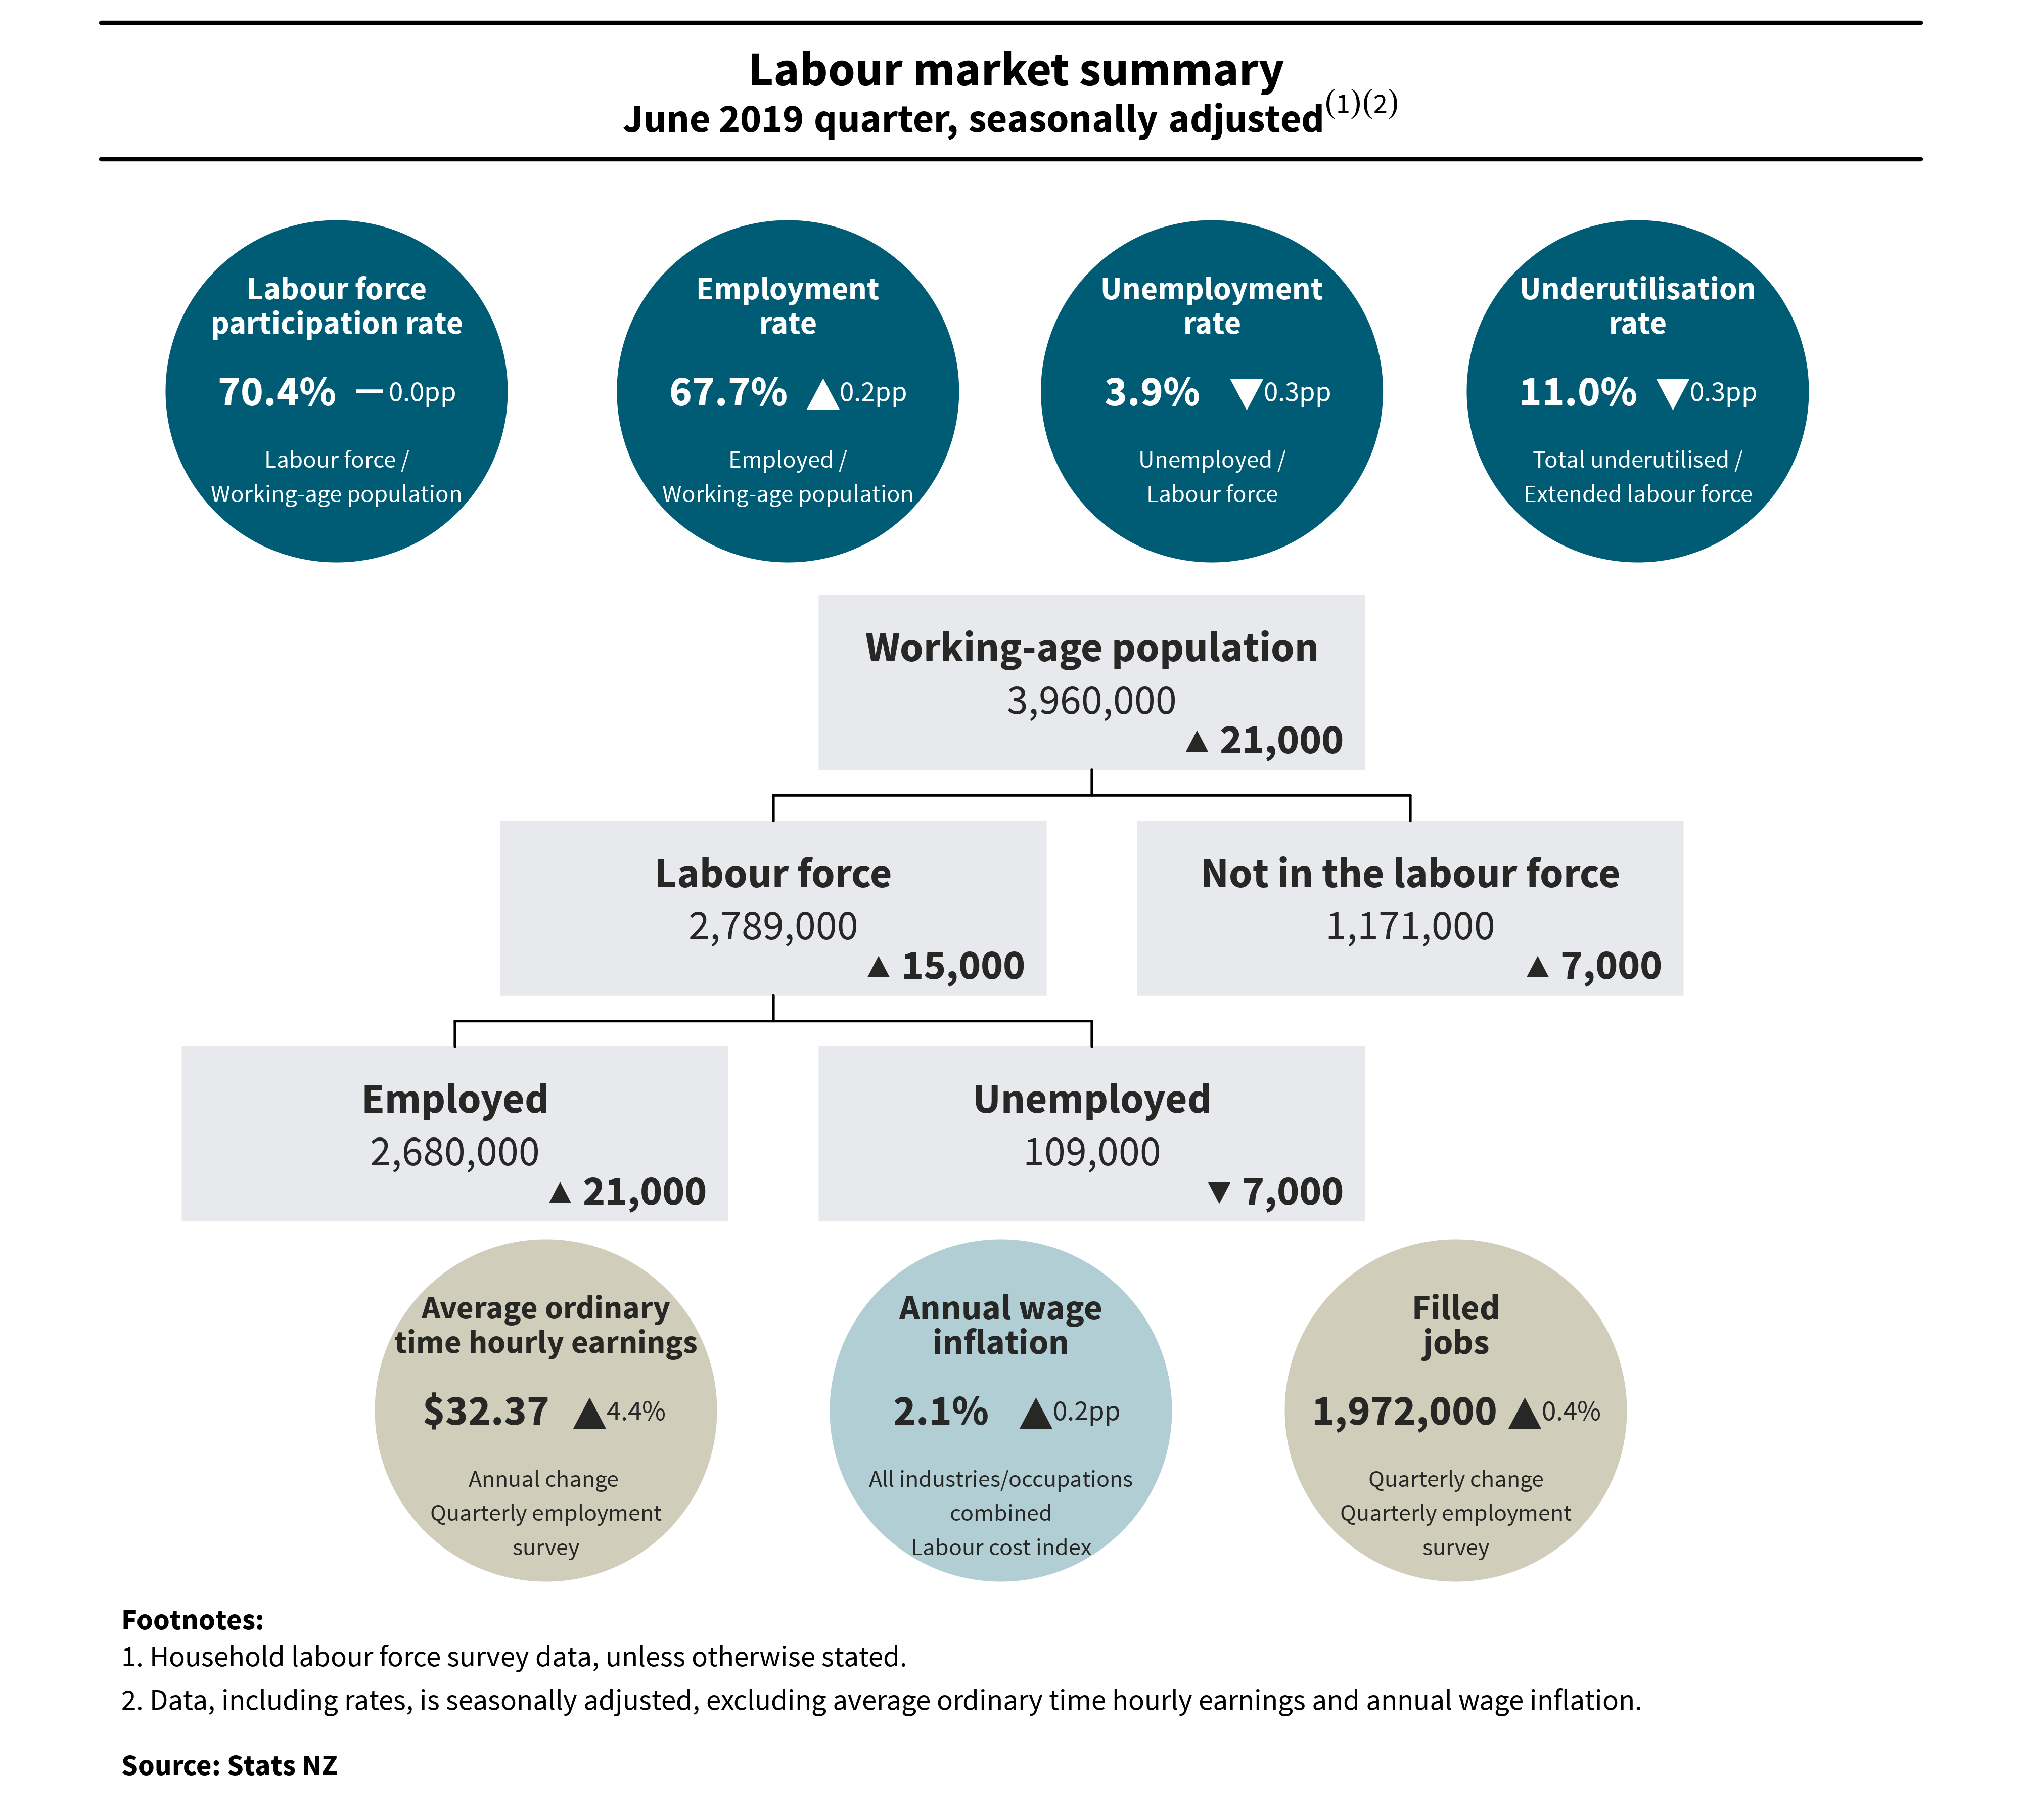
Text alternative for diagram, Labour market summary, June 2019 quarter, seasonally adjusted
Text alternative for diagram, Labour market summary - Māori, June 2019 quarter
Diagram shows data from June 2019 quarter's household labour force survey (HLFS), compared with the June 2018 quarter. HLFS results for the June 2019 quarter showed the labour force participation rate was 68.8%, down 2.5pp (percentage points). This rate is derived from labour force divided by working-age population. The employment rate was 63.5%, down 1.1pp. This is derived from employed divided by working-age population. The unemployment rate was 7.7%, down 1.7pp. This is derived from unemployed divided by labour force. The underutilisation rate was 17.4%, down 2.8pp. This is derived from total underutilised divided by extended labour force. The working-age population was up 7,900 to 504,700. This is made up of the labour force, down 6,800 to 347,300, and people not in the labour force, up 14,600 to 157,400. The labour force is made up of employed people, down 300 to 320,600, and those unemployed, down 6,400 to 26,700. Note: Changes are annual and not seasonally adjusted. All changes are significant, except for employment rate, employed, and labour force, because they are less than the sampling errors.
Text alternative for diagram, Total underutilisation, June 2019 quarter, seasonally adjusted
Diagram shows data from June 2019 quarter's household labour force survey (HLFS), compared with the June 2018 quarter. The underutilisation rate was 11.0%, down 0.3pp (percentage points). This rate is derived from total underutilised divided by the extended labour force. The unemployment rate was 3.9%, down 0.3pp. This is derived from unemployed divided by labour force. Total underutilised was down 7,000, to 317,000. Underemployed was up 7,000 to 110,000. Unemployed was down 7,000 to 109,000. The potential labour force was down 8,000 to 98,000. Within the potential labour force, available potential jobseekers were down 6,200 to 76,700 and unavailable jobseekers were down 2,000 to 22,000. Note: No seasonal pattern is evident for available potential jobseekers. Therefore, this series is not seasonally adjusted.
Text alternative for diagram, Labour market summary, June 2019 quarter, seasonally adjusted
Diagram shows data from June 2019 quarter's household labour force survey (HLFS), quarterly employment survey (QES), and labour cost index (LCI), compared with the March 2019 and June 2018 quarters. HLFS results for the June 2019 quarter showed the labour force participation rate was 70.4%, no change. This rate is derived from labour force divided by working-age population. The employment rate was 67.7%, up 0.2pp (percentage points). This is derived from employed divided by working-age population. The unemployment rate was 3.9%, down 0.3pp. This is derived from unemployed divided by labour force. The underutilisation rate was 11.0%, down 0.3pp. This is derived from total underutilised divided by extended labour force. The working-age population was up 21,000 to 3,960,000. This is made up of the labour force, up 15,000 to 2,789,000, and people not in the labour force, up 7,000 to 1,171,000. The labour force is made up of employed people, up 21,000 to 2,680,000, and those unemployed, down 7,000 to 109,000. Average ordinary time hourly earnings from the QES were up 4.4% annually, to $32.37. Annual wage inflation from the LCI was up 0.2pp to 2.1%, for all industries and occupations combined. Filled jobs from the QES were up 0.4% for the quarter, to 1,972,000. Note: Data, including rates, is seasonally adjusted, excluding average ordinary time hourly earnings and annual wage inflation.


