We are seeking to improve our Environmental Indicator releases. We want to understand what people find most useful in the releases, and how they can be improved.
Provide your feedback in our survey Feedback form: Environmental Indicators.
You can also contact us at [email protected].
This indicator refers to land cover types dominated by artificial features, including urban area (comprising built-up area, settlement, urban parkland, and open space) and artificial bare surfaces (comprising transport infrastructure and surface mine or dump).
We report the area of Aotearoa New Zealand's urban land cover in 1996, 2001, 2008, 2012, 2018, and 2023 based on data from the New Zealand Land Cover Database version 6.0 (LCDB v6.0).
Land cover in New Zealand is described using three indicators: Indigenous land cover, Exotic land cover, and Urban land cover.
Definitions and metadata has more information about this indicator.
Key findings
In 2023, 0.3 million hectares (1 percent) of Aotearoa New Zealand's land cover was urban. This was less than the area of indigenous land cover (12.6 million hectares or 47 percent), and exotic land cover (13.5 million hectares or 50 percent).
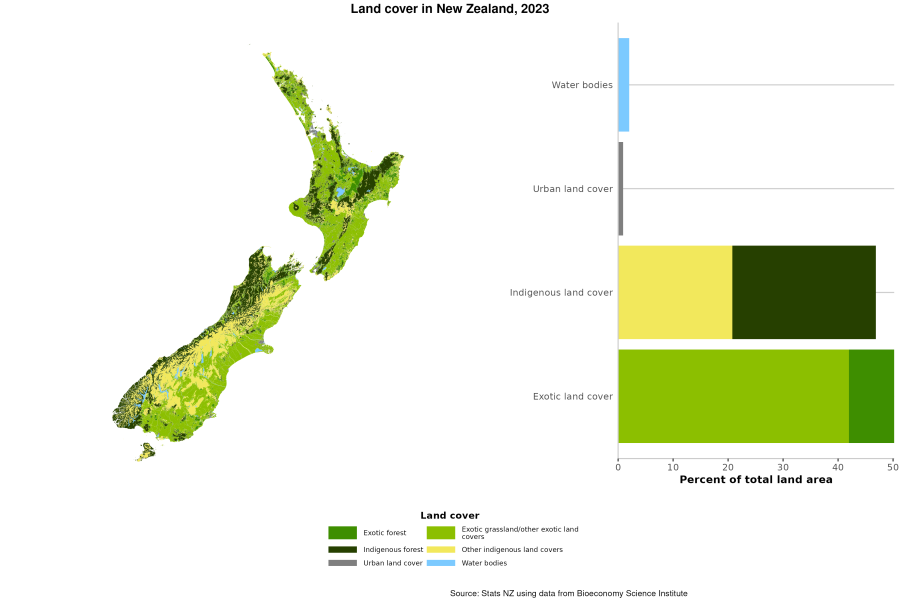
Text alternative for Land cover in New Zealand, 2023
A map of New Zealand on the left shows New Zealand land cover in 2023. A bar chart on the right shows the percent of New Zealand total land area that is water bodies (2 percent), urban land cover (1 percent), indigenous land cover (47 percent, comprises indigenous forest and other indigenous land cover), and exotic land cover (50 percent, comprises exotic forest and exotic grassland/other exotic land cover). The colour green represents exotic forest, light green is exotic grassland/other exotic land cover, dark green is indigenous forest, yellow is other indigenous land cover, grey is urban land cover, and blue is water bodies.
Land cover maps include interactive maps for you to explore changes in land cover over time in New Zealand.
New Zealand's urban land cover continued its long-term expansion, increasing by 47,220 hectares between 1996 and 2023.
Between 2018 and 2023, New Zealand's urban land cover increased by 10,710 hectares.
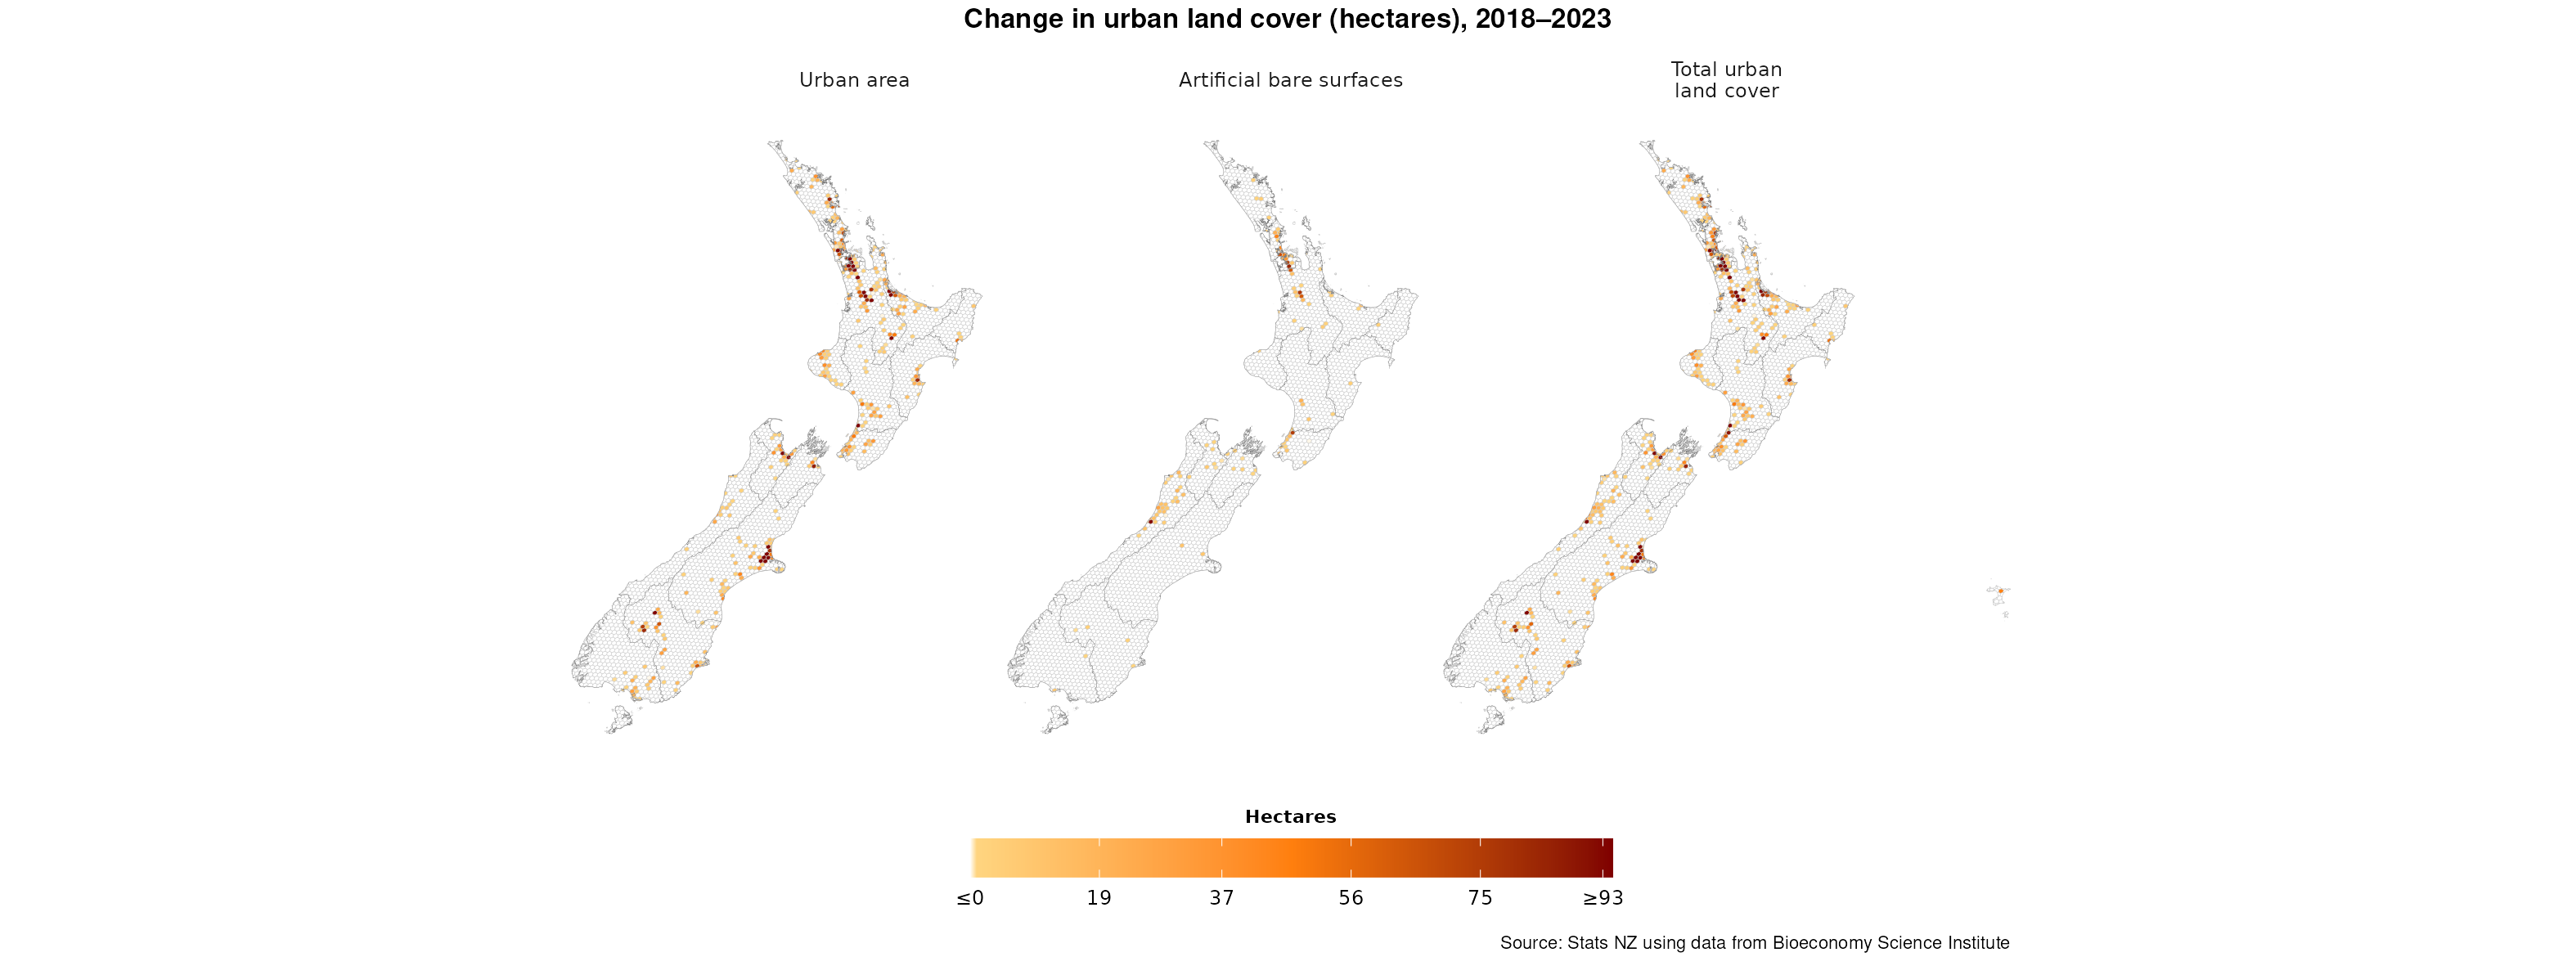
Text alternative for Change in urban land cover (hectares), 2018-2023
Three maps of New Zealand show hexagonal grid cells coloured according to the change in hectares of a specific land cover between 2018 and 2023. The maps are titled urban area, artificial bare surfaces, and total urban land cover. Yellow represents less than zero hectares (minimal change), transitioning through orange to dark brown, which represents a net increase of 93 hectares or more.
Of the 10,879 hectares of land cover converted to urban land cover between 2018 and 2023, 94 percent was previously exotic land cover.
Urban area (built-up area/settlement, urban parkland/open space)
New Zealand's urban area (built-up area/settlement, urban parkland/open space) increased by 9,514 hectares between 2018 and 2023.
Of the 9,824 hectares of urban area converted from other land cover classes:
- 78 percent was converted from exotic grassland
- 14 percent was converted from cropping and horticulture.
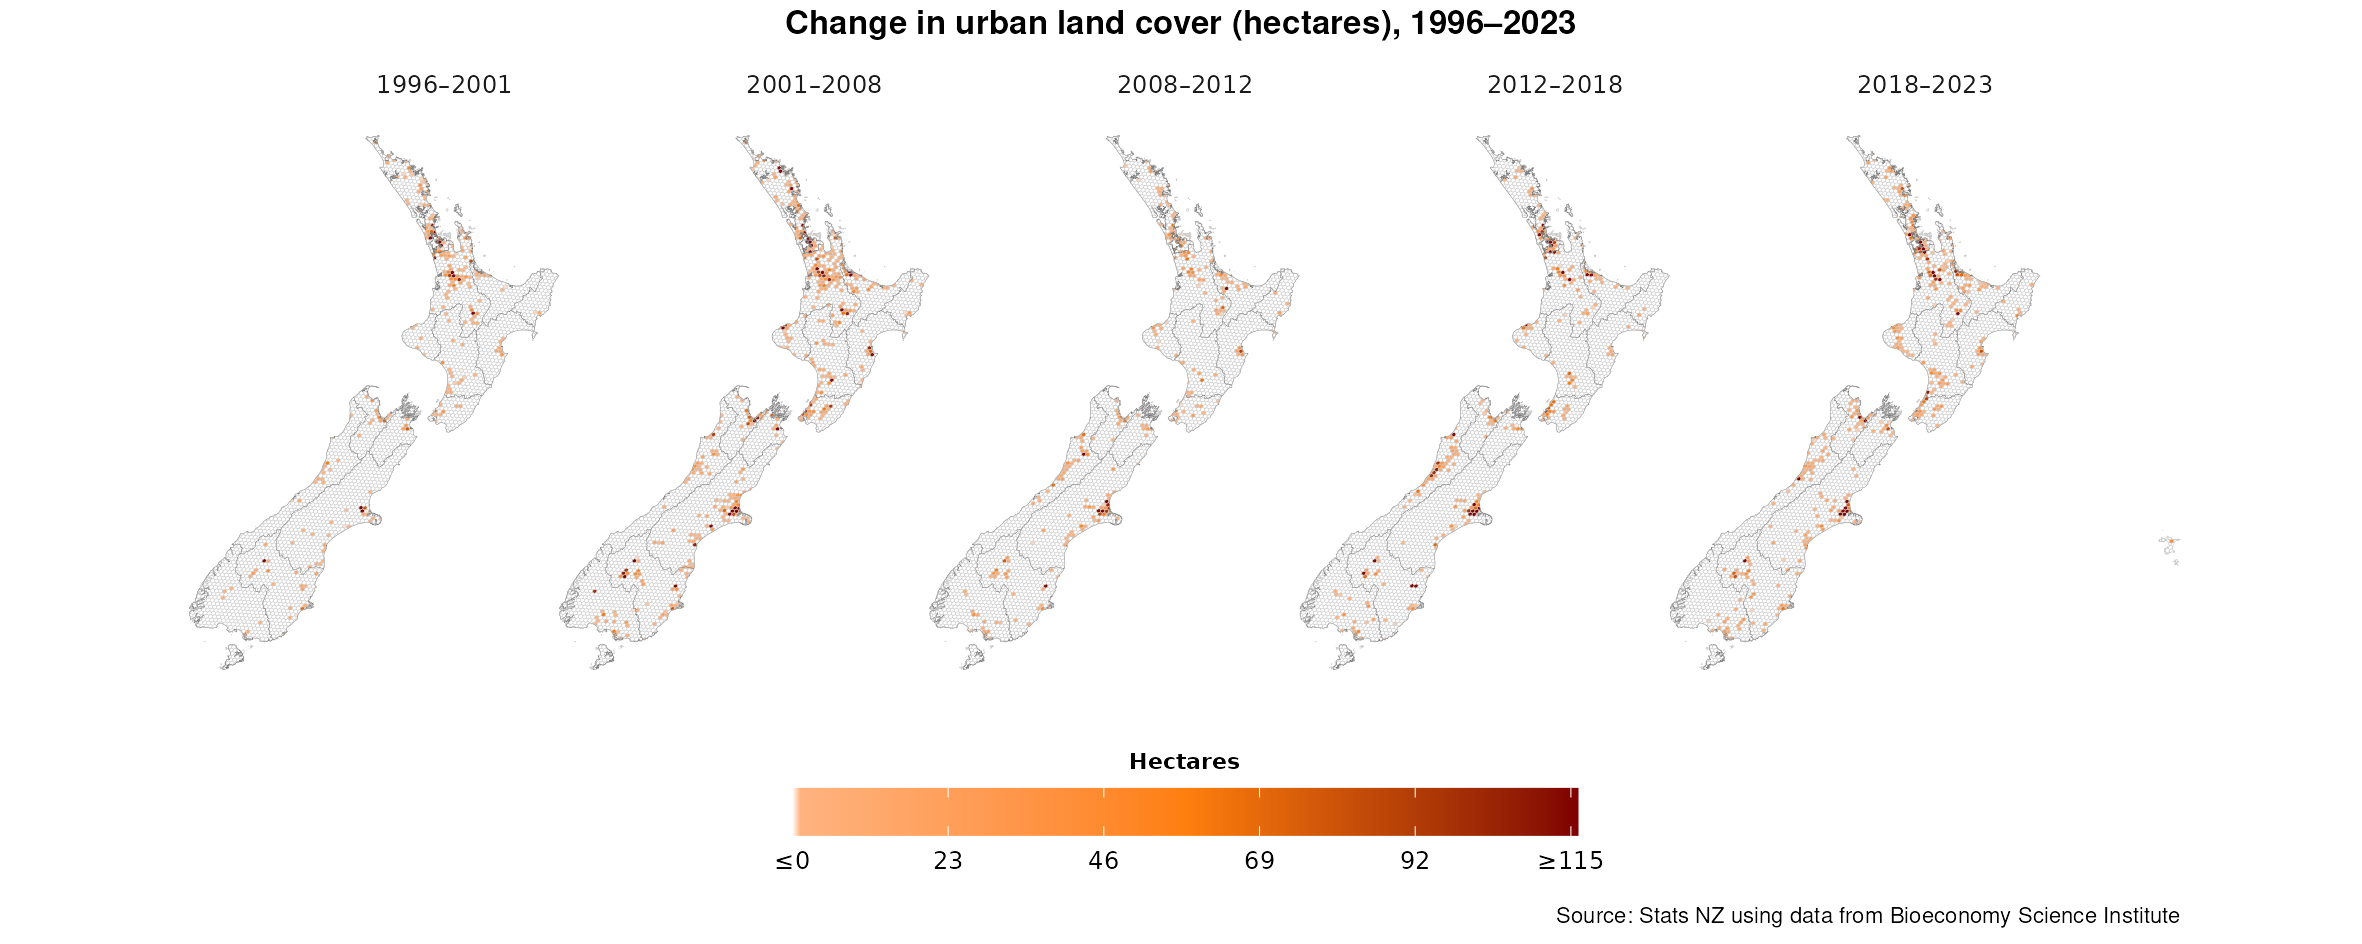
Text alternative for Change in urban land cover (hectares), 1996-2023
Five maps of New Zealand show hexagonal grid cells coloured according to the change in hectares of urban land cover between 1996 and 2001, 2001 and 2008, 2008 and 2012, 2012 and 2018, and 2018 and 2023. Yellow represents less than zero hectares (minimal change) transitioning through orange to dark brown, which represents a net increase of 115 hectares or more.
By region
Between 2018 and 2023:
- net increases in urban land cover (including urban area and artificial bare surfaces) occurred in all 16 regions, with Canterbury having the largest net increase (2,069 hectares)
- net increases in urban area occurred in all 16 regions, with Canterbury having the largest net increase (2,075 hectares)
- net increases in artificial bare surfaces occurred in 12 of 16 regions, with Auckland having the largest net increase in artificial bare surfaces area (513 hectares).
Why it is important
Most New Zealanders live in urban areas and population numbers are generally growing, increasing demand for development and transport infrastructure, particularly to fringe areas. Urban expansion can put pressure on the environment as the creation of artificial features (such as buildings and roads) often outpaces the development of green spaces. This can intensify local heat extremes and storm water run-off. Changes in urban land cover can be used to understand its impact on biodiversity and ecosystems (PCE, 2023; IPCC, 2023). When urban expansion replaces land formerly used for agriculture or forestry, it also means the loss of fertile land for food and fibre production, with implications for primary industries.
Where this data comes from
Manaaki Whenua - Landcare Research Group, Bioeconomy Science Institute
Definitions and metadata
Land cover: Data to 2023 - Datainfo+ provides information on the methodology, metadata, and references supporting these statistics.
New Zealand's environmental reporting - Datainfo+ gives supporting information on Environmental indicators Te taiao Aotearoa.
Topics for environmental reporting outlines the 'Land cover, ecosystems, and habitats' topic, of which urban land cover is a direct measure.
Related indicators
Indigenous land cover: Data to 2023
Exotic land cover: Data to 2023
Related content
Archived pages
Archived November 2025:
Urban land cover - published April 2021


