
Family and household projections indicate the future trends in the size and broad types of families and households usually living in New Zealand, including 16 regional council areas (regions), 67 territorial authority areas (TAs), and 21 Auckland local board areas (ALBs).
| At 30 June | Other multi-person household | One-person household | Family household |
| 2023 (base) | 109000 | 434800 | 1353400 |
| 2028 | 109100 | 458800 | 1449400 |
| 2033 | 116600 | 485000 | 1537000 |
| 2038 | 123400 | 508100 | 1624100 |
| 2043 | 127300 | 532000 | 1707800 |
| 2048 | 130400 | 552100 | 1784000 |
Smaller average household size
Average household size is projected to gradually decrease between 2023 and 2048, from 2.69 to 2.60 people per household (medium B projection). This continues the long-term trend which saw average household size drop from 3.68 in 1945 to 2.76 in 1996. The national average household size has been steady since 2001 − around 2.7 people per household.
Declining average household size is projected for all regions and most TAs and ALBs. This reflects an increasing number of one-person households, and a gradual decrease in the average family size. Growth of one-person households is projected to be slightly above the national average in Tasman, Auckland, and Waikato regions.
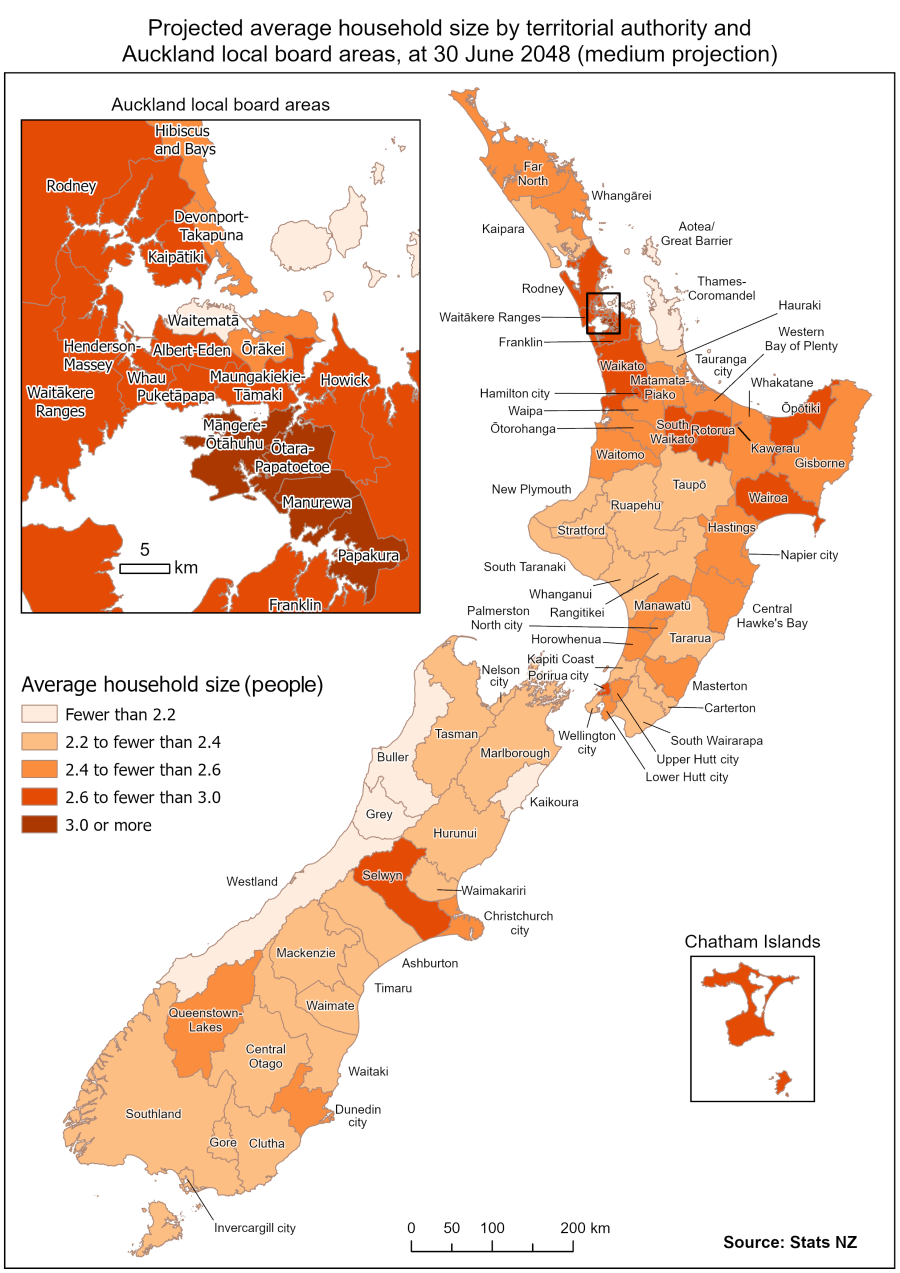
Differences in average household size between TAs and ALBs reflect differences in family and household composition for each area. Areas where the number of children grows slower than the number of parents are generally projected to experience steeper declines in average household size over time. In 2048, average household size is projected to be highest in Ōtara-Papatoetoe (3.56 people), Māngere-Ōtāhuhu (3.52 people) and Manurewa (3.40 people). These Auckland local board areas also had the highest average household sizes in 2023 (3.72, 3.81, and 3.61 people, respectively).
In contrast, average household size in 2048 is projected to be the smallest in Buller District, Westland District, and Aotea/Great Barrier and Waiheke local board areas (all with 2.0 people). These areas had some of the lowest average household sizes in 2023 (2.11, 2.23, 1.98, and 2.20 people, respectively).
Smaller average family size
Two-parent families are projected to remain the most common of the three broad family types. The average number of children in two-parent families is projected to decline from 1.88 in 2023 to 1.58 in 2048, reflecting the long-term trend towards lower fertility rates and resulting in smaller family sizes.
The cohort completed fertility rate indicates a progressive decline in completed family size. Women born in the early 1950s averaged 2.5 births each, compared with 2.2 for those born in the early 1970s, and 1.9 for those born in the early 1990s.
As a result, children in families - who can be of any age - are projected to drop to 26 percent of the population in 2048, compared with 30 percent in 2023.
Couple-without-children families - which include couples who will never have children, but mainly comprise couples whose children have left home (empty-nesters) - are projected to account for 40 percent of families in 2048, down slightly from 41 percent in 2023.
Most of the growth in this family type will be among partners who are aged 65+ years. They are projected to account for 49 percent of the partners in couple-without-children families in 2048, compared with 38 percent in 2023, and 28 percent in 1991.
Methodological changes
An imputation method was used to derive living arrangement types for 2018 and 2023 Census usual residents for the purposes of these projections. Where a living arrangement type could not be derived from census family nucleus information, or where the derived living arrangement type was considered unreliable, a living arrangement type was imputed using characteristics including age, sex, and ethnicity.
The revised method enabled living arrangement types to be derived for all 2018 and 2023 Census usual residents. The sequential propensity modelling process from 2018-base family and household projections, remains unchanged and uses the living arrangement types derived from 2001−2023 Census data
See 2023-base family and household projections: Methodology - DataInfo+ for more information.
Text alternative for diagram Population, family, and household projections: 2023(base)-2048
The diagram shows how the population flows into households and families, with estimates for 2023 and projections for 2048. In 2023, the population was 5.20 million people, with 5.11 million of those people living in 1.90 million households, and 92,000 people in non-private dwellings. Of all households, 1.35 million were family households, housing 1.43 million families. There were also 109,000 other multi-person households, and 435,000 one-person households. The families included 585,000 couple-without-children families, 605,000 two-parent families, and 242,000 one-parent families. In 2048 these numbers are all projected to increase. The projected population is 6.53 million people in 2048, of which 6.41 million are living in 2.47 million households, and another 120,000 people in non-private dwellings. Of households, 1.78 million will be family households, housing 1.89 million families. There will also be 130,000 other multi-person households, and 552,000 one-person households. The families will include 754,000 couple-without-children families, 805,000 two-parent families, and 328,000 one-parent families.
Text alternative for map Projected average household size by territorial authority and Auckland local board areas, at 30 June 2048 (medium projection)
The map shows the projected average household size for 67 territorial authorities and 21 Auckland local board areas, at 30 June 2048. These results are based on the medium subnational family and household projections. Based on the average household size, the lighter colours indicate a smaller average household size for an area and the darker colours indicate a larger average household size for an area. See Subnational household projections, by household type, 2023(base)-2048 in Aotearoa Data Explorer for the data in this map.
More data
Use Aotearoa Data Explorer for further family and household projections by selecting 'Society', 'Population projections'; and then 'Family and household projections'. The following links will take you to the latest projections by specific variables.
- National family and household projections, population by living arrangement type, age, and sex, 2023(base)-2048
- National family projections, by family type, 2023(base)-2048
- National household projections, by household type, 2023(base)-2048
- Subnational family and household projections, population by living arrangement type, and age, 2023(base)-2048
- Subnational family projections, by family type, 2023(base)-2048
- Subnational household projections, by household type, 2023(base)-2048
Definitions and metadata
2023-base family and household projections: Methodology - DataInfo+ provides the general methodology used in this release.
National family and household projections - DataInfo+ provides general information about national family and household projections.
Subnational family and household projections - DataInfo+ provides general information about subnational family and household projections.
Projection alternatives - DataInfo+ provides definitions of terms relating to projection alternatives and variants used in this release.
Family and household concepts - DataInfo+ provides definitions of terms relating to family used in this release.
Fertility concepts - DataInfo+ provides definitions of terms relating to fertility used in this release.
Mortality concepts - DataInfo+ provides definitions of terms relating to mortality used in this release.
Population concepts - DataInfo+ provides definitions of terms relating to population used in this release.
Technical enquiries
Population estimates, projections, and coverage team
[email protected]
04 931 4600
ISBN 978-1-991431-59-2
Next release
Subnational ethnic population projections: 2023(base)-2048 will be released on 11 December 2026.


