International trade statistics provide information on imports and exports of goods and services between New Zealand and our trading partners.
Key facts
Quarterly goods and services by country
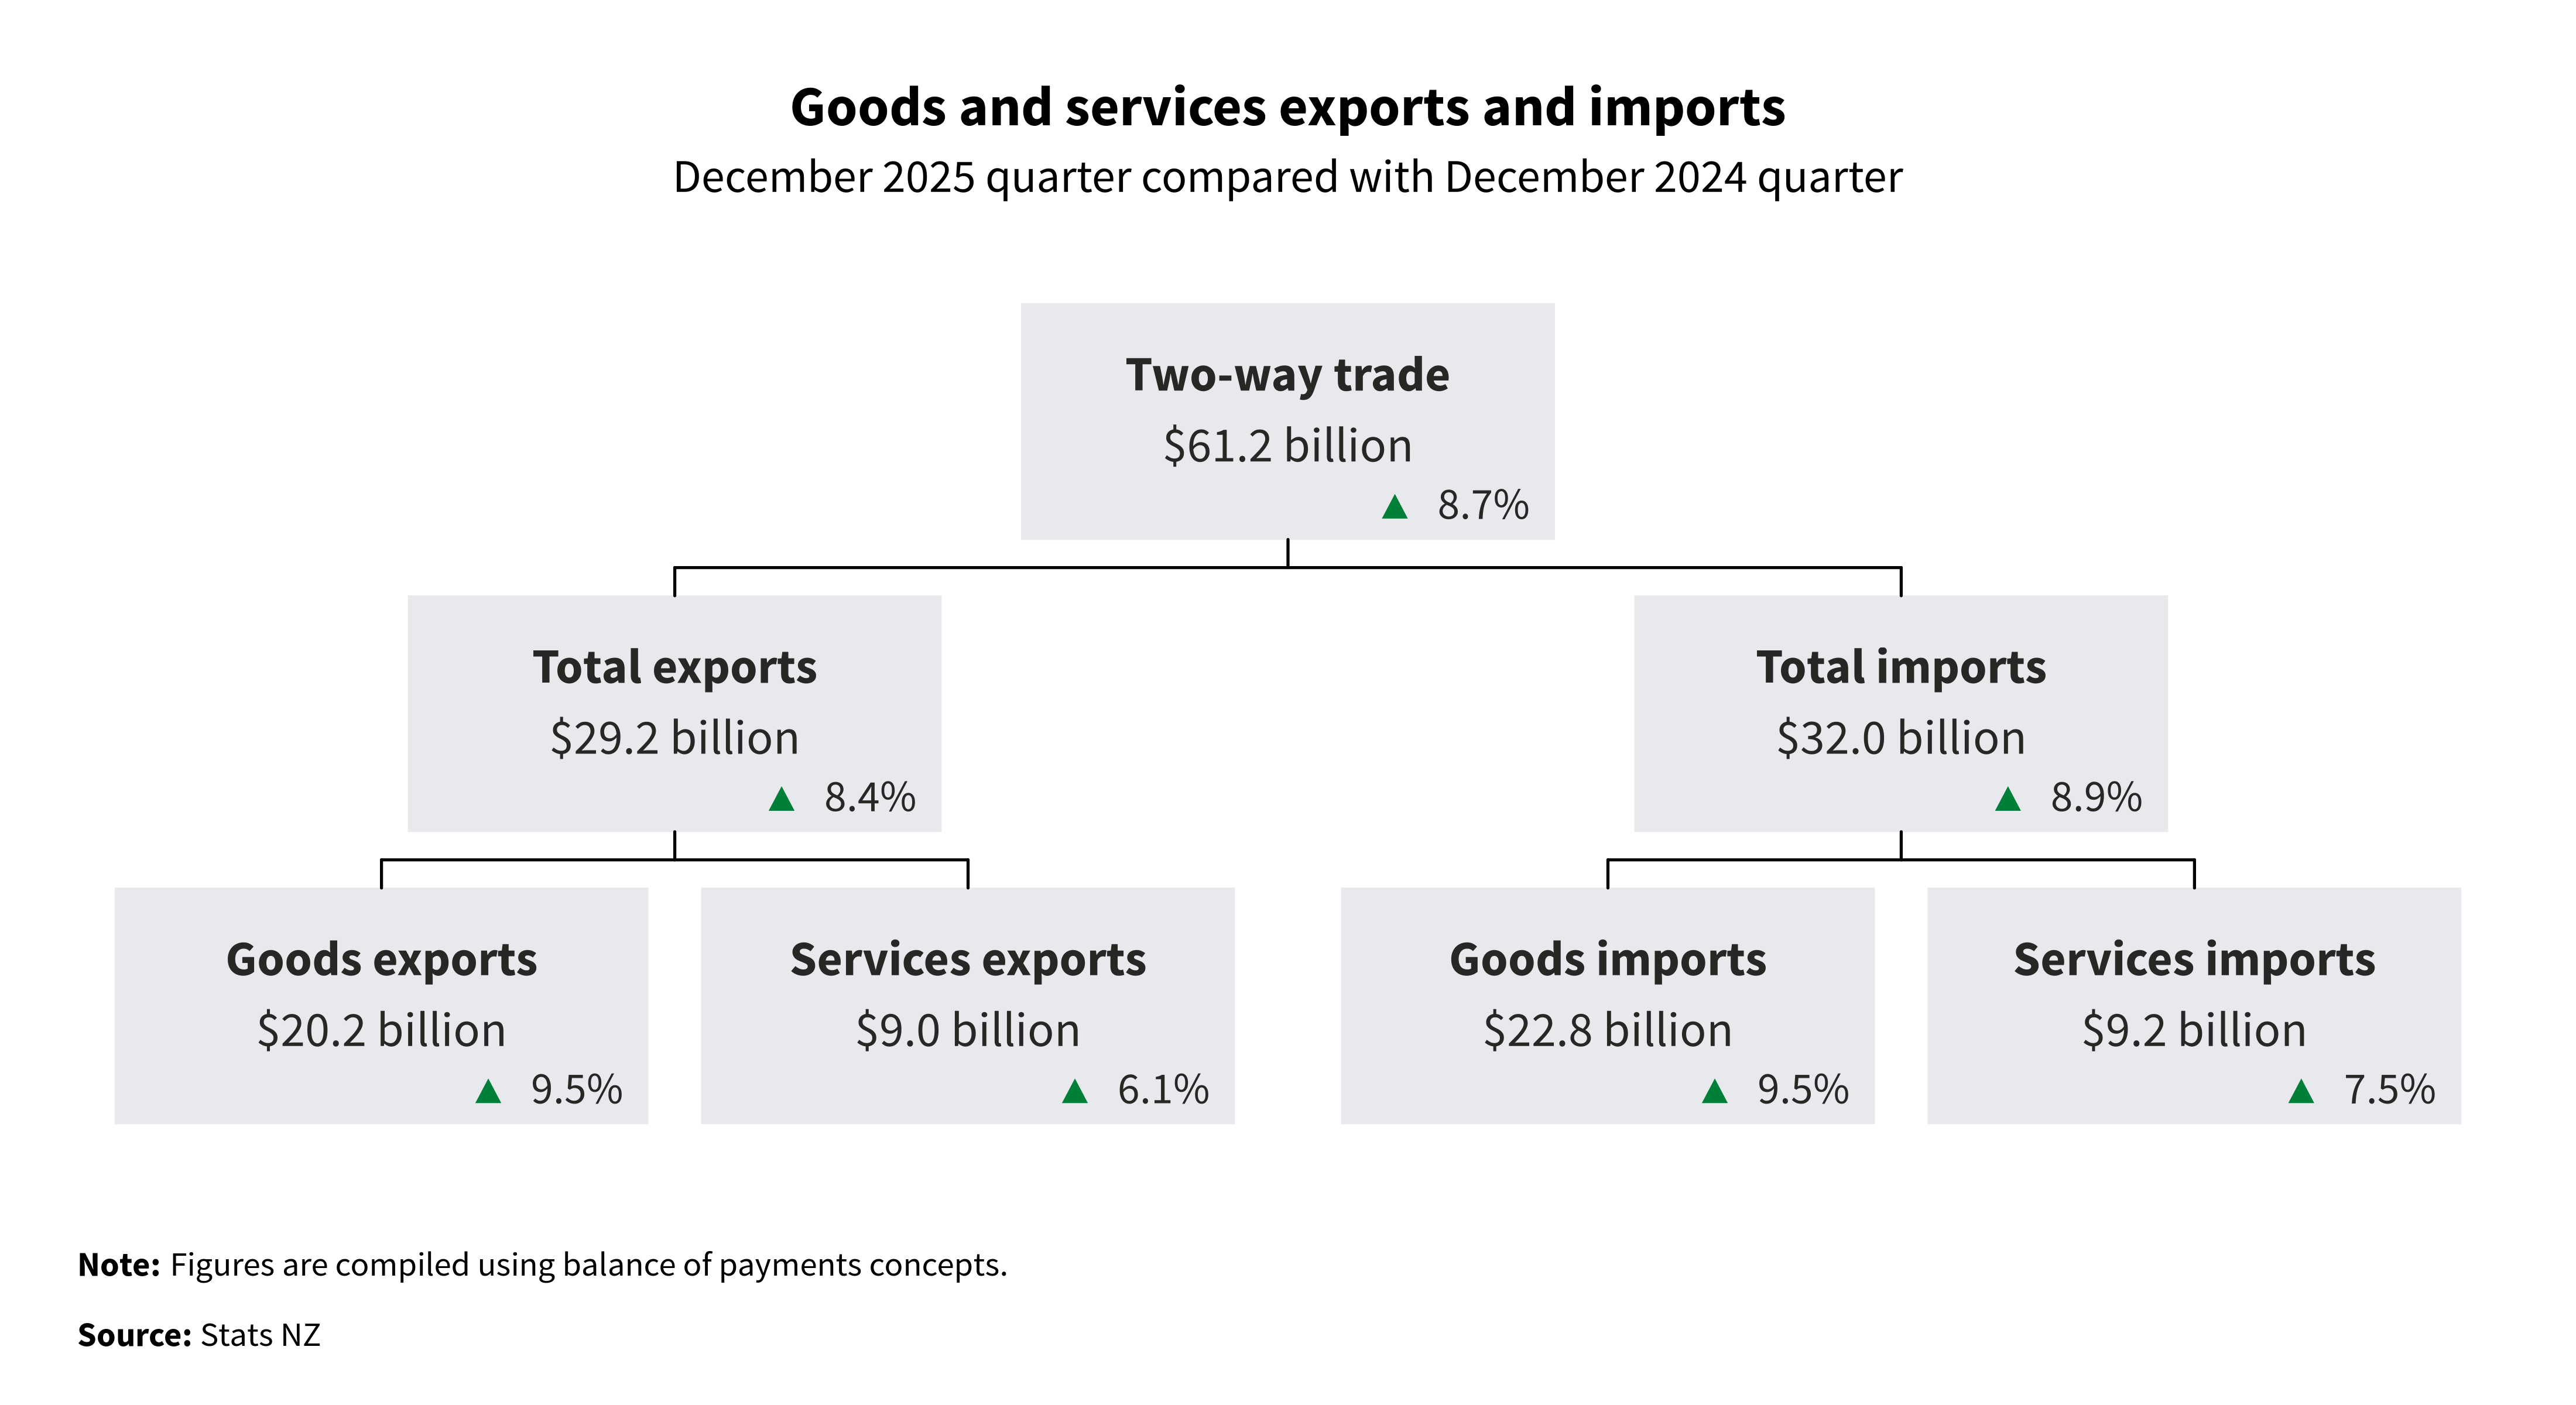
- Total exports of goods and services for the December 2025 quarter were $29.2 billion, up from $27.0 billion in the December 2024 quarter.
- Total imports of goods and services for the December 2025 quarter were $32.0 billion, up from $29.4 billion in the December 2024 quarter.
- The total two-way trade for the December 2025 quarter was $61.2 billion.
New Zealand international trade dashboard shows quarterly exports and imports data for goods and services by country and commodity type.
Total services exports rose $521 million to $9.0 billion in the December 2025 quarter compared with the December 2024 quarter.
The top movements of our services export categories in the December 2025 quarter compared with the December 2024 quarter were:
- travel services, up $395 million to $4.6 billion
- transportation services, up $80 million to $1.2 billion
- government services, up $17 million to $97 million
- charges for the use of intellectual property services, down $40 million to $428 million
- other business services, down $19 million to $1.0 billion.
Total services imports rose $641 million to $9.2 billion in the December 2025 quarter compared with the December 2024 quarter.
The top movements of our services import categories in the December 2025 quarter compared with the December 2024 quarter were:
- transportation services, up $152 million to $1.8 billion
- other business services, up $151 million to $1.8 billion
- telecommunication services, up $114 million to $1.3 billion
- travel services, up $104 million to $2.0 billion
- charges for the use of intellectual property services, up $30 million to $500 million.
Overseas trade indexes (OTI)
Movements are compared with the September 2025 quarter. All prices are unadjusted; all volumes and values are seasonally adjusted unless otherwise stated.
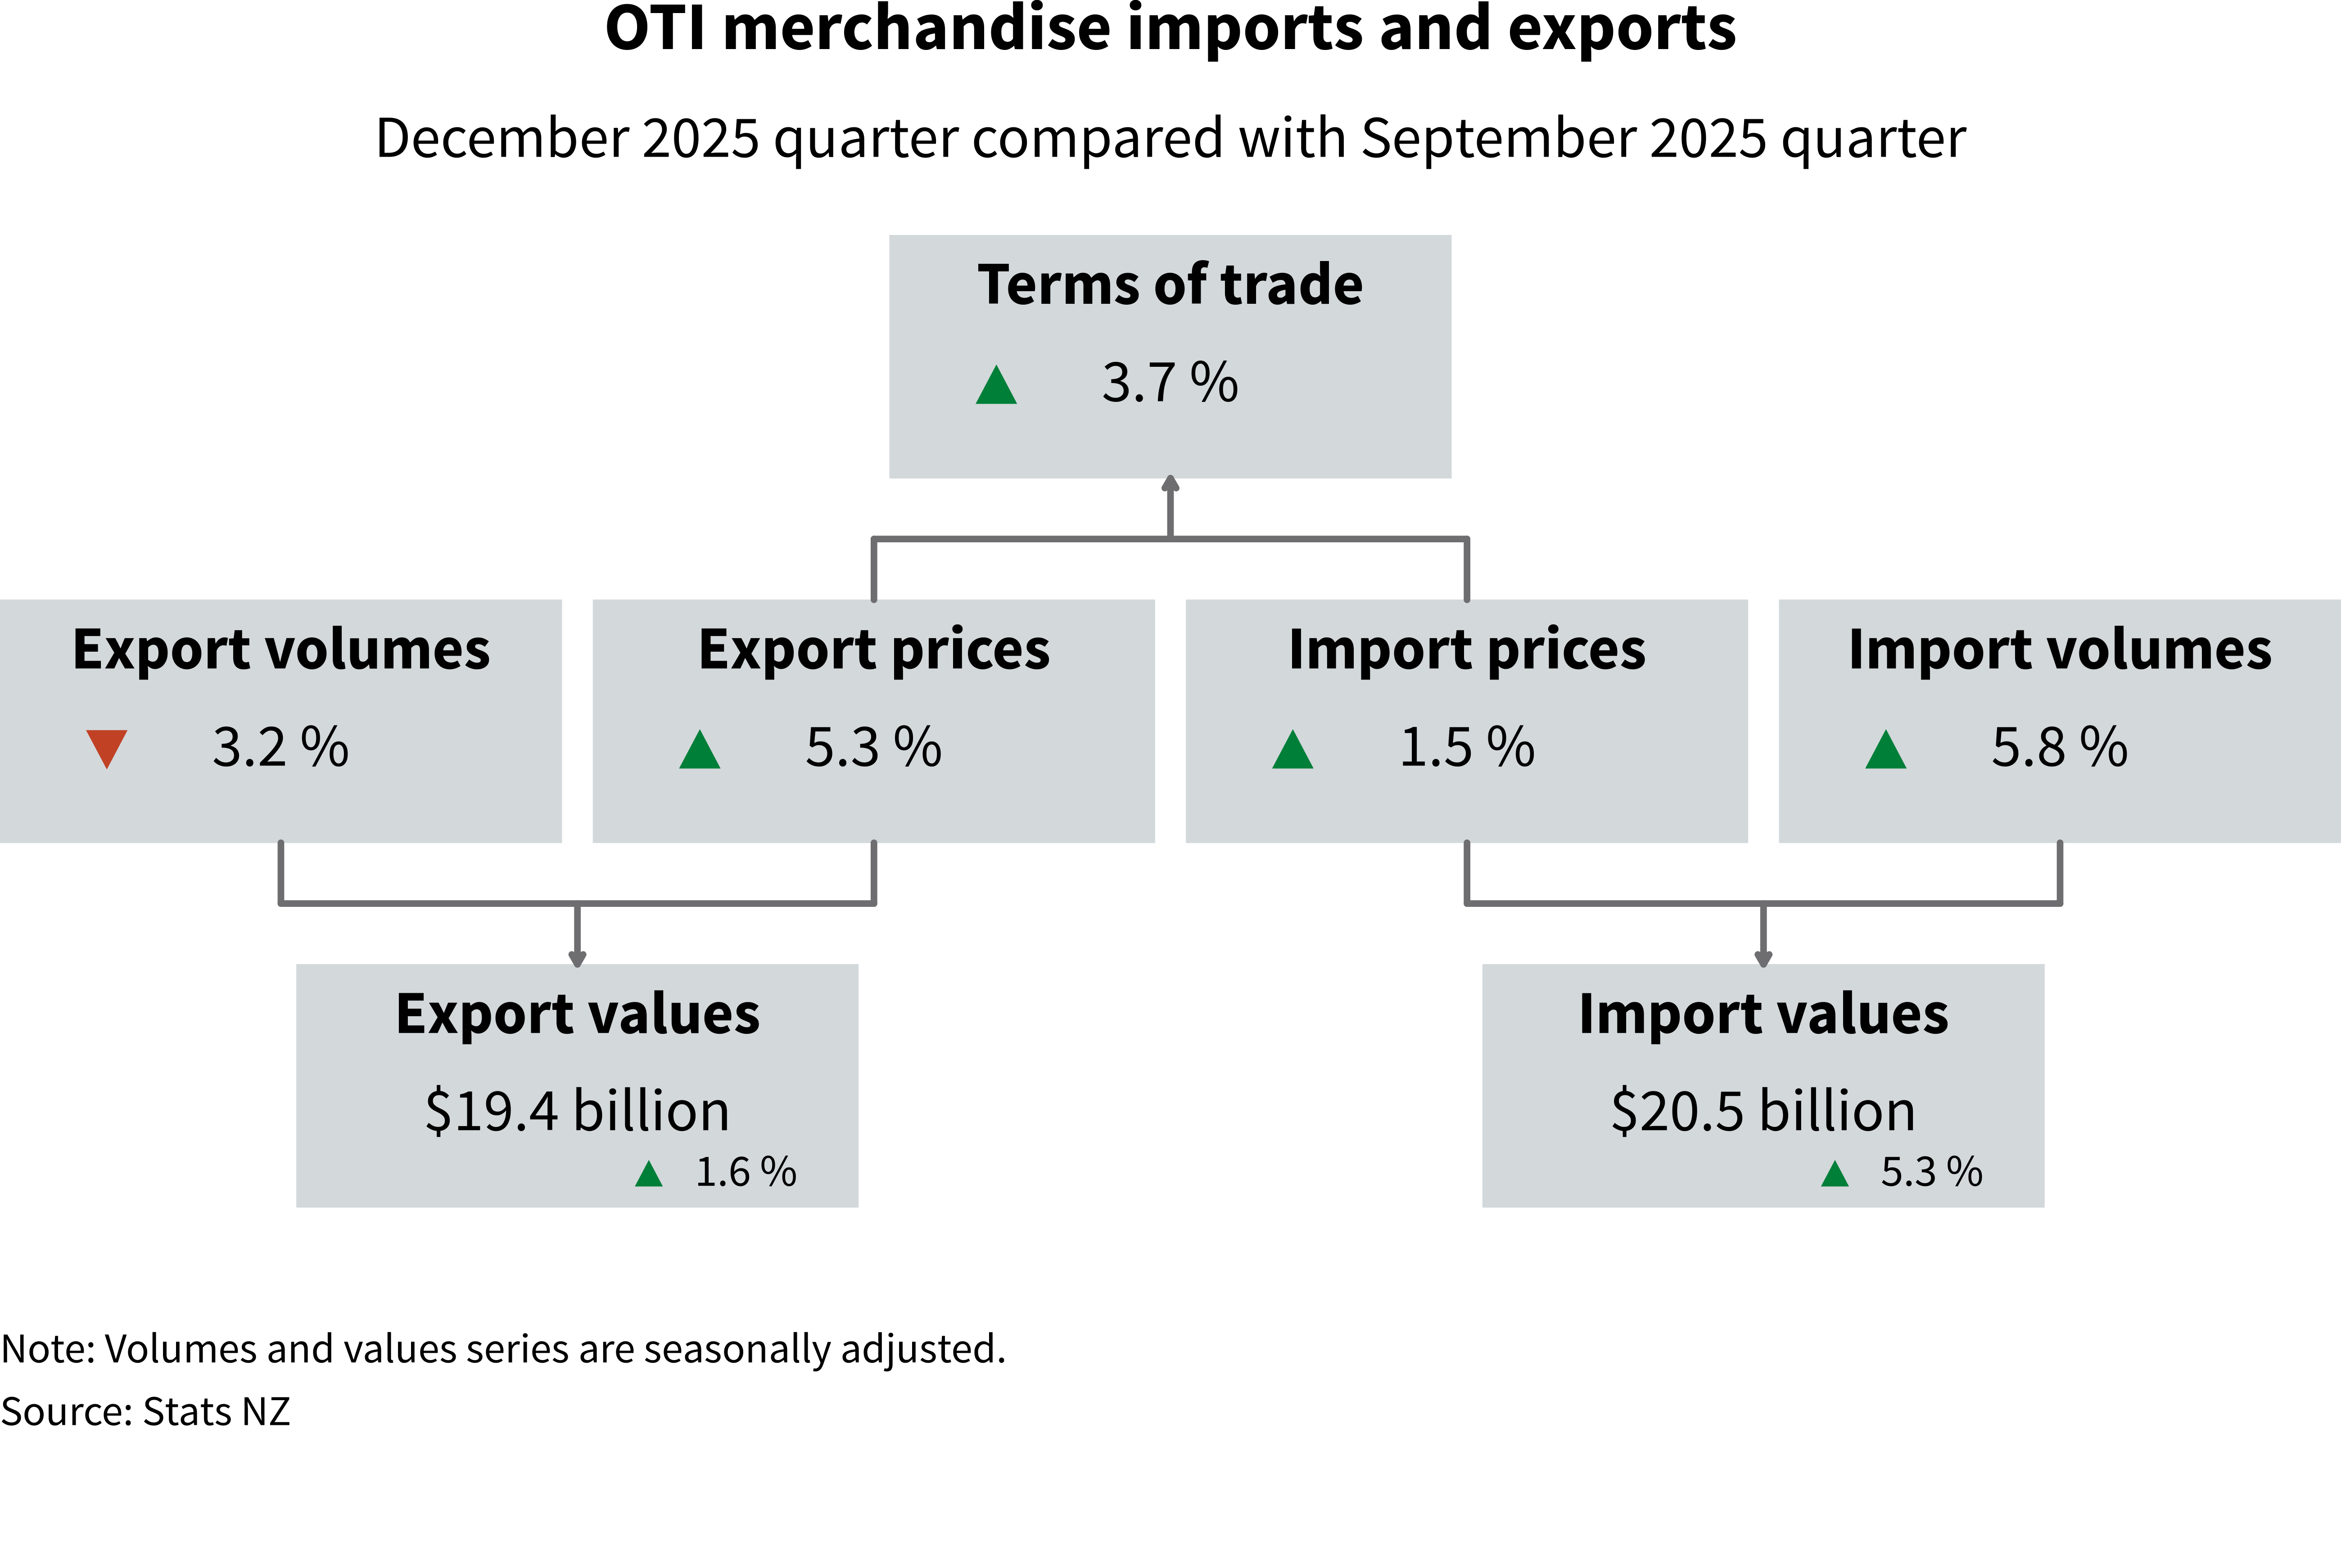
- The merchandise (goods) terms of trade rose 3.7 percent.
- Export prices for goods rose 5.3 percent and import prices rose 1.5 percent.
- Export volumes for goods fell 3.2 percent and import volumes rose 5.8 percent.
- Export values for goods rose 1.6 percent and import values rose 5.3 percent.
- The services terms of trade fell 3.5 percent.
- Services export prices rose 0.7 percent, while import prices rose 4.4 percent.
Text alternative for Goods and services exports and imports and imports, December 2025 quarter compared with December 2024 quarter
The diagram shows two-way trade was up 8.7 percent to $61.2 billion. On the left-hand side of the diagram, total exports were up 8.4 percent to $29.2 billion. Goods exports were up 9.5 percent to $20.2 billion, and services exports were up 6.1 percent to $9.0 billion. On the right-hand side of the diagram, total imports were up 8.9 percent to $32.0 billion. Goods imports were up 9.5 percent to $22.8 billion, and services imports were up 7.5 percent to $9.2 billion. Note: Figures are compiled using balance of payments concepts.
Text alternative for OTI merchandise imports and exports, December 2025 quarter compared with September 2025 quarter
The diagram shows the terms of trade rose 3.7 percent, where export prices rose 5.3 percent and import prices rose 1.5 percent. The value of exports rose 1.6 percent to $19.4 billion. Flowing into this were export volumes which fell 3.2 percent, and export prices which rose 5.3 percent. The value of imports rose 5.3 percent to $20.5 billion. Flowing into this were import volumes which rose 5.8 percent, and import prices which rose 1.5 percent.
Note: Volumes and values series are seasonally adjusted.
Source: Stats NZ.
More data
Use Infoshare to access time-series data.
Goods trade data
Subject category: Imports and exports
Group: Exports - summary data
Group: Imports - summary data
Group: Overseas trade statistics
Group: Re-exports - summary data
Overseas trade indexes
Subject category: Imports and exports
Group: Overseas trade indexes - prices - OTP
Group: Overseas trade indexes - volumes and values - OTV
Definitions and metadata
International trade statistics - DataInfo+ has metadata, methodologies, and definitions used in this release.
Technical enquiries (goods and services by country)
Shannon Garrick
[email protected]
04 931 4600
Technical enquiries (overseas trade indexes)
Henry Han
[email protected]
04 931 4600
ISSN 2703-6618
Next release
International trade: March 2026 quarter will be released on 3 June 2026.


