Labour market statistics provide a picture of the New Zealand labour market, including unemployment and employment rates, demand for labour, and changes in wages and salaries.
Key facts
In the June 2025 quarter, compared with the March 2025 quarter, the:
- unemployment rate was 5.2 percent, compared with 5.1 percent
- underutilisation rate was 12.8 percent, compared with 12.4 percent
- employment rate was 66.8 percent, compared with 67.1 percent.
In the year ended June 2025:
- all salary and wage rates (including overtime) increased 2.4 percent
- average weekly earnings (including overtime) for full-time equivalent employees (FTEs) increased to $1,679 from $1,612
- average ordinary time hourly earnings increased to $43.39 from $41.52.
Labour market measures |
June 2025 |
Quarterly |
Annual |
|
Employment at a glance (seasonally adjusted, HLFS) |
Percent |
Percentage points |
||
Unemployment rate |
5.2 |
0.1 |
0.5 |
|
Underutilisation rate |
12.8 |
0.4 |
0.9 |
|
Employment rate |
66.8 |
-0.2 |
-1.4 |
|
Labour force participation rate |
70.5 |
-0.2 |
-1.1 |
|
(000) |
Percent |
|||
Unemployed |
158 |
1.4 |
11.1 |
|
Underutilised |
403 |
3.3 |
7.7 |
|
Employed |
2882 |
-0.1 |
-0.9 |
|
Working-age population |
4312 |
0.3 |
1.2 |
|
Wages at a glance (not seasonally adjusted) |
Index |
Percent |
||
Wage inflation (salary and wage rates, including overtime, LCI) |
All sectors |
1431 |
0.6 |
2.4 |
Private sector |
1429 |
0.6 |
2.3 |
|
Public sector |
1449 |
0.4 |
2.8 |
|
LCI analytical unadjusted |
1752 |
0.9 |
3.6 |
|
Dollars |
Percent |
|||
Average ordinary time hourly earnings (QES) |
43.39 |
1.4 |
4.5 |
|
Hours at a glance (seasonally adjusted) |
Hours |
Percent |
||
Average weekly paid hours for FTEs (QES) |
Ordinary time |
38.06 |
-0.5 |
-0.3 |
Total |
38.64 |
-0.5 |
-0.3 |
|
Hours (millions) |
Percent |
|||
Total weekly paid hours (QES) |
73.6 |
-0.5 |
-1.7 |
|
Total actual weekly hours worked (HLFS) |
94.2 |
-1.0 |
-2.6 |
|
Note: LCI - labour cost index QES - Quarterly Employment Survey HLFS - Household Labour Force Survey FTEs - full-time equivalent employees Due to rounding, changes do not always sum to the published totals. |
||||
Unemployment
The seasonally adjusted unemployment rate was 5.2 percent in the June 2025 quarter, compared with 5.1 percent in the March 2025 quarter.
- For men, the unemployment rate was 5.0 percent, compared with 4.9 percent last quarter.
- For women, the unemployment rate was 5.5 percent, compared with 5.4 percent last quarter.
The seasonally adjusted number of unemployed people was 158,000, compared with 156,000 last quarter.
| Quarter | Men | Women | Total |
| Jun-11 | 6.0 | 6.1 | 6.1 |
| Sep-11 | 5.6 | 6.3 | 6.0 |
| Dec-11 | 6.1 | 6.0 | 6.1 |
| Mar-12 | 6.1 | 6.7 | 6.4 |
| Jun-12 | 6.2 | 6.7 | 6.4 |
| Sep-12 | 6.6 | 6.9 | 6.7 |
| Dec-12 | 6.0 | 6.7 | 6.3 |
| Mar-13 | 5.2 | 6.5 | 5.8 |
| Jun-13 | 5.5 | 6.5 | 6.0 |
| Sep-13 | 5.5 | 6.2 | 5.8 |
| Dec-13 | 5.0 | 6.4 | 5.7 |
| Mar-14 | 5.1 | 6.1 | 5.6 |
| Jun-14 | 4.6 | 6.0 | 5.3 |
| Sep-14 | 4.6 | 6.1 | 5.3 |
| Dec-14 | 4.8 | 6.3 | 5.5 |
| Mar-15 | 5.2 | 5.9 | 5.5 |
| Jun-15 | 4.8 | 6.3 | 5.5 |
| Sep-15 | 5.2 | 6.1 | 5.7 |
| Dec-15 | 4.7 | 5.3 | 5.0 |
| Mar-16 | 5.0 | 5.6 | 5.3 |
| Jun-16 | 4.7 | 5.5 | 5.1 |
| Sep-16 | 4.7 | 5.3 | 5.0 |
| Dec-16 | 4.8 | 5.8 | 5.3 |
| Mar-17 | 4.3 | 5.6 | 4.9 |
| Jun-17 | 4.8 | 5.0 | 4.9 |
| Sep-17 | 4.1 | 5.4 | 4.7 |
| Dec-17 | 4.0 | 5.0 | 4.5 |
| Mar-18 | 3.9 | 4.8 | 4.4 |
| Jun-18 | 4.4 | 4.9 | 4.6 |
| Sep-18 | 4.0 | 4.0 | 4.0 |
| Dec-18 | 4.4 | 4.2 | 4.3 |
| Mar-19 | 3.8 | 4.5 | 4.2 |
| Jun-19 | 3.7 | 4.4 | 4.1 |
| Sep-19 | 3.8 | 4.4 | 4.1 |
| Dec-19 | 3.9 | 4.3 | 4.1 |
| Mar-20 | 4.0 | 4.4 | 4.2 |
| Jun-20 | 3.6 | 4.6 | 4.1 |
| Sep-20 | 4.8 | 5.6 | 5.2 |
| Dec-20 | 4.5 | 5.4 | 4.9 |
| Mar-21 | 4.6 | 4.7 | 4.6 |
| Jun-21 | 3.8 | 4.2 | 4.0 |
| Sep-21 | 3.3 | 3.3 | 3.3 |
| Dec-21 | 3.1 | 3.4 | 3.2 |
| Mar-22 | 3.2 | 3.4 | 3.3 |
| Jun-22 | 3.1 | 3.6 | 3.3 |
| Sep-22 | 2.9 | 3.7 | 3.3 |
| Dec-22 | 3.3 | 3.5 | 3.4 |
| Mar-23 | 3.3 | 3.7 | 3.5 |
| Jun-23 | 3.4 | 3.9 | 3.7 |
| Sep-23 | 3.8 | 4.2 | 3.9 |
| Dec-23 | 3.8 | 4.3 | 4.0 |
| Mar-24 | 4.1 | 4.8 | 4.4 |
| Jun-24 | 4.6 | 4.8 | 4.7 |
| Sep-24 | 4.7 | 5.0 | 4.9 |
| Dec-24 | 5.0 | 5.3 | 5.1 |
| Mar-25 | 4.9 | 5.4 | 5.1 |
| Jun-25 | 5.0 | 5.5 | 5.2 |
Underutilisation
The seasonally adjusted underutilisation rate was 12.8 percent in the June 2025 quarter, compared with 12.4 percent in the March 2025 quarter.
- For men, the underutilisation rate was 11.0 percent, compared with 10.5 percent last quarter.
- For women, the underutilisation rate was 14.7 percent, compared with 14.5 percent last quarter.
| Quarter | Men | Women | Total |
| Jun-11 | 12.1 | 16.3 | 14.1 |
| Sep-11 | 11.1 | 16.4 | 13.6 |
| Dec-11 | 12.1 | 15.5 | 13.7 |
| Mar-12 | 11.7 | 16.8 | 14.1 |
| Jun-12 | 11.9 | 17.8 | 14.7 |
| Sep-12 | 13.5 | 17.7 | 15.6 |
| Dec-12 | 12.4 | 17.3 | 14.7 |
| Mar-13 | 10.4 | 15.9 | 13.0 |
| Jun-13 | 10.6 | 16.2 | 13.3 |
| Sep-13 | 11.1 | 17.3 | 14.1 |
| Dec-13 | 11.1 | 17.1 | 14.0 |
| Mar-14 | 10.9 | 15.8 | 13.2 |
| Jun-14 | 10.5 | 16.4 | 13.3 |
| Sep-14 | 10.2 | 15.6 | 12.8 |
| Dec-14 | 10.5 | 16.4 | 13.3 |
| Mar-15 | 10.8 | 16.6 | 13.6 |
| Jun-15 | 10.6 | 16.9 | 13.6 |
| Sep-15 | 11.2 | 16.5 | 13.7 |
| Dec-15 | 10.1 | 15.0 | 12.5 |
| Mar-16 | 11.2 | 16.3 | 13.7 |
| Jun-16 | 10.5 | 15.9 | 13.1 |
| Sep-16 | 10.0 | 15.6 | 12.7 |
| Dec-16 | 9.7 | 15.4 | 12.4 |
| Mar-17 | 9.3 | 15.5 | 12.3 |
| Jun-17 | 9.5 | 14.7 | 12.0 |
| Sep-17 | 9.3 | 15.2 | 12.1 |
| Dec-17 | 9.4 | 15.3 | 12.2 |
| Mar-18 | 9.5 | 14.6 | 11.9 |
| Jun-18 | 9.9 | 14.5 | 12.1 |
| Sep-18 | 9.3 | 13.6 | 11.3 |
| Dec-18 | 10.0 | 14.6 | 12.2 |
| Mar-19 | 9.0 | 13.9 | 11.3 |
| Jun-19 | 9.2 | 13.2 | 11.1 |
| Sep-19 | 8.4 | 12.5 | 10.3 |
| Dec-19 | 8.4 | 12.0 | 10.1 |
| Mar-20 | 8.3 | 12.8 | 10.4 |
| Jun-20 | 9.4 | 15.0 | 12.1 |
| Sep-20 | 10.6 | 15.9 | 13.1 |
| Dec-20 | 9.7 | 14.4 | 11.9 |
| Mar-21 | 9.9 | 14.6 | 12.2 |
| Jun-21 | 8.3 | 13.0 | 10.5 |
| Sep-21 | 7.7 | 10.8 | 9.2 |
| Dec-21 | 7.4 | 11.2 | 9.3 |
| Mar-22 | 7.8 | 11.2 | 9.4 |
| Jun-22 | 7.5 | 11.2 | 9.3 |
| Sep-22 | 7.3 | 10.9 | 9.0 |
| Dec-22 | 7.6 | 11.5 | 9.4 |
| Mar-23 | 7.5 | 10.9 | 9.1 |
| Jun-23 | 8.2 | 11.9 | 10.0 |
| Sep-23 | 8.7 | 12.5 | 10.5 |
| Dec-23 | 8.7 | 13.1 | 10.8 |
| Mar-24 | 9.4 | 13.4 | 11.3 |
| Jun-24 | 10.0 | 13.8 | 11.9 |
| Sep-24 | 10.3 | 13.2 | 11.7 |
| Dec-24 | 10.7 | 13.9 | 12.2 |
| Mar-25 | 10.5 | 14.5 | 12.4 |
| Jun-25 | 11.0 | 14.7 | 12.8 |
Underutilisation is a broad measure of untapped labour market capacity that includes unemployed and underemployed people, along with the potential labour force.
In the June 2025 quarter, the number of underutilised people was 403,000, compared with 390,000 the previous quarter. The total for the June 2025 quarter consisted of 222,000 women and 181,000 men.
Text alternative for diagram Total underutilisation, June 2025 quarter, seasonally adjusted
Employment
The seasonally adjusted employment rate was 66.8 percent in the June 2025 quarter, compared with 67.1 percent in the March 2025 quarter.
- For men, the employment rate was 71.0 percent, compared with 71.3 percent last quarter.
- For women, the employment rate was 62.8 percent, compared with 63.0 percent last quarter.
| Quarter | Men | Women | Total |
| Jun-11 | 69.7 | 58.4 | 63.8 |
| Sep-11 | 70.1 | 58.0 | 63.9 |
| Dec-11 | 69.6 | 58.1 | 63.7 |
| Mar-12 | 69.8 | 58.1 | 63.7 |
| Jun-12 | 69.2 | 58.4 | 63.6 |
| Sep-12 | 68.7 | 58.3 | 63.3 |
| Dec-12 | 68.7 | 58.1 | 63.3 |
| Mar-13 | 68.9 | 58.1 | 63.3 |
| Jun-13 | 69.1 | 58.1 | 63.4 |
| Sep-13 | 69.9 | 58.8 | 64.1 |
| Dec-13 | 70.4 | 58.8 | 64.4 |
| Mar-14 | 70.6 | 59.3 | 64.8 |
| Jun-14 | 70.8 | 58.9 | 64.7 |
| Sep-14 | 70.6 | 59.6 | 64.9 |
| Dec-14 | 71.0 | 60.2 | 65.5 |
| Mar-15 | 71.2 | 60.2 | 65.5 |
| Jun-15 | 71.1 | 59.7 | 65.3 |
| Sep-15 | 70.1 | 59.2 | 64.5 |
| Dec-15 | 70.5 | 59.6 | 64.9 |
| Mar-16 | 70.7 | 60.2 | 65.3 |
| Jun-16 | 71.9 | 61.2 | 66.5 |
| Sep-16 | 72.4 | 61.1 | 66.6 |
| Dec-16 | 72.5 | 61.7 | 67.0 |
| Mar-17 | 73.2 | 61.8 | 67.4 |
| Jun-17 | 72.7 | 61.5 | 67.0 |
| Sep-17 | 73.5 | 62.4 | 67.8 |
| Dec-17 | 73.5 | 62.6 | 68.0 |
| Mar-18 | 73.4 | 62.8 | 68.0 |
| Jun-18 | 73.1 | 62.9 | 67.9 |
| Sep-18 | 73.2 | 63.4 | 68.2 |
| Dec-18 | 72.7 | 63.2 | 67.8 |
| Mar-19 | 72.5 | 62.9 | 67.6 |
| Jun-19 | 72.5 | 63.1 | 67.8 |
| Sep-19 | 72.6 | 63.0 | 67.7 |
| Dec-19 | 72.5 | 62.7 | 67.5 |
| Mar-20 | 72.8 | 62.8 | 67.7 |
| Jun-20 | 72.4 | 62.1 | 67.2 |
| Sep-20 | 71.8 | 61.2 | 66.4 |
| Dec-20 | 72.0 | 61.6 | 66.7 |
| Mar-21 | 72.1 | 62.3 | 67.2 |
| Jun-21 | 72.7 | 62.9 | 67.8 |
| Sep-21 | 73.1 | 64.5 | 68.8 |
| Dec-21 | 73.2 | 64.4 | 68.8 |
| Mar-22 | 73.3 | 64.2 | 68.6 |
| Jun-22 | 73.0 | 64.2 | 68.5 |
| Sep-22 | 73.8 | 64.9 | 69.3 |
| Dec-22 | 74.0 | 64.9 | 69.4 |
| Mar-23 | 74.1 | 65.3 | 69.6 |
| Jun-23 | 74.3 | 65.3 | 69.8 |
| Sep-23 | 73.9 | 64.5 | 69.1 |
| Dec-23 | 73.6 | 64.4 | 69.0 |
| Mar-24 | 72.7 | 64.0 | 68.3 |
| Jun-24 | 72.5 | 64.1 | 68.3 |
| Sep-24 | 71.7 | 63.6 | 67.6 |
| Dec-24 | 71.3 | 63.2 | 67.2 |
| Mar-25 | 71.3 | 63.0 | 67.1 |
| Jun-25 | 71.0 | 62.8 | 66.8 |
In the June 2025 quarter, the seasonally adjusted number of employed people was 2,882,000, compared with 2,909,000 in the June 2024 quarter.
Three regions experienced significant decreases in employment (not seasonally adjusted) over the year. Employment in the:
- Auckland region decreased by 23,100 to 984,900
- Waikato region decreased by 11,100 to 262,900
- Taranaki region decreased by 5,200 to 65,300.
Employment levels in Otago increased by 8,700 to 154,700.
Labour force participation
The seasonally adjusted labour force participation rate was 70.5 percent in the June 2025 quarter, compared with 70.7 percent in the March 2025 quarter.
- For men, the labour force participation rate was 74.7 percent, compared with 75.0 percent last quarter.
- For women, the labour force participation rate was 66.5 percent, compared with 66.6 percent last quarter.
There were 1,271,000 people not in the labour force (NILF) this quarter, compared with 1,258,000 last quarter.
Youth not in employment, education, or training (NEET)
In the June 2025 quarter, the seasonally adjusted proportion of people aged 15 to 24 years who were not in employment, education, or training (NEET) was 12.9 percent, unchanged from the March 2025 quarter.
- The NEET rate for young men was 12.3 percent, compared with 12.1 percent last quarter.
- The NEET rate for young women was 13.5 percent, compared with 13.7 percent last quarter.
Disability
In the June 2025 quarter, for people aged 15 to 64 years, the:
- labour force participation rate for disabled people was 44.4 percent, compared with 82.8 percent for non-disabled people
- employment rate for disabled people was 38.2 percent, compared with 78.5 percent for non-disabled people
- unemployment rate for disabled people was 14.1 percent, compared with 5.2 percent for non-disabled people
- underutilisation rate for disabled people was 24.4 percent, compared with 12.6 percent for non-disabled people.
Between the June 2024 and 2025 quarters, none of the headline rates for disabled people aged 15 to 64 years changed significantly.
Labour market statistics: June 2025 quarter - CSV, available under 'Download data', now includes labour market data for disabled people by sex and age. We will continue to include this data in future June-quarter labour market and income releases.
Wages
The labour cost index (LCI) all salary and wage rates (including overtime) increased 2.4 percent in the year ended June 2025, while the unadjusted LCI increased 3.6 percent.
- Private sector wages increased 2.3 percent over the year.
- Public sector wages increased 2.8 percent over the year.
The LCI is often compared with the consumers price index (CPI) to see how wage inflation compares with consumer inflation (the change in prices of goods and services bought by households). Annual CPI inflation was 2.7 percent in the year ended June 2025.
| Quarter | LCI - all salary and wage rates | CPI - all groups |
| Jun-05 | 2.7 | 2.8 |
| Sep-05 | 3.1 | 3.4 |
| Dec-05 | 3.0 | 3.2 |
| Mar-06 | 3.2 | 3.3 |
| Jun-06 | 3.1 | 4 |
| Sep-06 | 3.2 | 3.5 |
| Dec-06 | 3.2 | 2.6 |
| Mar-07 | 3.2 | 2.5 |
| Jun-07 | 3.3 | 2 |
| Sep-07 | 3.1 | 1.8 |
| Dec-07 | 3.3 | 3.2 |
| Mar-08 | 3.4 | 3.4 |
| Jun-08 | 3.6 | 4 |
| Sep-08 | 4.0 | 5.1 |
| Dec-08 | 3.5 | 3.4 |
| Mar-09 | 3.3 | 3 |
| Jun-09 | 2.8 | 1.9 |
| Sep-09 | 2.1 | 1.7 |
| Dec-09 | 1.8 | 2 |
| Mar-10 | 1.5 | 2 |
| Jun-10 | 1.6 | 1.7 |
| Sep-10 | 1.6 | 1.5 |
| Dec-10 | 1.7 | 4 |
| Mar-11 | 1.9 | 4.5 |
| Jun-11 | 1.9 | 5.3 |
| Sep-11 | 2.0 | 4.6 |
| Dec-11 | 2.0 | 1.8 |
| Mar-12 | 2.0 | 1.6 |
| Jun-12 | 2.0 | 1 |
| Sep-12 | 1.9 | 0.8 |
| Dec-12 | 1.8 | 0.9 |
| Mar-13 | 1.7 | 0.9 |
| Jun-13 | 1.7 | 0.7 |
| Sep-13 | 1.7 | 1.4 |
| Dec-13 | 1.6 | 1.6 |
| Mar-14 | 1.6 | 1.5 |
| Jun-14 | 1.7 | 1.6 |
| Sep-14 | 1.6 | 1 |
| Dec-14 | 1.8 | 0.8 |
| Mar-15 | 1.7 | 0.3 |
| Jun-15 | 1.6 | 0.4 |
| Sep-15 | 1.6 | 0.4 |
| Dec-15 | 1.5 | 0.1 |
| Mar-16 | 1.6 | 0.4 |
| Jun-16 | 1.5 | 0.4 |
| Sep-16 | 1.6 | 0.4 |
| Dec-16 | 1.6 | 1.3 |
| Mar-17 | 1.6 | 2.2 |
| Jun-17 | 1.7 | 1.7 |
| Sep-17 | 1.9 | 1.9 |
| Dec-17 | 1.8 | 1.6 |
| Mar-18 | 1.8 | 1.1 |
| Jun-18 | 1.9 | 1.5 |
| Sep-18 | 1.8 | 1.9 |
| Dec-18 | 1.9 | 1.9 |
| Mar-19 | 2.0 | 1.5 |
| Jun-19 | 2.1 | 1.7 |
| Sep-19 | 2.4 | 1.5 |
| Dec-19 | 2.6 | 1.9 |
| Mar-20 | 2.5 | 2.5 |
| Jun-20 | 2.1 | 1.5 |
| Sep-20 | 1.9 | 1.4 |
| Dec-20 | 1.6 | 1.4 |
| Mar-21 | 1.6 | 1.5 |
| Jun-21 | 2.1 | 3.3 |
| Sep-21 | 2.4 | 4.9 |
| Dec-21 | 2.6 | 5.9 |
| Mar-22 | 3.0 | 6.9 |
| Jun-22 | 3.4 | 7.3 |
| Sep-22 | 3.7 | 7.2 |
| Dec-22 | 4.1 | 7.2 |
| Mar-23 | 4.3 | 6.7 |
| Jun-23 | 4.3 | 6 |
| Sep-23 | 4.3 | 5.6 |
| Dec-23 | 4.3 | 4.7 |
| Mar-24 | 4.1 | 4 |
| Jun-24 | 4.3 | 3.3 |
| Sep-24 | 3.8 | 2.2 |
| Dec-24 | 3.3 | 2.2 |
| Mar-25 | 2.9 | 2.5 |
| Jun-25 | 2.4 | 2.7 |
In the year ended June 2025, wages as measured by the Quarterly Employment Survey (QES) also grew. Average ordinary time hourly earnings increased to $43.39 (up 4.5 percent).
- Private sector average ordinary time hourly earnings increased 4.6 percent, to $41.21.
- Public sector average ordinary time hourly earnings increased 3.8 percent, to $51.44.
Average weekly earnings (including overtime) for full-time equivalent employees (FTEs) in the QES also increased over the year - up 4.1 percent to $1,679.
- Private sector average weekly earnings increased 4.2 percent, to $1,592.
- Public sector average weekly earnings increased 3.6 percent, to $2,003.
Household Labour Force Survey population rebase from 2023 estimated resident population
The Household Labour Force Survey (HLFS) has been revised using the 2023 national population estimates. This impacts previously published HLFS data between the September 2018 and March 2025 quarters, meaning that values for these quarters may differ from what has been published in previous releases.
Household Labour Force Survey population rebase from 2023 estimated resident population has more information about this process and the impacts on the data series.
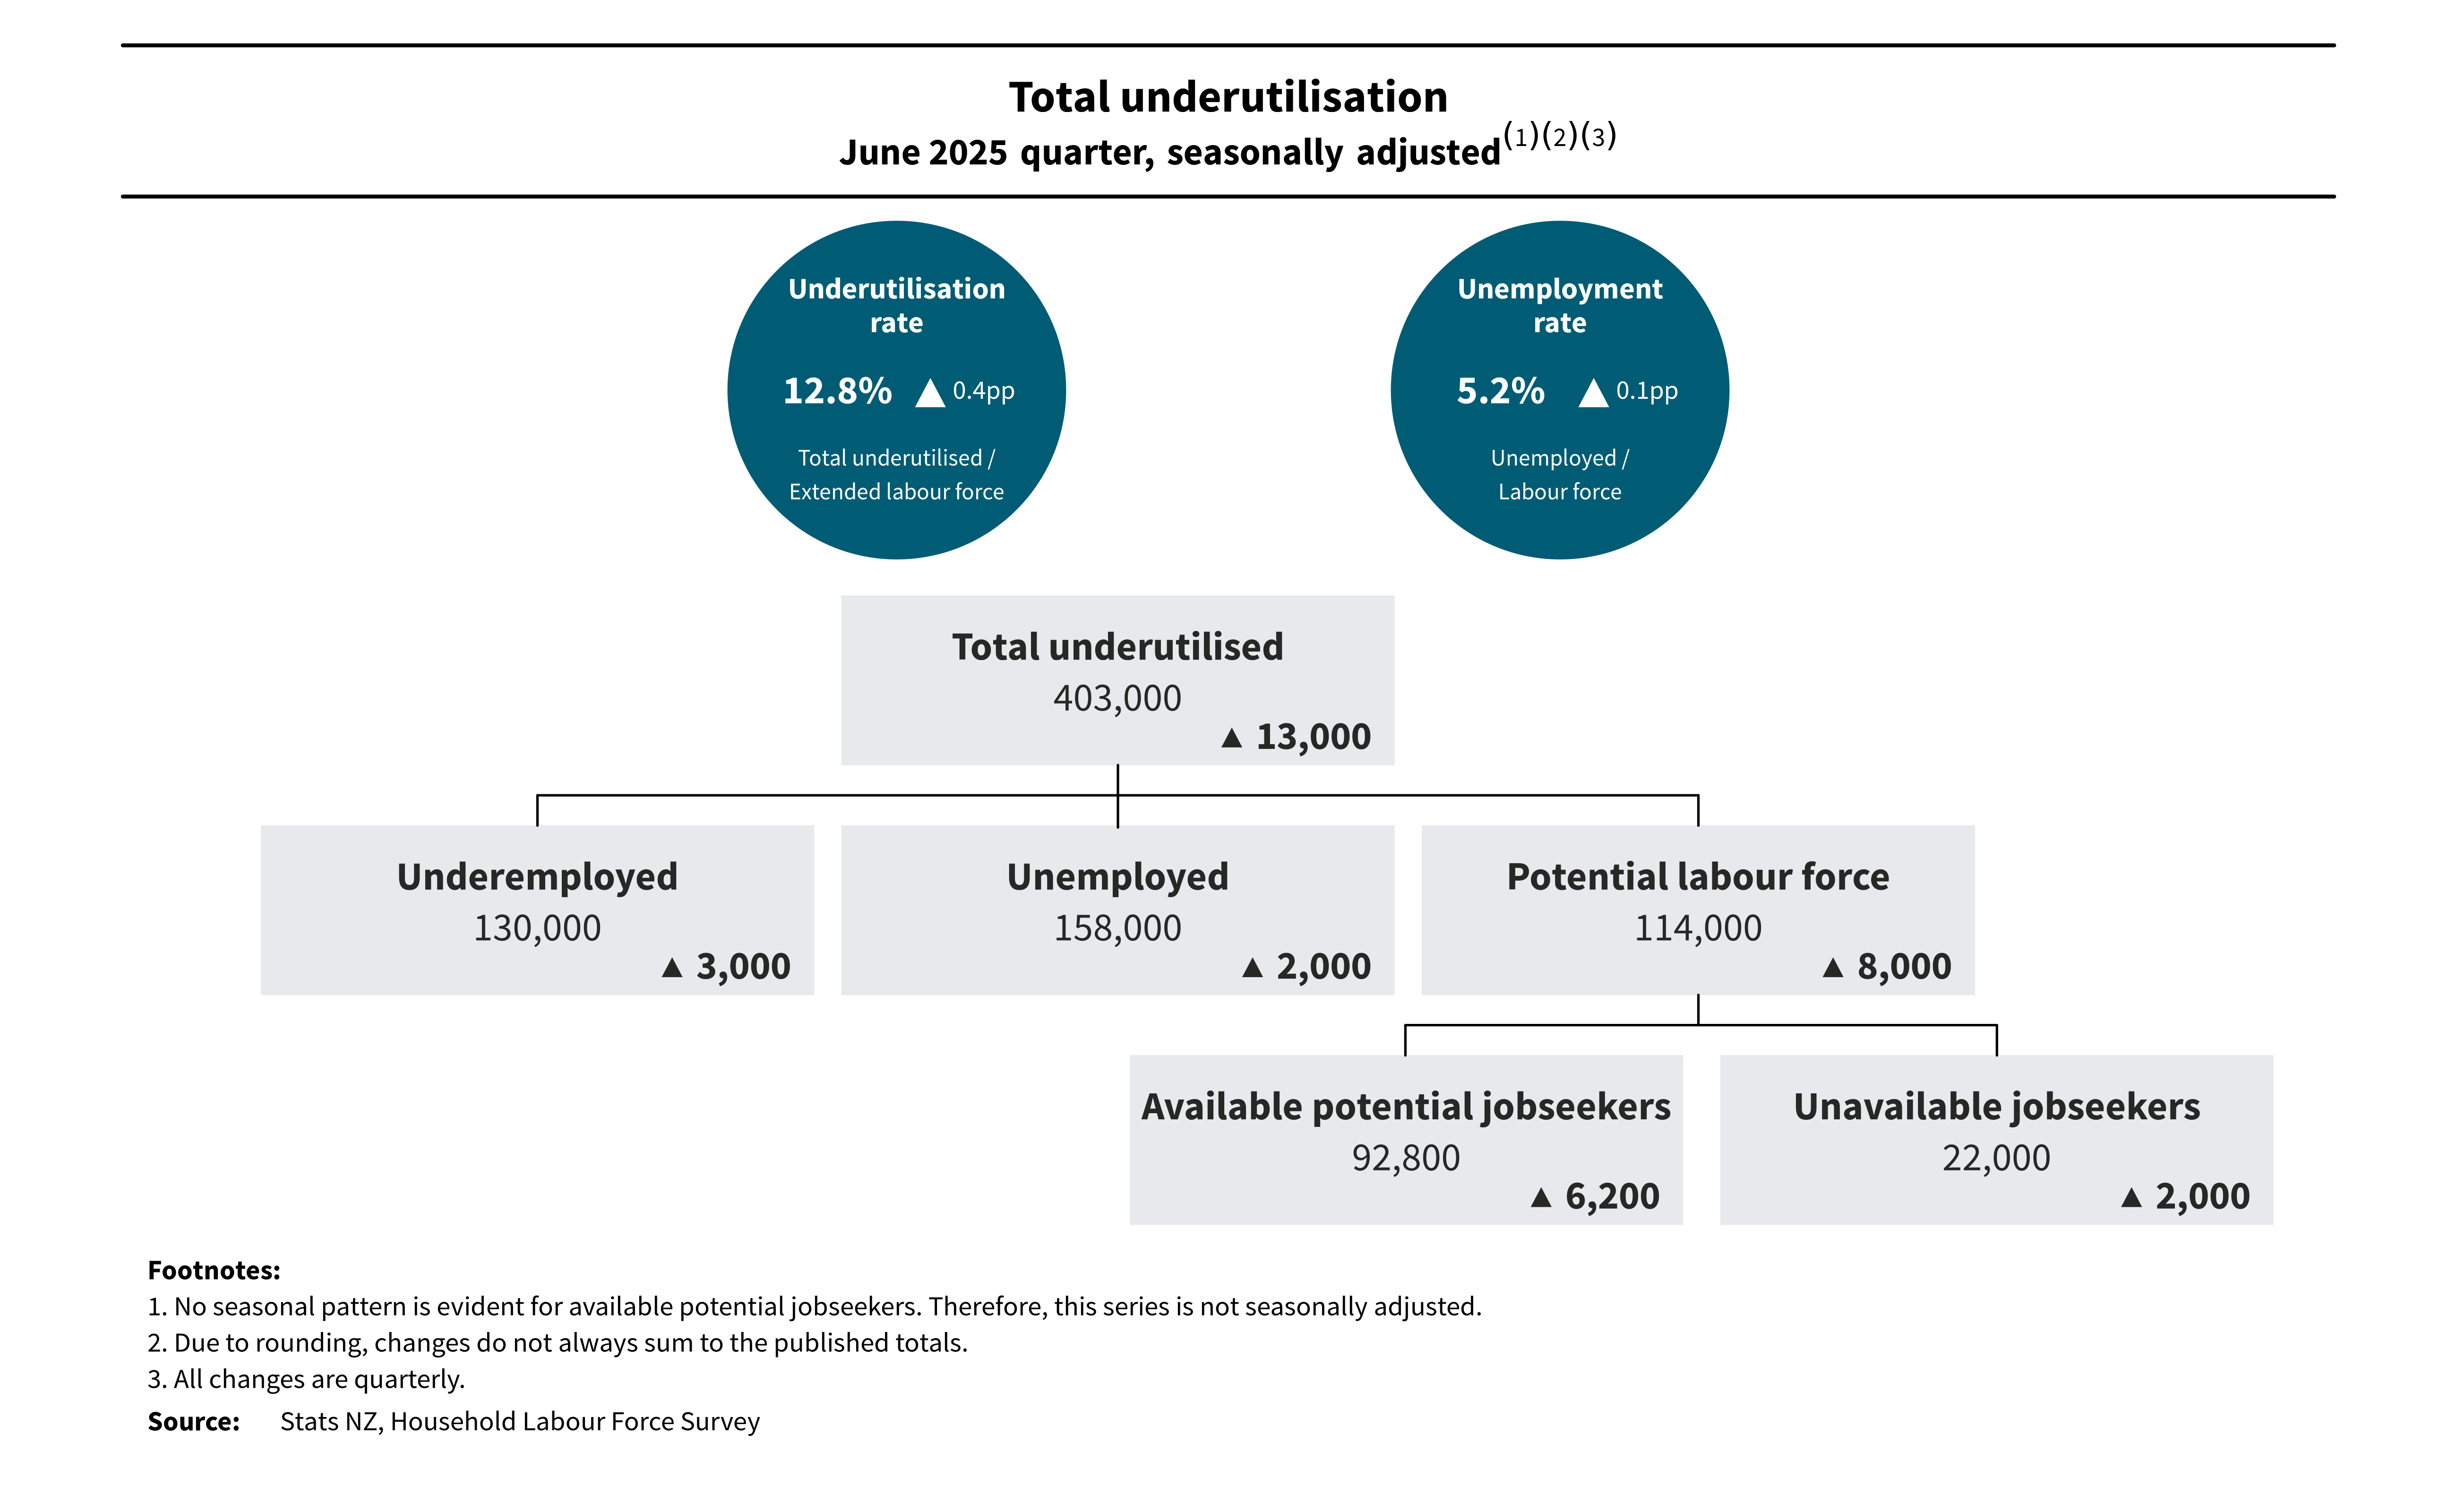
Text alternative for diagram Total underutilisation, June 2025 quarter, seasonally adjusted
Diagram shows data from the June 2025 quarter Household Labour Force Survey (HLFS).
The underutilisation rate was up 0.4pp (percentage points), to 12.8 percent. This rate is derived from the number of total underutilised divided by the extended labour force. The unemployment rate was up 0.1pp, to 5.2 percent. This is derived from the number of unemployed divided by the labour force.
The number of total underutilised people was up 13,000, to 403,000. The number of underemployed was up 3,000, to 130,000, while the number of unemployed was up 2,000, to 158,000. The potential labour force was up 8,000, to 114,000.
Within the potential labour force, the number of available potential jobseekers was up 6,200, to 92,800, and the number of unavailable jobseekers was up 2,000, to 22,000.
Notes:
- No seasonal pattern is evident for available potential jobseekers. Therefore, this series is not seasonally adjusted.
- Due to rounding, changes do not always sum to the published totals.
- All changes are quarterly.
Source: Stats NZ, Household Labour Force Survey
Data quality
Sample rotation in the Quarterly Employment Survey
In the June 2025 quarter, the QES sample was rotated for the following industries:
- retail trade
- other services.
Due to the rotation, the sampling error for quarterly movements in these industries is higher than in previous quarters. Movements in these industries should be interpreted alongside the accompanying sampling error information.
Labour market statistics: June 2025 quarter - Period-specific information - DataInfo+ has more detail on the impact of sample rotation and declining response rates on data quality.
We recommend that customers use the Quarterly Employment Survey primarily for estimates of average hours and earnings. Customers should instead rely on monthly Employment indicators or Business employment data for job measures.
More data
Use Infoshare to access the labour market time series.
Subject category: Work income and spending
Group: Household labour force survey - HLF
Group: Quarterly employment survey - QEM
Group: Labour cost index - LCI
Definitions and metadata
Labour market statistics: June 2025 quarter - Period-specific information - DataInfo+ includes data-quality notes for the June 2025 quarter, including response and achieved sample rates.
Labour market statistics - DataInfo+ gives general methodology used to produce this release, and related metadata.
Household Labour Force Survey - DataInfo+ gives general methodology used to produce Household Labour Force Survey statistics, and related metadata.
Labour cost index - DataInfo+ gives general methodology used to produce labour cost index statistics, and related metadata.
Quarterly Employment Survey - DataInfo+ gives general methodology used to produce Quarterly Employment Survey statistics, and related metadata.
Technical enquiries
Labour Market Statistics unit
[email protected]
ISSN 2422-8699
Next releases
Labour market statistics (income): June 2025 quarter will be released on 27 August 2025.
Labour market statistics: September 2025 quarter will be released on 5 November 2025.


