The average size of Māori farms was almost three times larger than the average size of all farms in Aotearoa New Zealand in 2022, according to figures released by Stats NZ today.
He nui noa ake te rahi o ngā pāmu Māori i tō te rahi toharite is this story in te reo Māori.
The greater average size of Māori farms was driven by a higher proportion of larger farms, with 16 percent of all Māori farms being larger than 1,000 hectares, compared with 5 percent for all New Zealand farms.
"Māori authorities manage collectively owned farms, which tend to be larger than average New Zealand farms. Almost half of Māori farms are owned and operated by Māori authorities," tatauranga umanga Māori manager Geraldine Duoba said.
| Farm size (hectares) | All New Zealand farms | Māori farms |
| Under 100 | 58.2 | 46.2 |
| 100 to 399 | 28.1 | 27.3 |
| 400 to 999 | 9.2 | 10.8 |
| "1 | 4.5 | 16.2 |
| 000 and over" |
"In addition to larger farm sizes, Māori farms also held more stock," Duoba said.
In 2022, Māori farms had, on average, just over double the stock of the average New Zealand farm, including:
- 3 times as many beef cattle
- 7 times as many sheep
- 5 times as many dairy cattle.
| Livestock type | Māori farms | All New Zealand farms |
| Total sheep | 4352 | 1612 |
| Total dairy cattle | 755 | 491 |
| Total beef | 523 | 175 |
Most Māori farms located in the North Island
Most Māori farms (85 percent) were in the North Island in 2022.
About half of Māori farms were in the Bay of Plenty, Waikato, and Northland regions. The most common farm types in these regions were:
- Bay of Plenty, kiwifruit growing (38 percent of Māori farms)
- Waikato, dairy cattle farming (36 percent of Māori farms)
- Northland, beef cattle farming - specialised (48 percent of Māori farms).
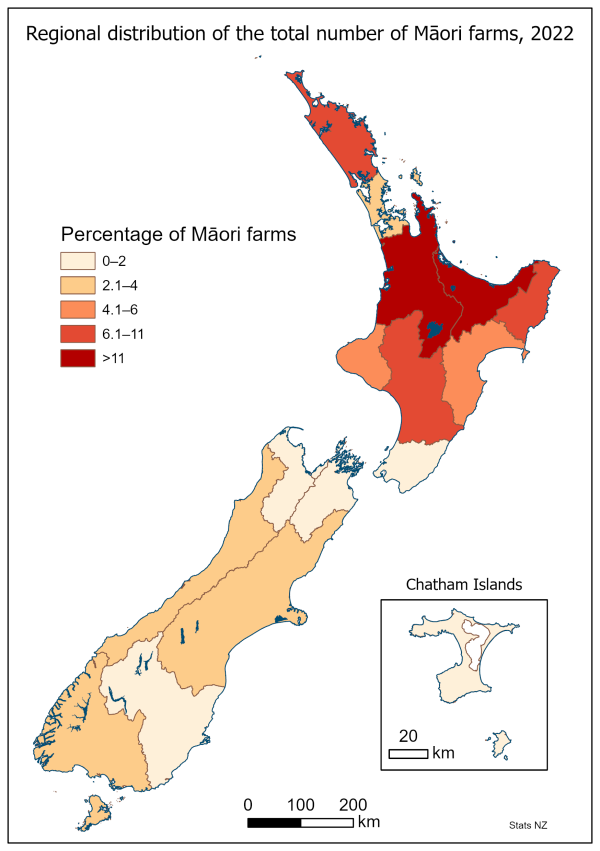
Text alternative for Regional distribution of the total number of Māori farms, 2022
Bay of Plenty had a greater proportion of small farms than other regions. Two thirds of the 183 Māori farms in Bay of Plenty were under 100 hectares in 2022, compared with 46 percent of Māori farms overall.
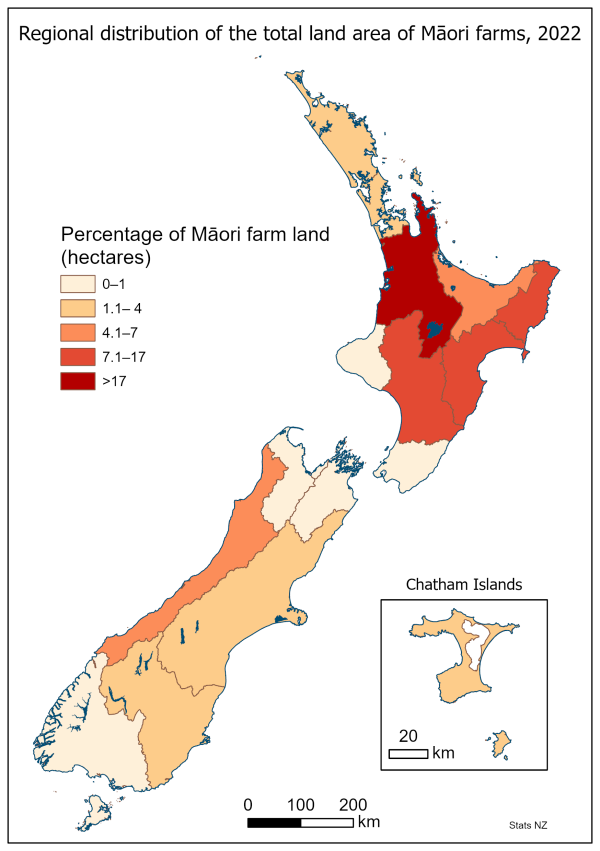
Text alternative for Regional distribution of the total land area of Māori farms, 2022
Over two-thirds of Māori farms in both the North Island (68 percent) and South Island (71 percent) were livestock farms in 2022, including sheep, beef, and dairy cattle farms.
Māori farms in the North Island carried more stock in total than their South Island counterparts. Māori farms in the Gisborne region alone accounted for 32 percent of sheep and 27 percent of beef cattle on all Māori farms.
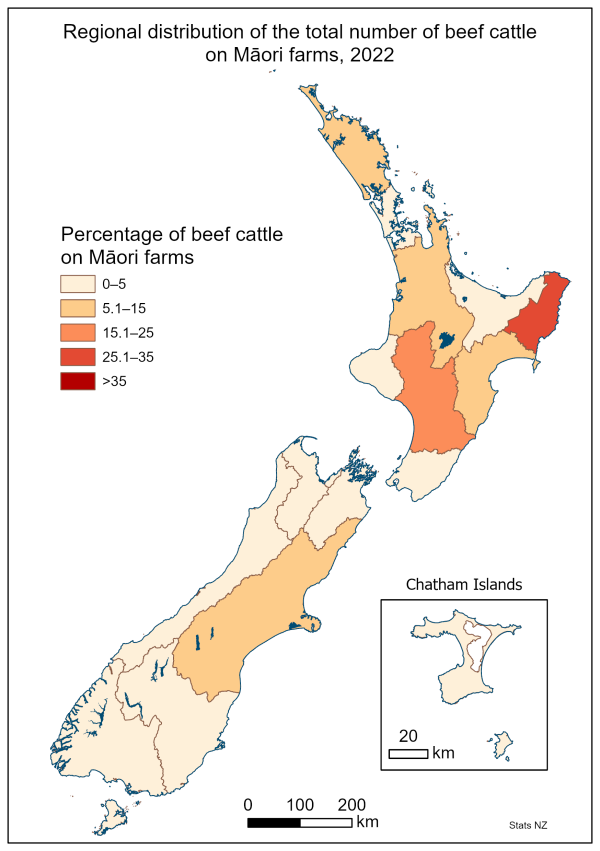
Text alternative for Regional distribution of the total number of beef cattle on Māori farms, 2022
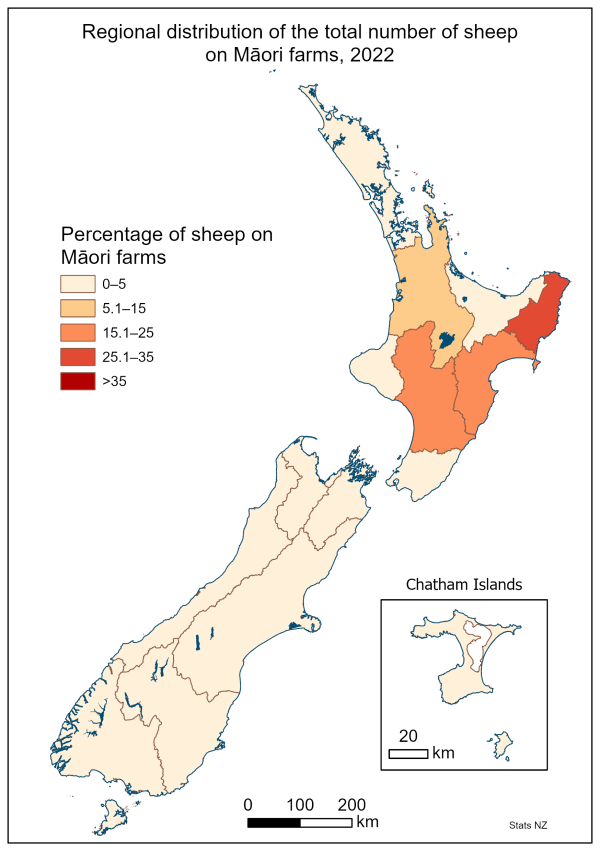
Text alternative for Regional distribution of the total number of sheep on Māori farms, 2022
"While livestock farms are the more common type of Māori farms across Aotearoa, large areas of Māori agricultural land are also dedicated for use as forests," Duoba said.
Māori farms used almost seven times as much land on average for forestry compared with the average of all farms in New Zealand. A greater proportion of farms in the South Island (32 percent) were primarily used for forestry in 2022, compared with 12 percent of North Island Māori farms.
The Agricultural Production Census 2022 collected information on farming activities across Aotearoa. The 2022 survey included new questions that enabled respondents to state if they consider their farm to be a Māori farm and if the owner or owners have Māori whakapapa (genealogy).
"This has improved both the quality of the data, and the number of Māori farms we have identified," Duoba said.
Many smaller farms were identified, compared with previous releases. As a result, data is not directly comparable to previous releases.
Text alternative for regional distribution of the total number of Māori farms, 2022
Map of New Zealand split by regions showing, of the total number of all Māori farms, what proportion are in each region as follows:
- Wellington, Tasman, Marlborough, Otago, and Chatham Islands, between 0 and 2 percent
- Auckland, West Coast, Canterbury, and Southland, between 2.1 and 4 percent
- Taranaki and Hawke's Bay, between 4.1 and 6 percent
- Northland, Gisborne, and Manawatū-Whanganui, between 6.1 and 11 percent
- Waikato and Bay of Plenty, greater than 11 percent.
Text alternative for Regional distribution of the total land area of Māori farms, 2022
Map of New Zealand split by regions showing, for the total land area of Māori farms, what proportion is in each region as follows:
- Taranaki, Wellington, Tasman, Marlborough, and Southland, between 0 and 1 percent
- Northland, Auckland, Canterbury, Otago, and Chatham Islands, between 1.1 and 4 percent
- Bay of Plenty and West Coast, between 4.1 and 7 percent
- Gisborne, Hawke's Bay, and Manawatū-Whanganui, between 7.1 and 17 percent
- Waikato, greater than 17 percent.
Text alternative for Regional distribution of the total number of beef cattle on Māori farms, 2022
A map of New Zealand split by regions showing the percentage of total beef cattle on all Māori farms in each region as follows:
- Auckland, Bay of Plenty, Taranaki, Wellington, Tasman, Marlborough, West Coast, Otago, Southland, and Chatham Islands, between 0 and 5 percent
- Northland, Waikato, Hawke's Bay, and Canterbury, between 5.1 and 15 percent
- Manawatū-Whanganui, between 15.1 and 25 percent
- Gisborne, between 25.1 and 35 percent.
Text alternative for Regional distribution of the total number of sheep on Māori farms, 2022
A map of New Zealand split by regions showing the percentage of total sheep on all Māori farms in each region as follows:
- Northland, Auckland, Bay of Plenty, Taranaki, Wellington, Tasman, Marlborough, West Coast, Canterbury, Otago, Southland, and Chatham Islands, between 0 and 5 percent
- Waikato, between 5.1 and 15 percent
- Manawatū-Whanganui and Hawke's Bay, between 15.1 and 25 percent
- Gisborne, between 25.1 and 35 percent.


