National labour force projections indicate the future size and age-sex structure of the labour force usually living in New Zealand based on assumptions about labour force participation and average hours worked, and current policy settings.
Key facts
National labour force projections indicate the future size and age-sex structure of the labour force living in Aotearoa New Zealand. All data cited here relate to June years. Data before 2024 are sourced from the Household Labour Force Survey (HLFS, year ended June, unless otherwise stated).
The projections indicate that:
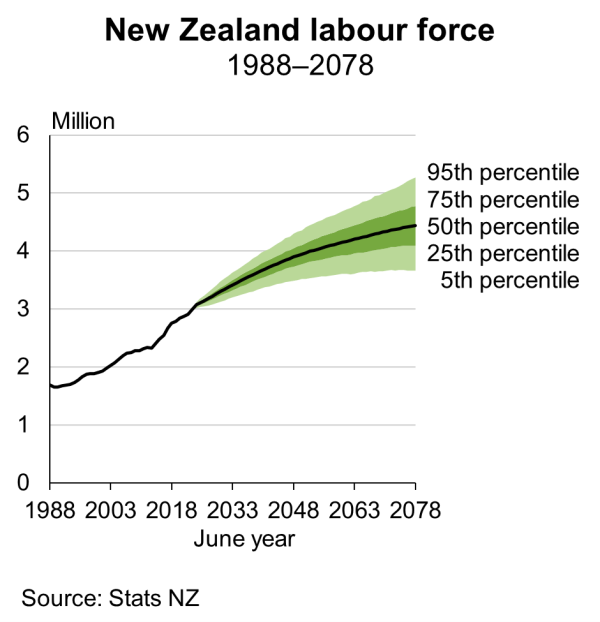
- New Zealand's labour force will continue to grow, but the growth rate will slow in the long-term
- the labour force will age, reflecting increasing labour force participation rates among males and females aged 50 years and over (50+), and the general ageing of the population.
The projections indicate a 90 percent chance that:
- the labour force (3.1 million in 2024) will increase to between 3.5 and 4.4 million in 2051, and to between 3.7 and 5.3 million in 2078
- the labour force aged 65 years and over (65+, 220,000 in 2024) will increase to between 250,000 and 460,000 in 2051, and to between 280,000 and 730,000 in 2078
- the proportion of the labour force that is aged 65+ (7 percent in 2024) will increase to between 7 and 11 percent in 2051, and to between 7 and 15 percent in 2078
- the proportion of the population aged 15 years and over (15+) in the labour force (71 percent in 2024) will be between 64 and 75 percent in 2051, and between 57 and 73 percent in 2078
- the proportion of the population aged 65+ in the labour force (25 percent in 2024) will be between 16 and 31 percent in 2051, and between 13 and 33 percent in 2078
- the ratio of those not in the labour force across all ages to those who are in the labour force (72 per 100 in 2024) will be between 54 and 84 per 100 in 2051, and between 55 and 103 per 100 in 2078
- the average number of hours that people in the labour force are working or available for work (37 hours per week in 2024) will be between 34 and 41 hours per week in 2051, and between 32 and 42 hours per week in 2078.
Text alternative for New Zealand labour force, 1988-2078.
| June year | Net migration | Changes in LFPRs | Changes in age structure |
| 2025 | 15900 | 8800 | 10400 |
| 2026 | 19200 | 8400 | 10400 |
| 2027 | 20800 | 8000 | 10100 |
| 2028 | 22100 | 7600 | 9800 |
| 2029 | 23200 | 7300 | 9200 |
| 2030 | 23900 | 6900 | 8700 |
| 2031 | 24200 | 6600 | 8200 |
| 2032 | 24400 | 6200 | 7700 |
| 2033 | 24600 | 5900 | 7100 |
| 2034 | 24800 | 5600 | 6600 |
| 2035 | 25000 | 5200 | 5900 |
| 2036 | 25200 | 4900 | 5500 |
| 2037 | 25400 | 4600 | 5100 |
| 2038 | 25600 | 4300 | 3800 |
| 2039 | 25800 | 4100 | 2900 |
| 2040 | 26000 | 3800 | 2200 |
| 2041 | 26100 | 3500 | 1700 |
| 2042 | 26300 | 3300 | 1400 |
| 2043 | 26500 | 3100 | 1100 |
| 2044 | 26700 | 2800 | 600 |
| 2045 | 26900 | 2600 | -100 |
| 2046 | 27000 | 2400 | -800 |
| 2047 | 27200 | 2200 | -1600 |
| 2048 | 27400 | 2000 | -2600 |
| 2049 | 27600 | 1900 | -3500 |
| 2050 | 27700 | 1700 | -4500 |
| 2051 | 27900 | 1600 | -5600 |
| 2052 | 28100 | 1400 | -6600 |
| 2053 | 28300 | 1300 | -7600 |
| 2054 | 28400 | 1100 | -8600 |
| 2055 | 28600 | 1000 | -9500 |
| 2056 | 28800 | 900 | -10300 |
| 2057 | 28900 | 800 | -10900 |
| 2058 | 29100 | 700 | -11400 |
| 2059 | 29300 | 600 | -11700 |
| 2060 | 29500 | 500 | -11900 |
| 2061 | 29600 | 400 | -12100 |
| 2062 | 29800 | 400 | -12200 |
| 2063 | 30000 | 300 | -12300 |
| 2064 | 30100 | 300 | -12400 |
| 2065 | 30300 | 200 | -12600 |
| 2066 | 30500 | 200 | -12800 |
| 2067 | 30600 | 100 | -13000 |
| 2068 | 30800 | 100 | -13400 |
| 2069 | 30900 | 100 | -13800 |
| 2070 | 31100 | 100 | -14400 |
| 2071 | 31300 | 0 | -15100 |
| 2072 | 31400 | 0 | -15900 |
| 2073 | 31600 | 0 | -16700 |
| 2074 | 31800 | 0 | -17500 |
| 2075 | 31900 | 0 | -18200 |
| 2076 | 32100 | 0 | -18800 |
| 2077 | 32300 | 0 | -19400 |
| 2078 | 32400 | 0 | -19900 |
| June year | 15-24 | 25-44 | 45-64 | 65+ |
| 1988 | 428600 | 817900 | 412400 | 26400 |
| 1989 | 400000 | 821500 | 406700 | 24400 |
| 1990 | 391000 | 827000 | 410400 | 23700 |
| 1991 | 387900 | 850100 | 419400 | 23300 |
| 1992 | 378200 | 860400 | 432200 | 21600 |
| 1993 | 365000 | 862700 | 451100 | 19700 |
| 1994 | 363200 | 874100 | 474900 | 22400 |
| 1995 | 365900 | 887600 | 501000 | 24000 |
| 1996 | 369900 | 910200 | 526500 | 25200 |
| 1997 | 362900 | 930000 | 551100 | 27300 |
| 1998 | 355800 | 934100 | 569700 | 24000 |
| 1999 | 334000 | 933400 | 593600 | 28000 |
| 2000 | 330400 | 936600 | 606300 | 31000 |
| 2001 | 330000 | 932300 | 635200 | 34900 |
| 2002 | 343300 | 935600 | 664600 | 40900 |
| 2003 | 349100 | 942500 | 691800 | 42100 |
| 2004 | 358200 | 952600 | 718400 | 47400 |
| 2005 | 364900 | 965100 | 753600 | 55200 |
| 2006 | 379300 | 973500 | 788400 | 57200 |
| 2007 | 386600 | 972800 | 806200 | 67200 |
| 2008 | 380900 | 964600 | 831100 | 73100 |
| 2009 | 374700 | 965500 | 857900 | 82800 |
| 2010 | 363000 | 954500 | 882200 | 85300 |
| 2011 | 363300 | 948500 | 902300 | 98500 |
| 2012 | 362800 | 943800 | 918300 | 110200 |
| 2013 | 355500 | 935000 | 921700 | 116900 |
| 2014 | 370700 | 957600 | 945200 | 128100 |
| 2015 | 393800 | 992300 | 961100 | 136700 |
| 2016 | 401200 | 1023900 | 973500 | 144600 |
| 2017 | 413600 | 1080500 | 1016900 | 160100 |
| 2018 | 419400 | 1123800 | 1041900 | 168300 |
| 2019 | 416900 | 1158000 | 1041500 | 170700 |
| 2020 | 415000 | 1187800 | 1055400 | 182400 |
| 2021 | 412100 | 1209900 | 1060800 | 192300 |
| 2022 | 420800 | 1222200 | 1068100 | 199600 |
| 2023 | 444400 | 1256900 | 1079100 | 211100 |
| 2024 | 450500 | 1327200 | 1076100 | 217300 |
| 2025 | 455600 | 1342700 | 1082200 | 225600 |
| 2026 | 463200 | 1357600 | 1088700 | 234600 |
| 2027 | 473100 | 1369800 | 1096300 | 243800 |
| 2028 | 483200 | 1380800 | 1106100 | 252400 |
| 2029 | 492000 | 1392300 | 1118200 | 259700 |
| 2030 | 500700 | 1402600 | 1133000 | 265400 |
| 2031 | 507900 | 1412700 | 1149900 | 270100 |
| 2032 | 510900 | 1423700 | 1169600 | 274800 |
| 2033 | 511100 | 1434100 | 1191600 | 279800 |
| 2034 | 511600 | 1442600 | 1214100 | 285300 |
| 2035 | 510400 | 1449300 | 1239700 | 290300 |
| 2036 | 509200 | 1454700 | 1265100 | 296500 |
| 2037 | 507800 | 1460500 | 1290500 | 301800 |
| 2038 | 505300 | 1467600 | 1315800 | 305600 |
| 2039 | 503000 | 1476000 | 1339900 | 308200 |
| 2040 | 500000 | 1485300 | 1364400 | 309300 |
| 2041 | 497400 | 1495400 | 1388000 | 309600 |
| 2042 | 494600 | 1507400 | 1409100 | 310400 |
| 2043 | 492500 | 1519100 | 1429400 | 311100 |
| 2044 | 490100 | 1532900 | 1445900 | 313400 |
| 2045 | 488600 | 1543400 | 1462900 | 316800 |
| 2046 | 486300 | 1555400 | 1477600 | 321000 |
| 2047 | 484400 | 1568400 | 1489000 | 326400 |
| 2048 | 486100 | 1577200 | 1498800 | 333000 |
| 2049 | 488000 | 1584200 | 1508800 | 340100 |
| 2050 | 488900 | 1591800 | 1517400 | 347800 |
| 2051 | 489900 | 1598100 | 1525900 | 355900 |
| 2052 | 491100 | 1600000 | 1536000 | 365700 |
| 2053 | 492500 | 1599300 | 1546200 | 376600 |
| 2054 | 494300 | 1599000 | 1554700 | 387600 |
| 2055 | 496400 | 1597300 | 1562500 | 399600 |
| 2056 | 498800 | 1595500 | 1569400 | 411400 |
| 2057 | 501600 | 1593800 | 1576900 | 421600 |
| 2058 | 504600 | 1592100 | 1585700 | 430000 |
| 2059 | 507700 | 1591700 | 1595300 | 435900 |
| 2060 | 511000 | 1591300 | 1605700 | 440700 |
| 2061 | 514100 | 1591800 | 1616700 | 443900 |
| 2062 | 517100 | 1592400 | 1629200 | 445700 |
| 2063 | 519800 | 1594200 | 1641400 | 447000 |
| 2064 | 522200 | 1596100 | 1655000 | 447000 |
| 2065 | 524300 | 1599400 | 1666000 | 448600 |
| 2066 | 525900 | 1602400 | 1678100 | 449700 |
| 2067 | 527100 | 1606000 | 1690700 | 449900 |
| 2068 | 528000 | 1613800 | 1698900 | 450600 |
| 2069 | 528600 | 1621900 | 1705500 | 452500 |
| 2070 | 528900 | 1629100 | 1712600 | 454700 |
| 2071 | 529000 | 1636300 | 1718400 | 457800 |
| 2072 | 529000 | 1643500 | 1720800 | 463800 |
| 2073 | 528900 | 1650700 | 1721200 | 471300 |
| 2074 | 528800 | 1657900 | 1721800 | 477800 |
| 2075 | 528700 | 1665000 | 1721400 | 484900 |
| 2076 | 528800 | 1672000 | 1721200 | 491300 |
| 2077 | 529000 | 1678900 | 1721100 | 497300 |
| 2078 | 529400 | 1685500 | 1721100 | 502700 |
| June year | 15-24 | 25-44 | 45-64 | 65+ |
| 1988 | 25.4 | 48.5 | 24.5 | 1.6 |
| 1989 | 24.2 | 49.7 | 24.6 | 1.5 |
| 1990 | 23.7 | 50.1 | 24.8 | 1.4 |
| 1991 | 23.1 | 50.6 | 25 | 1.4 |
| 1992 | 22.3 | 50.8 | 25.5 | 1.3 |
| 1993 | 21.5 | 50.8 | 26.6 | 1.2 |
| 1994 | 20.9 | 50.4 | 27.4 | 1.3 |
| 1995 | 20.6 | 49.9 | 28.2 | 1.3 |
| 1996 | 20.2 | 49.7 | 28.7 | 1.4 |
| 1997 | 19.4 | 49.7 | 29.5 | 1.5 |
| 1998 | 18.9 | 49.6 | 30.2 | 1.3 |
| 1999 | 17.7 | 49.4 | 31.4 | 1.5 |
| 2000 | 17.4 | 49.2 | 31.8 | 1.6 |
| 2001 | 17.1 | 48.2 | 32.9 | 1.8 |
| 2002 | 17.3 | 47.1 | 33.5 | 2.1 |
| 2003 | 17.2 | 46.5 | 34.2 | 2.1 |
| 2004 | 17.2 | 45.9 | 34.6 | 2.3 |
| 2005 | 17.1 | 45.1 | 35.2 | 2.6 |
| 2006 | 17.3 | 44.3 | 35.9 | 2.6 |
| 2007 | 17.3 | 43.6 | 36.1 | 3 |
| 2008 | 16.9 | 42.9 | 36.9 | 3.2 |
| 2009 | 16.4 | 42.3 | 37.6 | 3.6 |
| 2010 | 15.9 | 41.8 | 38.6 | 3.7 |
| 2011 | 15.7 | 41 | 39 | 4.3 |
| 2012 | 15.5 | 40.4 | 39.3 | 4.7 |
| 2013 | 15.3 | 40.1 | 39.6 | 5 |
| 2014 | 15.4 | 39.9 | 39.4 | 5.3 |
| 2015 | 15.9 | 40 | 38.7 | 5.5 |
| 2016 | 15.8 | 40.3 | 38.3 | 5.7 |
| 2017 | 15.5 | 40.4 | 38.1 | 6 |
| 2018 | 15.2 | 40.8 | 37.8 | 6.1 |
| 2019 | 15 | 41.5 | 37.4 | 6.1 |
| 2020 | 14.6 | 41.8 | 37.2 | 6.4 |
| 2021 | 14.3 | 42.1 | 36.9 | 6.7 |
| 2022 | 14.5 | 42 | 36.7 | 6.9 |
| 2023 | 14.9 | 42 | 36.1 | 7.1 |
| 2024 | 14.7 | 43.2 | 35 | 7.1 |
| 2025 | 14.7 | 43.2 | 34.8 | 7.3 |
| 2026 | 14.7 | 43.2 | 34.6 | 7.5 |
| 2027 | 14.9 | 43 | 34.4 | 7.7 |
| 2028 | 15 | 42.8 | 34.3 | 7.8 |
| 2029 | 15.1 | 42.7 | 34.3 | 8 |
| 2030 | 15.2 | 42.5 | 34.3 | 8 |
| 2031 | 15.2 | 42.3 | 34.4 | 8.1 |
| 2032 | 15.1 | 42.1 | 34.6 | 8.1 |
| 2033 | 15 | 42 | 34.9 | 8.2 |
| 2034 | 14.8 | 41.8 | 35.2 | 8.3 |
| 2035 | 14.6 | 41.5 | 35.5 | 8.3 |
| 2036 | 14.4 | 41.3 | 35.9 | 8.4 |
| 2037 | 14.3 | 41 | 36.2 | 8.5 |
| 2038 | 14.1 | 40.8 | 36.6 | 8.5 |
| 2039 | 13.9 | 40.7 | 36.9 | 8.5 |
| 2040 | 13.7 | 40.6 | 37.3 | 8.5 |
| 2041 | 13.5 | 40.5 | 37.6 | 8.4 |
| 2042 | 13.3 | 40.5 | 37.9 | 8.3 |
| 2043 | 13.1 | 40.5 | 38.1 | 8.3 |
| 2044 | 13 | 40.5 | 38.2 | 8.3 |
| 2045 | 12.8 | 40.5 | 38.4 | 8.3 |
| 2046 | 12.7 | 40.5 | 38.5 | 8.4 |
| 2047 | 12.5 | 40.5 | 38.5 | 8.4 |
| 2048 | 12.5 | 40.5 | 38.5 | 8.5 |
| 2049 | 12.4 | 40.4 | 38.5 | 8.7 |
| 2050 | 12.4 | 40.3 | 38.5 | 8.8 |
| 2051 | 12.3 | 40.3 | 38.4 | 9 |
| 2052 | 12.3 | 40.1 | 38.5 | 9.2 |
| 2053 | 12.3 | 39.8 | 38.5 | 9.4 |
| 2054 | 12.2 | 39.6 | 38.5 | 9.6 |
| 2055 | 12.2 | 39.4 | 38.5 | 9.9 |
| 2056 | 12.2 | 39.2 | 38.5 | 10.1 |
| 2057 | 12.3 | 38.9 | 38.5 | 10.3 |
| 2058 | 12.3 | 38.7 | 38.6 | 10.5 |
| 2059 | 12.3 | 38.5 | 38.6 | 10.6 |
| 2060 | 12.3 | 38.4 | 38.7 | 10.6 |
| 2061 | 12.3 | 38.2 | 38.8 | 10.7 |
| 2062 | 12.4 | 38.1 | 38.9 | 10.7 |
| 2063 | 12.4 | 37.9 | 39.1 | 10.6 |
| 2064 | 12.4 | 37.8 | 39.2 | 10.6 |
| 2065 | 12.4 | 37.7 | 39.3 | 10.6 |
| 2066 | 12.4 | 37.6 | 39.4 | 10.6 |
| 2067 | 12.3 | 37.6 | 39.6 | 10.5 |
| 2068 | 12.3 | 37.6 | 39.6 | 10.5 |
| 2069 | 12.3 | 37.6 | 39.6 | 10.5 |
| 2070 | 12.2 | 37.7 | 39.6 | 10.5 |
| 2071 | 12.2 | 37.7 | 39.6 | 10.5 |
| 2072 | 12.1 | 37.7 | 39.5 | 10.6 |
| 2073 | 12.1 | 37.8 | 39.4 | 10.8 |
| 2074 | 12.1 | 37.8 | 39.3 | 10.9 |
| 2075 | 12 | 37.8 | 39.1 | 11 |
| 2076 | 12 | 37.9 | 39 | 11.1 |
| 2077 | 12 | 37.9 | 38.9 | 11.2 |
| 2078 | 11.9 | 38 | 38.8 | 11.3 |
Growing share of the labour force aged 65+
In 2051, it is expected that between 7 and 11 percent of the labour force will be aged 65+, compared with 7 percent in 2024. By 2078, between 7 and 15 percent of the labour force will be aged 65+.
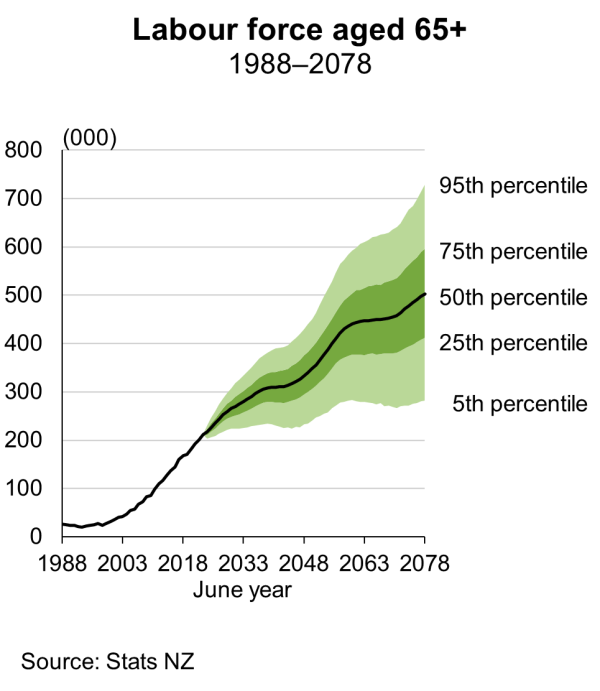
Text alternative for Labour force aged 65+, 1988-2078.
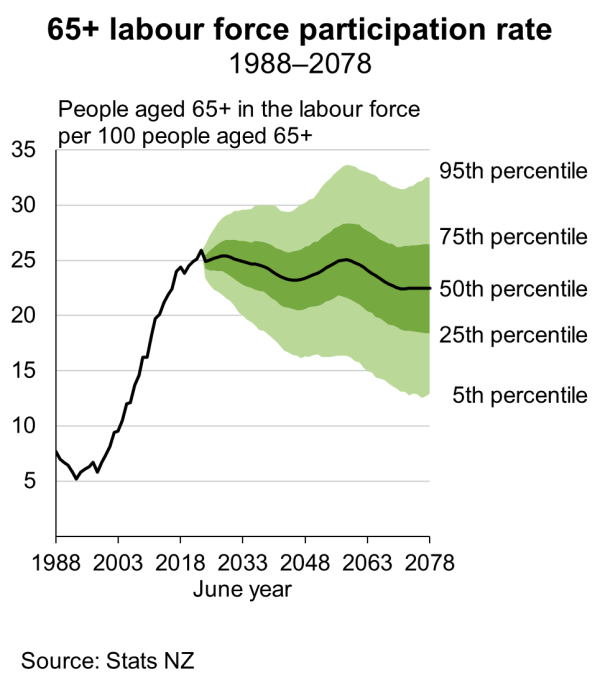
Text alternative for 65+ labour force participation rate, 1988-2078.
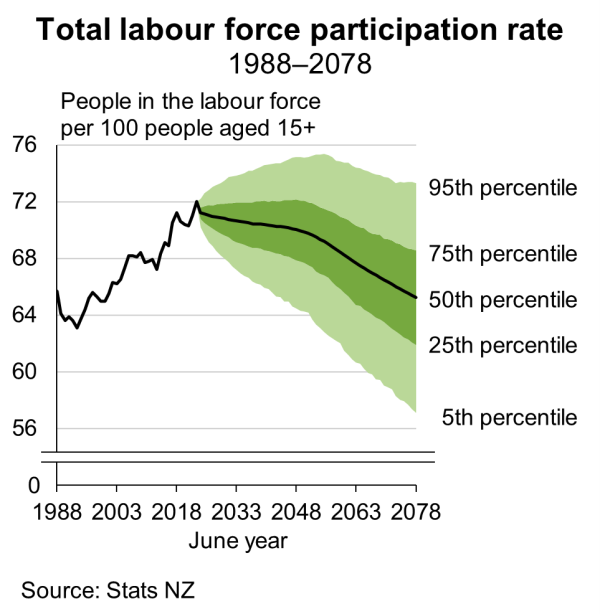
Text alternative for Total labour force participation rate, 1988-2078.
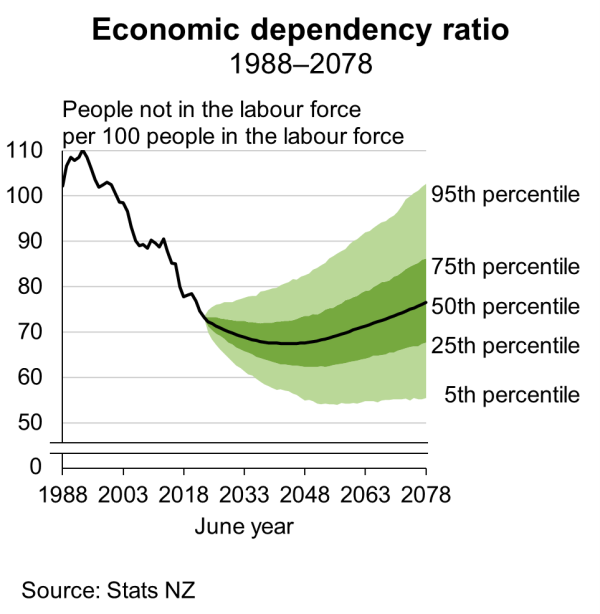
Text alternative for Economic dependency ratio, 1988-2078.
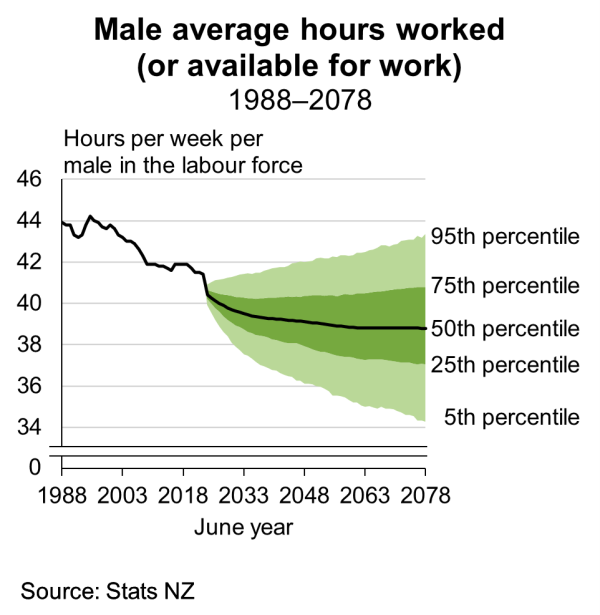
Text alternative for Male average hours worked (or available for work), 1988-2078.
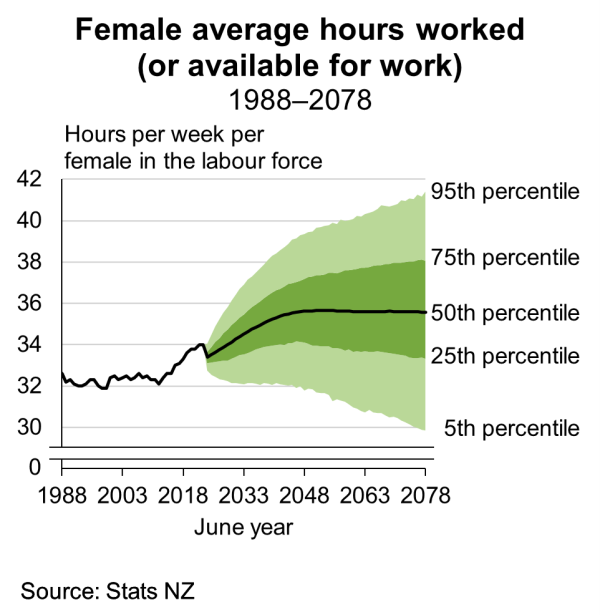
Text alternative for Female average hours worked (or available for work), 1988-2078.
| Age (years) | Male 2024 (base) | Male 2078 (assumed 5th percentile) | Male 2078 (assumed 50th percentile) | Male 2078 (assumed 95th percentile) |
| 15 | 0.213 | 0.078 | 0.213 | 0.353 |
| 16 | 0.384 | 0.238 | 0.384 | 0.535 |
| 17 | 0.565 | 0.417 | 0.565 | 0.719 |
| 18 | 0.711 | 0.57 | 0.711 | 0.858 |
| 19 | 0.754 | 0.629 | 0.754 | 0.883 |
| 20 | 0.796 | 0.686 | 0.796 | 0.911 |
| 21 | 0.821 | 0.722 | 0.821 | 0.923 |
| 22 | 0.844 | 0.756 | 0.844 | 0.934 |
| 23 | 0.865 | 0.787 | 0.865 | 0.945 |
| 24 | 0.885 | 0.816 | 0.885 | 0.956 |
| 25 | 0.905 | 0.843 | 0.905 | 0.968 |
| 26 | 0.92 | 0.864 | 0.92 | 0.977 |
| 27 | 0.93 | 0.879 | 0.93 | 0.982 |
| 28 | 0.935 | 0.888 | 0.935 | 0.984 |
| 29 | 0.937 | 0.893 | 0.937 | 0.982 |
| 30 | 0.937 | 0.895 | 0.937 | 0.98 |
| 31 | 0.938 | 0.898 | 0.938 | 0.979 |
| 32 | 0.94 | 0.901 | 0.94 | 0.981 |
| 33 | 0.943 | 0.905 | 0.943 | 0.982 |
| 34 | 0.944 | 0.907 | 0.944 | 0.983 |
| 35 | 0.944 | 0.908 | 0.944 | 0.981 |
| 36 | 0.942 | 0.906 | 0.942 | 0.978 |
| 37 | 0.94 | 0.906 | 0.94 | 0.977 |
| 38 | 0.939 | 0.905 | 0.939 | 0.975 |
| 39 | 0.938 | 0.904 | 0.938 | 0.974 |
| 40 | 0.937 | 0.902 | 0.937 | 0.972 |
| 41 | 0.935 | 0.901 | 0.935 | 0.971 |
| 42 | 0.934 | 0.9 | 0.934 | 0.969 |
| 43 | 0.932 | 0.898 | 0.932 | 0.968 |
| 44 | 0.931 | 0.898 | 0.931 | 0.966 |
| 45 | 0.931 | 0.898 | 0.931 | 0.966 |
| 46 | 0.932 | 0.898 | 0.932 | 0.966 |
| 47 | 0.932 | 0.899 | 0.932 | 0.967 |
| 48 | 0.932 | 0.899 | 0.932 | 0.967 |
| 49 | 0.932 | 0.898 | 0.932 | 0.967 |
| 50 | 0.931 | 0.895 | 0.931 | 0.967 |
| 51 | 0.928 | 0.892 | 0.929 | 0.968 |
| 52 | 0.923 | 0.889 | 0.929 | 0.97 |
| 53 | 0.919 | 0.885 | 0.928 | 0.973 |
| 54 | 0.915 | 0.879 | 0.926 | 0.975 |
| 55 | 0.912 | 0.872 | 0.923 | 0.977 |
| 56 | 0.91 | 0.862 | 0.919 | 0.978 |
| 57 | 0.906 | 0.851 | 0.913 | 0.978 |
| 58 | 0.897 | 0.834 | 0.905 | 0.977 |
| 59 | 0.878 | 0.811 | 0.894 | 0.98 |
| 60 | 0.854 | 0.779 | 0.881 | 0.986 |
| 61 | 0.832 | 0.74 | 0.866 | 0.996 |
| 62 | 0.812 | 0.693 | 0.848 | 1 |
| 63 | 0.786 | 0.638 | 0.825 | 1 |
| 64 | 0.747 | 0.57 | 0.79 | 1 |
| 65 | 0.669 | 0.464 | 0.712 | 0.97 |
| 66 | 0.605 | 0.382 | 0.649 | 0.926 |
| 67 | 0.545 | 0.316 | 0.589 | 0.873 |
| 68 | 0.489 | 0.264 | 0.533 | 0.811 |
| 69 | 0.437 | 0.224 | 0.48 | 0.744 |
| 70 | 0.388 | 0.191 | 0.43 | 0.677 |
| 71 | 0.344 | 0.163 | 0.384 | 0.613 |
| 72 | 0.304 | 0.138 | 0.342 | 0.553 |
| 73 | 0.268 | 0.118 | 0.304 | 0.495 |
| 74 | 0.236 | 0.104 | 0.269 | 0.44 |
| 75 | 0.207 | 0.092 | 0.238 | 0.389 |
| 76 | 0.183 | 0.081 | 0.211 | 0.346 |
| 77 | 0.164 | 0.072 | 0.189 | 0.311 |
| 78 | 0.147 | 0.065 | 0.17 | 0.279 |
| 79 | 0.13 | 0.057 | 0.151 | 0.249 |
| 80 | 0.113 | 0.048 | 0.133 | 0.22 |
| 81 | 0.098 | 0.041 | 0.116 | 0.194 |
| 82 | 0.086 | 0.035 | 0.102 | 0.172 |
| 83 | 0.075 | 0.03 | 0.09 | 0.152 |
| 84 | 0.064 | 0.026 | 0.079 | 0.134 |
| 85 | 0.055 | 0.02 | 0.068 | 0.117 |
| 86 | 0.045 | 0.014 | 0.057 | 0.101 |
| 87 | 0.036 | 0.008 | 0.046 | 0.085 |
| 88 | 0.027 | 0.001 | 0.036 | 0.071 |
| 89 | 0.019 | 0 | 0.026 | 0.058 |
| 90 | 0.013 | 0 | 0.018 | 0.047 |
| 91 | 0.01 | 0 | 0.015 | 0.041 |
| 92 | 0.01 | 0 | 0.015 | 0.04 |
| 93 | 0.01 | 0 | 0.014 | 0.038 |
| 94 | 0.01 | 0 | 0.014 | 0.037 |
| 95 | 0.01 | 0 | 0.014 | 0.036 |
| 96 | 0.01 | 0 | 0.014 | 0.035 |
| 97 | 0.01 | 0 | 0.014 | 0.034 |
| 98 | 0.01 | 0 | 0.014 | 0.034 |
| 99 | 0.01 | 0 | 0.014 | 0.034 |
| 100 | 0.01 | 0 | 0.014 | 0.034 |
| Age (years) | Female 2024 (base) | Female 2078 (assumed 5th percentile) | Female 2078 (assumed 50th percentile) | Female 2078 (assumed 95th percentile) |
| 15 | 0.256 | 0.177 | 0.256 | 0.339 |
| 16 | 0.439 | 0.356 | 0.439 | 0.525 |
| 17 | 0.588 | 0.504 | 0.588 | 0.674 |
| 18 | 0.68 | 0.599 | 0.68 | 0.764 |
| 19 | 0.731 | 0.655 | 0.731 | 0.81 |
| 20 | 0.747 | 0.683 | 0.754 | 0.827 |
| 21 | 0.773 | 0.716 | 0.785 | 0.857 |
| 22 | 0.801 | 0.746 | 0.815 | 0.887 |
| 23 | 0.816 | 0.77 | 0.84 | 0.912 |
| 24 | 0.82 | 0.79 | 0.859 | 0.931 |
| 25 | 0.825 | 0.804 | 0.874 | 0.945 |
| 26 | 0.821 | 0.807 | 0.876 | 0.948 |
| 27 | 0.818 | 0.808 | 0.877 | 0.948 |
| 28 | 0.816 | 0.808 | 0.877 | 0.948 |
| 29 | 0.816 | 0.809 | 0.877 | 0.948 |
| 30 | 0.816 | 0.81 | 0.878 | 0.949 |
| 31 | 0.819 | 0.813 | 0.881 | 0.951 |
| 32 | 0.822 | 0.817 | 0.884 | 0.954 |
| 33 | 0.827 | 0.822 | 0.888 | 0.956 |
| 34 | 0.832 | 0.828 | 0.892 | 0.959 |
| 35 | 0.836 | 0.835 | 0.896 | 0.96 |
| 36 | 0.839 | 0.84 | 0.899 | 0.96 |
| 37 | 0.842 | 0.844 | 0.9 | 0.958 |
| 38 | 0.844 | 0.849 | 0.901 | 0.956 |
| 39 | 0.846 | 0.854 | 0.903 | 0.954 |
| 40 | 0.848 | 0.858 | 0.904 | 0.951 |
| 41 | 0.852 | 0.863 | 0.905 | 0.949 |
| 42 | 0.856 | 0.868 | 0.907 | 0.946 |
| 43 | 0.86 | 0.873 | 0.909 | 0.946 |
| 44 | 0.866 | 0.878 | 0.912 | 0.947 |
| 45 | 0.872 | 0.884 | 0.916 | 0.95 |
| 46 | 0.874 | 0.886 | 0.918 | 0.952 |
| 47 | 0.875 | 0.887 | 0.92 | 0.953 |
| 48 | 0.874 | 0.885 | 0.918 | 0.953 |
| 49 | 0.872 | 0.88 | 0.916 | 0.953 |
| 50 | 0.869 | 0.874 | 0.913 | 0.952 |
| 51 | 0.864 | 0.866 | 0.908 | 0.952 |
| 52 | 0.859 | 0.856 | 0.903 | 0.952 |
| 53 | 0.853 | 0.845 | 0.898 | 0.953 |
| 54 | 0.847 | 0.834 | 0.894 | 0.956 |
| 55 | 0.838 | 0.819 | 0.887 | 0.957 |
| 56 | 0.829 | 0.804 | 0.88 | 0.96 |
| 57 | 0.82 | 0.788 | 0.875 | 0.964 |
| 58 | 0.808 | 0.768 | 0.866 | 0.968 |
| 59 | 0.788 | 0.74 | 0.851 | 0.965 |
| 60 | 0.762 | 0.702 | 0.828 | 0.957 |
| 61 | 0.731 | 0.658 | 0.8 | 0.947 |
| 62 | 0.695 | 0.611 | 0.768 | 0.93 |
| 63 | 0.642 | 0.553 | 0.718 | 0.889 |
| 64 | 0.586 | 0.499 | 0.665 | 0.838 |
| 65 | 0.528 | 0.445 | 0.608 | 0.778 |
| 66 | 0.466 | 0.389 | 0.544 | 0.705 |
| 67 | 0.414 | 0.347 | 0.49 | 0.639 |
| 68 | 0.365 | 0.309 | 0.438 | 0.57 |
| 69 | 0.319 | 0.274 | 0.386 | 0.501 |
| 70 | 0.275 | 0.238 | 0.335 | 0.436 |
| 71 | 0.235 | 0.205 | 0.288 | 0.375 |
| 72 | 0.198 | 0.174 | 0.244 | 0.317 |
| 73 | 0.163 | 0.146 | 0.204 | 0.264 |
| 74 | 0.135 | 0.121 | 0.17 | 0.222 |
| 75 | 0.112 | 0.1 | 0.144 | 0.189 |
| 76 | 0.094 | 0.083 | 0.123 | 0.165 |
| 77 | 0.082 | 0.072 | 0.108 | 0.146 |
| 78 | 0.071 | 0.063 | 0.096 | 0.13 |
| 79 | 0.061 | 0.053 | 0.083 | 0.115 |
| 80 | 0.051 | 0.043 | 0.071 | 0.1 |
| 81 | 0.042 | 0.035 | 0.06 | 0.086 |
| 82 | 0.035 | 0.028 | 0.051 | 0.075 |
| 83 | 0.03 | 0.022 | 0.044 | 0.066 |
| 84 | 0.026 | 0.018 | 0.038 | 0.058 |
| 85 | 0.022 | 0.015 | 0.033 | 0.052 |
| 86 | 0.02 | 0.013 | 0.03 | 0.047 |
| 87 | 0.018 | 0.012 | 0.027 | 0.043 |
| 88 | 0.016 | 0.011 | 0.025 | 0.04 |
| 89 | 0.015 | 0.01 | 0.023 | 0.037 |
| 90 | 0.013 | 0.007 | 0.02 | 0.033 |
| 91 | 0.01 | 0.003 | 0.015 | 0.028 |
| 92 | 0.01 | 0.003 | 0.015 | 0.027 |
| 93 | 0.01 | 0.003 | 0.014 | 0.026 |
| 94 | 0.01 | 0.003 | 0.014 | 0.026 |
| 95 | 0.01 | 0.003 | 0.014 | 0.025 |
| 96 | 0.01 | 0.004 | 0.014 | 0.025 |
| 97 | 0.01 | 0.004 | 0.014 | 0.025 |
| 98 | 0.01 | 0.004 | 0.014 | 0.025 |
| 99 | 0.01 | 0.004 | 0.014 | 0.025 |
| 100 | 0.01 | 0.004 | 0.014 | 0.025 |
| Age (years) | Male 2024 (base) | Male 2078 (assumed 5th percentile) | Male 2078 (assumed 50th percentile) | Male 2078 (assumed 95th percentile) |
| 15 | 10.6 | 3.5 | 10.6 | 17.6 |
| 16 | 14.5 | 6.6 | 14.5 | 22.3 |
| 17 | 20.3 | 12.3 | 20.3 | 28.2 |
| 18 | 26.8 | 17.7 | 26.8 | 35.8 |
| 19 | 31.7 | 24 | 31.7 | 39.3 |
| 20 | 34.1 | 27.1 | 34.1 | 41 |
| 21 | 35.4 | 29 | 35.3 | 41.6 |
| 22 | 37 | 31.1 | 36.8 | 42.5 |
| 23 | 38.6 | 33.5 | 38.3 | 42.9 |
| 24 | 40 | 35.5 | 39.4 | 43.3 |
| 25 | 40.6 | 36 | 39.7 | 43.5 |
| 26 | 41 | 36.1 | 39.8 | 43.5 |
| 27 | 41.4 | 36.4 | 39.9 | 43.4 |
| 28 | 41.7 | 36.5 | 40 | 43.4 |
| 29 | 41.9 | 36.4 | 40 | 43.5 |
| 30 | 42.1 | 36.5 | 40 | 43.5 |
| 31 | 42.2 | 36.3 | 39.9 | 43.5 |
| 32 | 42.3 | 36.2 | 39.9 | 43.5 |
| 33 | 42.4 | 36 | 39.8 | 43.5 |
| 34 | 42.5 | 36 | 39.8 | 43.6 |
| 35 | 42.6 | 36 | 39.8 | 43.7 |
| 36 | 42.8 | 36.1 | 39.9 | 43.7 |
| 37 | 42.8 | 36 | 39.9 | 43.8 |
| 38 | 42.9 | 35.9 | 39.9 | 43.8 |
| 39 | 42.9 | 35.9 | 39.9 | 43.9 |
| 40 | 43 | 36.1 | 40 | 44 |
| 41 | 43.1 | 36.1 | 40.1 | 44.1 |
| 42 | 43.1 | 36.2 | 40.2 | 44.1 |
| 43 | 43.1 | 36.3 | 40.2 | 44.2 |
| 44 | 43.1 | 36.3 | 40.3 | 44.2 |
| 45 | 43.1 | 36.5 | 40.4 | 44.3 |
| 46 | 43.2 | 36.7 | 40.6 | 44.4 |
| 47 | 43.3 | 37.1 | 40.9 | 44.6 |
| 48 | 43.5 | 37.5 | 41.2 | 44.8 |
| 49 | 43.6 | 37.9 | 41.5 | 45 |
| 50 | 43.6 | 38.2 | 41.7 | 45.2 |
| 51 | 43.7 | 38.5 | 41.9 | 45.4 |
| 52 | 43.7 | 38.8 | 42.2 | 45.5 |
| 53 | 43.7 | 38.9 | 42.2 | 45.5 |
| 54 | 43.6 | 39.1 | 42.3 | 45.5 |
| 55 | 43.5 | 39.1 | 42.3 | 45.5 |
| 56 | 43.5 | 39.3 | 42.4 | 45.4 |
| 57 | 43.3 | 39.3 | 42.3 | 45.3 |
| 58 | 43.2 | 39.3 | 42.3 | 45.2 |
| 59 | 43 | 39.3 | 42.2 | 45.1 |
| 60 | 42.8 | 39.1 | 42.1 | 45 |
| 61 | 42.3 | 38.6 | 41.7 | 44.8 |
| 62 | 41.7 | 37.8 | 41.2 | 44.6 |
| 63 | 41 | 36.6 | 40.6 | 44.5 |
| 64 | 40.2 | 35.3 | 39.9 | 44.4 |
| 65 | 39.3 | 33.7 | 39.1 | 44.3 |
| 66 | 38.3 | 32 | 38.1 | 44.2 |
| 67 | 37.1 | 30 | 37 | 43.9 |
| 68 | 35.8 | 27.9 | 35.8 | 43.5 |
| 69 | 34.4 | 25.8 | 34.4 | 42.9 |
| 70 | 32.9 | 23.6 | 32.9 | 42.2 |
| 71 | 31.6 | 21.6 | 31.6 | 41.4 |
| 72 | 30.4 | 20.2 | 30.4 | 40.6 |
| 73 | 29.4 | 18.8 | 29.4 | 39.8 |
| 74 | 28.6 | 17.8 | 28.6 | 39.2 |
| 75 | 27.9 | 17.1 | 27.9 | 38.6 |
| 76 | 27.4 | 16.6 | 27.4 | 38.1 |
| 77 | 27 | 16.1 | 27 | 37.7 |
| 78 | 26.5 | 15.5 | 26.5 | 37.3 |
| 79 | 25.9 | 14.7 | 25.9 | 36.9 |
| 80 | 25.3 | 13.8 | 25.3 | 36.6 |
| 81 | 24.8 | 13.1 | 24.8 | 36.3 |
| 82 | 24.3 | 12.4 | 24.3 | 36.1 |
| 83 | 23.9 | 11.8 | 23.9 | 35.9 |
| 84 | 23.6 | 11.4 | 23.6 | 35.7 |
| 85 | 23.4 | 11.1 | 23.4 | 35.6 |
| 86 | 23.2 | 10.8 | 23.2 | 35.4 |
| 87 | 23 | 10.5 | 23 | 35.3 |
| 88 | 22.7 | 10.2 | 22.7 | 35.1 |
| 89 | 22.5 | 9.9 | 22.5 | 35 |
| 90 | 22.3 | 9.6 | 22.3 | 34.8 |
| 91 | 22 | 9.3 | 22 | 34.7 |
| 92 | 21.8 | 9 | 21.8 | 34.5 |
| 93 | 21.6 | 8.7 | 21.6 | 34.4 |
| 94 | 21.4 | 8.3 | 21.4 | 34.2 |
| 95 | 21.1 | 8 | 21.1 | 34.1 |
| 96 | 20.9 | 7.7 | 20.9 | 33.9 |
| 97 | 20.7 | 7.4 | 20.7 | 33.8 |
| 98 | 20.5 | 7.1 | 20.5 | 33.6 |
| 99 | 20.2 | 6.8 | 20.2 | 33.5 |
| 100 | 20 | 6.5 | 20 | 33.3 |
| Age (years) | Female 2024 (base) | Female 2078 (assumed 5th percentile) | Female 2078 (assumed 50th percentile) | Female 2078 (assumed 95th percentile) |
| 15 | 9 | 2.5 | 9 | 15.3 |
| 16 | 11.5 | 4.6 | 11.5 | 18.2 |
| 17 | 14.8 | 7.3 | 14.8 | 22.1 |
| 18 | 21 | 13 | 21 | 28.9 |
| 19 | 24.7 | 15.6 | 24.7 | 33.6 |
| 20 | 26.1 | 17.3 | 26.1 | 34.7 |
| 21 | 28.5 | 20.4 | 28.6 | 36.7 |
| 22 | 32.2 | 26.4 | 32.5 | 38.6 |
| 23 | 34.4 | 29.8 | 35 | 40.1 |
| 24 | 35.5 | 31.7 | 36.5 | 41.3 |
| 25 | 36.1 | 33.1 | 37.6 | 42 |
| 26 | 36.3 | 34 | 38.3 | 42.5 |
| 27 | 36.5 | 34.6 | 38.8 | 42.9 |
| 28 | 36.5 | 35 | 39.2 | 43.3 |
| 29 | 36.3 | 34.9 | 39.2 | 43.5 |
| 30 | 36 | 34.6 | 39.1 | 43.5 |
| 31 | 35.6 | 34.2 | 38.9 | 43.6 |
| 32 | 35.3 | 33.8 | 38.7 | 43.6 |
| 33 | 35 | 33.3 | 38.5 | 43.6 |
| 34 | 34.7 | 32.9 | 38.3 | 43.6 |
| 35 | 34.5 | 32.5 | 38.1 | 43.7 |
| 36 | 34.5 | 32.5 | 38.1 | 43.7 |
| 37 | 34.4 | 32.5 | 38.1 | 43.6 |
| 38 | 34.5 | 32.6 | 38.1 | 43.5 |
| 39 | 34.5 | 32.7 | 38.1 | 43.4 |
| 40 | 34.5 | 32.9 | 38.1 | 43.3 |
| 41 | 34.6 | 33.1 | 38.1 | 43.2 |
| 42 | 34.8 | 33.4 | 38.3 | 43.2 |
| 43 | 35.1 | 33.8 | 38.6 | 43.2 |
| 44 | 35.5 | 34.4 | 38.9 | 43.4 |
| 45 | 35.9 | 34.9 | 39.3 | 43.6 |
| 46 | 36.3 | 35.3 | 39.6 | 43.8 |
| 47 | 36.5 | 35.5 | 39.7 | 43.9 |
| 48 | 36.6 | 35.6 | 39.7 | 43.9 |
| 49 | 36.7 | 35.4 | 39.6 | 43.8 |
| 50 | 36.7 | 35.2 | 39.5 | 43.7 |
| 51 | 36.6 | 34.9 | 39.3 | 43.6 |
| 52 | 36.5 | 34.5 | 39 | 43.4 |
| 53 | 36.3 | 34 | 38.7 | 43.3 |
| 54 | 36 | 33.5 | 38.3 | 43.1 |
| 55 | 35.8 | 33 | 38 | 42.9 |
| 56 | 35.6 | 32.6 | 37.7 | 42.8 |
| 57 | 35.4 | 32.2 | 37.4 | 42.6 |
| 58 | 35.3 | 31.8 | 37.2 | 42.6 |
| 59 | 35.1 | 31.2 | 36.9 | 42.5 |
| 60 | 34.7 | 30.4 | 36.4 | 42.4 |
| 61 | 34.2 | 29.3 | 35.8 | 42.2 |
| 62 | 33.5 | 28.2 | 35.1 | 41.9 |
| 63 | 32.7 | 26.8 | 34.2 | 41.5 |
| 64 | 31.8 | 25.5 | 33.3 | 41.1 |
| 65 | 30.8 | 24 | 32.3 | 40.5 |
| 66 | 29.7 | 22.4 | 31.1 | 39.8 |
| 67 | 28.4 | 20.3 | 29.7 | 39.1 |
| 68 | 27 | 18 | 28.2 | 38.3 |
| 69 | 25.7 | 15.7 | 26.6 | 37.4 |
| 70 | 24.6 | 13.7 | 25.2 | 36.6 |
| 71 | 23.8 | 12.3 | 24.2 | 35.9 |
| 72 | 23.1 | 11.2 | 23.3 | 35.3 |
| 73 | 22.6 | 10.5 | 22.7 | 34.8 |
| 74 | 22.3 | 10 | 22.3 | 34.4 |
| 75 | 21.8 | 9.5 | 21.8 | 34 |
| 76 | 21.6 | 9.3 | 21.6 | 33.7 |
| 77 | 21.3 | 9.1 | 21.3 | 33.4 |
| 78 | 21.1 | 8.9 | 21.1 | 33.2 |
| 79 | 20.9 | 8.7 | 20.9 | 32.9 |
| 80 | 20.6 | 8.5 | 20.6 | 32.7 |
| 81 | 20.4 | 8.2 | 20.4 | 32.4 |
| 82 | 20.2 | 8 | 20.2 | 32.2 |
| 83 | 19.9 | 7.8 | 19.9 | 32 |
| 84 | 19.7 | 7.6 | 19.7 | 31.7 |
| 85 | 19.5 | 7.3 | 19.5 | 31.5 |
| 86 | 19.2 | 7.1 | 19.2 | 31.2 |
| 87 | 19 | 6.9 | 19 | 31 |
| 88 | 18.8 | 6.7 | 18.8 | 30.8 |
| 89 | 18.6 | 6.4 | 18.6 | 30.5 |
| 90 | 18.3 | 6.2 | 18.3 | 30.3 |
| 91 | 18.1 | 6 | 18.1 | 30.1 |
| 92 | 17.9 | 5.8 | 17.9 | 29.8 |
| 93 | 17.6 | 5.5 | 17.6 | 29.6 |
| 94 | 17.4 | 5.3 | 17.4 | 29.3 |
| 95 | 17.2 | 5.1 | 17.2 | 29.1 |
| 96 | 16.9 | 4.8 | 16.9 | 28.9 |
| 97 | 16.7 | 4.6 | 16.7 | 28.6 |
| 98 | 16.5 | 4.4 | 16.5 | 28.4 |
| 99 | 16.2 | 4.2 | 16.2 | 28.2 |
| 100 | 16 | 3.9 | 16 | 27.9 |
More data
Use Aotearoa Data Explorer to access detailed national labour force projections. The following links will take you to the two specific tables:
- National labour force projections, by age and sex, 2024(base)-2078
- National labour force projections, characteristics, 2024(base)─2078
Definitions and metadata
National labour force projections - DataInfo+ provides general information about methods and assumptions.
Household labour force survey concepts - Datainfo+ provides definitions of terms relating to the labour force used in this release.
Population concepts - Datainfo+ provides definitions of terms relating to population used in this release.
Projection method concepts - Datainfo+ provides definitions of terms relating to projections used in this release.
National population projections - DataInfo+ provides general information about national population projections.
Household Labour Force Survey - DataInfo+ gives general methodology used to produce Household Labour Force Survey statistics, and related metadata.
Technical enquiries
Kim Dunstan
[email protected]
03 964 8330
ISSN 1178-0606
Next related release
National ethnic population projections: 2023(base)-2048 will be released on 11 September 2025.


