National population projections indicate the future size and age-sex structure of the population usually living in New Zealand based on different combinations of fertility, mortality, and migration assumptions, and current policy settings.
Key facts
National population projections indicate the future size and age-sex structure of the population living in Aotearoa New Zealand. All data cited here relate to June years.
In the short term, the projections indicate:
- New Zealand's population (5.29 million in 2024) has a 90 percent probability of increasing to between 5.36 and 5.62 million in 2028, and to between 5.46 and 5.86 million in 2031
- the population aged 65 years and over (65+, 0.87 million in 2024) has a 90 percent probability of increasing to between 0.99 and 1.00 million in 2028, and to between 1.07 and 1.09 million in 2031.
In the long term, the projections indicate:
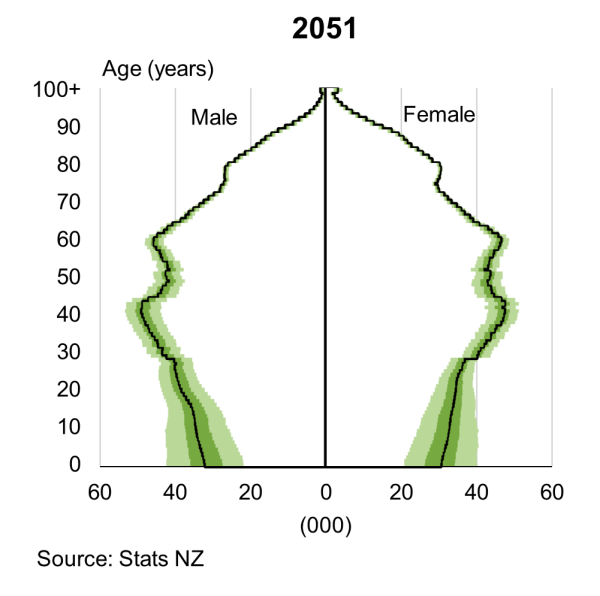
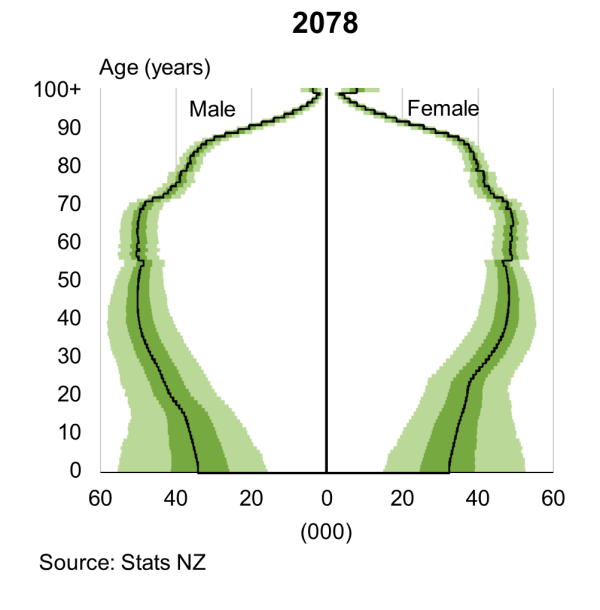
- New Zealand's population (5.29 million in 2024) has a 90 percent probability of increasing to between 6.12 and 7.21 million in 2051, and to between 6.61 and 9.05 million in 2078
- population growth will slow as New Zealand's population ages and the gap between the number of births and deaths (natural increase) shrinks
- New Zealand will have increasing numbers and proportions of the population at the older ages
- the population aged 65+ (0.87 million in 2024) has a 90 percent probability of increasing to between 1.44 and 1.55 million in 2051, and to between 2.04 and 2.45 million in 2078
- the proportion of the population aged 65+ (17 percent in 2024) has a 90 percent probability of increasing to between 21 and 24 percent in 2051, and to between 25 and 33 percent in 2078
- the population aged 85+ (95,000 in 2024) has a 90 percent probability of increasing to between 275,000 and 322,000 in 2051, and to between 459,000 and 628,000 in 2078
- the proportion of the population aged 85+ (2 percent in 2024) has a 90 percent probability of increasing to between 4 and 5 percent in 2051, and to between 6 and 8 percent in 2078.

Text alternative for New Zealand population, 1953-2078
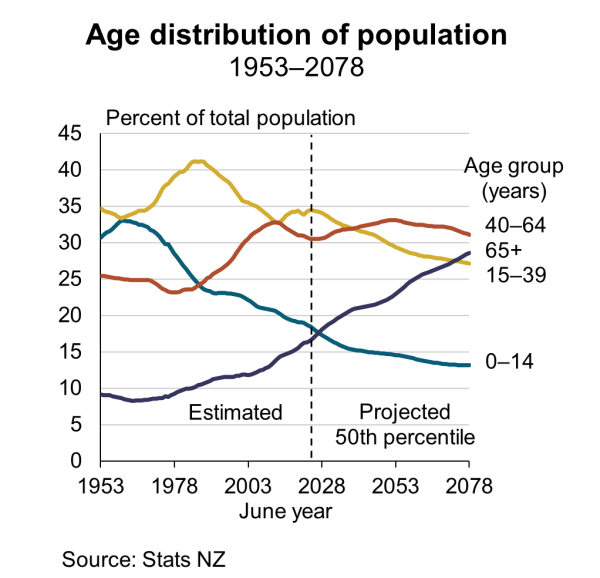
Text alternative for Age distribution of population, 1953-2078
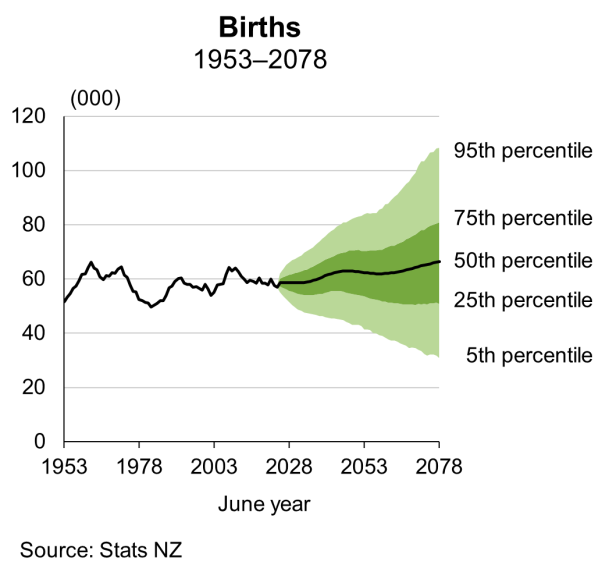
Text alternative for Births, 1953-2078

Text alternative for Deaths, 1953-2078
The future number of deaths is more certain. Deaths are expected to increase steadily despite assumed lower death rates and increasing life expectancy. From about 38,000 deaths in the 2024 June year, it is likely that annual deaths will exceed 40,000 by the early 2030s and exceed 50,000 by the mid-2040s. Deaths will rise as more people reach the older ages, where most deaths occur. From 2020 to 2024, about 4 in 5 male deaths and 5 in 6 female deaths occurred at ages 65 and over (65+).
With deaths rising faster than births, annual natural increase (births minus deaths) is likely to decrease. From about 20,000 in 2024, there is roughly a 1 in 4 chance that annual natural increase will be under 10,000 by the mid-2030s. By the late 2040s, there is roughly a 1 in 4 chance of natural decrease - more deaths than births.

Text alternative for Natural increase, 1953-2078
| At 30 June | 0-14 years | 15-39 years | 40-64 years | 65+ years |
| 1953 | 637100 | 720300 | 528600 | 188700 |
| 1954 | 659300 | 728300 | 538900 | 191900 |
| 1955 | 679500 | 740800 | 549300 | 195200 |
| 1956 | 697200 | 754000 | 558900 | 199300 |
| 1957 | 722300 | 768700 | 570600 | 201300 |
| 1958 | 747900 | 782800 | 581900 | 203400 |
| 1959 | 771600 | 791000 | 591800 | 205400 |
| 1960 | 793000 | 801400 | 601900 | 207300 |
| 1961 | 813700 | 824000 | 614400 | 209100 |
| 1962 | 829400 | 846500 | 627800 | 212200 |
| 1963 | 845200 | 868400 | 639300 | 214100 |
| 1964 | 859000 | 890100 | 651600 | 216300 |
| 1965 | 871500 | 909100 | 662000 | 221200 |
| 1966 | 881100 | 931700 | 673400 | 225200 |
| 1967 | 890000 | 943300 | 682600 | 229000 |
| 1968 | 896000 | 954100 | 689900 | 232900 |
| 1969 | 901000 | 970900 | 696500 | 235600 |
| 1970 | 905800 | 998200 | 706200 | 241900 |
| 1971 | 915600 | 1023700 | 711400 | 247800 |
| 1972 | 924700 | 1061900 | 718700 | 254400 |
| 1973 | 932500 | 1106100 | 725100 | 261300 |
| 1974 | 937300 | 1154700 | 732700 | 267300 |
| 1975 | 937100 | 1189500 | 738200 | 278900 |
| 1976 | 926200 | 1186500 | 722800 | 275000 |
| 1977 | 910000 | 1205000 | 723500 | 281800 |
| 1978 | 889400 | 1219900 | 724500 | 287400 |
| 1979 | 870100 | 1224300 | 721400 | 293300 |
| 1980 | 853800 | 1235700 | 724300 | 299200 |
| 1981 | 841600 | 1242000 | 734600 | 306700 |
| 1982 | 830900 | 1266800 | 743900 | 314500 |
| 1983 | 824000 | 1302500 | 754000 | 318900 |
| 1984 | 815200 | 1326800 | 761400 | 323600 |
| 1985 | 804100 | 1338300 | 774000 | 330700 |
| 1986 | 791600 | 1332900 | 783600 | 338200 |
| 1987 | 783400 | 1348000 | 798900 | 344100 |
| 1988 | 773700 | 1349300 | 809400 | 350900 |
| 1989 | 772400 | 1340100 | 828200 | 358600 |
| 1990 | 777800 | 1344700 | 840400 | 366900 |
| 1991 | 807200 | 1399100 | 897500 | 391300 |
| 1992 | 814300 | 1402500 | 915300 | 399600 |
| 1993 | 824700 | 1405700 | 934100 | 407800 |
| 1994 | 835300 | 1412200 | 956600 | 415900 |
| 1995 | 847500 | 1421100 | 981400 | 423400 |
| 1996 | 859500 | 1433900 | 1008500 | 430100 |
| 1997 | 869500 | 1437200 | 1038300 | 436300 |
| 1998 | 876300 | 1429600 | 1067000 | 442200 |
| 1999 | 877300 | 1413600 | 1096200 | 447900 |
| 2000 | 878700 | 1400700 | 1124900 | 453500 |
| 2001 | 877200 | 1388800 | 1153900 | 460600 |
| 2002 | 883600 | 1405700 | 1191800 | 467500 |
| 2003 | 890000 | 1430700 | 1230900 | 475700 |
| 2004 | 893100 | 1443400 | 1266400 | 484600 |
| 2005 | 890200 | 1452100 | 1295200 | 496400 |
| 2006 | 888300 | 1463700 | 1321000 | 511600 |
| 2007 | 891300 | 1463700 | 1343500 | 525300 |
| 2008 | 895500 | 1460400 | 1368800 | 535000 |
| 2009 | 901100 | 1461000 | 1392100 | 548300 |
| 2010 | 908100 | 1464600 | 1414400 | 563500 |
| 2011 | 910700 | 1459100 | 1434100 | 580100 |
| 2012 | 909800 | 1450500 | 1444700 | 603000 |
| 2013 | 908800 | 1452300 | 1455000 | 626000 |
| 2014 | 911700 | 1484500 | 1471700 | 648500 |
| 2015 | 916200 | 1533800 | 1489200 | 670200 |
| 2016 | 924600 | 1590000 | 1507500 | 692000 |
| 2017 | 936800 | 1637100 | 1525800 | 713800 |
| 2018 | 946400 | 1676900 | 1542300 | 734900 |
| 2019 | 956700 | 1703200 | 1553400 | 757100 |
| 2020 | 967200 | 1745800 | 1573300 | 786100 |
| 2021 | 968300 | 1733100 | 1574800 | 808200 |
| 2022 | 963600 | 1718900 | 1572500 | 826800 |
| 2023 | 970000 | 1786300 | 1595800 | 848000 |
| 2024 | 976800 | 1824200 | 1615100 | 873900 |
| 2025 | 968800 | 1836700 | 1629100 | 902100 |
| 2026 | 961900 | 1850200 | 1643300 | 932200 |
| 2027 | 955700 | 1861400 | 1660200 | 963300 |
| 2028 | 949800 | 1870300 | 1680600 | 994100 |
| 2029 | 945500 | 1877000 | 1704000 | 1023100 |
| 2030 | 941100 | 1881100 | 1732700 | 1049800 |
| 2031 | 937400 | 1883200 | 1763700 | 1075100 |
| 2032 | 933700 | 1886200 | 1793600 | 1100200 |
| 2033 | 930900 | 1889900 | 1821100 | 1125500 |
| 2034 | 927900 | 1896500 | 1844700 | 1151400 |
| 2035 | 926300 | 1902800 | 1867700 | 1176400 |
| 2036 | 924300 | 1911700 | 1886700 | 1203000 |
| 2037 | 923000 | 1922000 | 1904600 | 1228000 |
| 2038 | 926300 | 1928800 | 1923700 | 1250600 |
| 2039 | 930100 | 1937500 | 1942600 | 1270600 |
| 2040 | 933300 | 1945100 | 1965900 | 1287900 |
| 2041 | 936700 | 1953600 | 1989800 | 1303100 |
| 2042 | 940500 | 1963800 | 2011400 | 1318300 |
| 2043 | 944700 | 1973400 | 2033900 | 1332400 |
| 2044 | 949100 | 1981300 | 2055800 | 1348300 |
| 2045 | 953700 | 1988800 | 2076500 | 1365100 |
| 2046 | 958500 | 1994900 | 2097200 | 1382900 |
| 2047 | 963200 | 1996100 | 2120600 | 1402200 |
| 2048 | 967900 | 1994800 | 2144600 | 1423100 |
| 2049 | 972400 | 1994100 | 2166500 | 1445100 |
| 2050 | 976500 | 1992100 | 2188200 | 1468200 |
| 2051 | 980100 | 1990500 | 2208300 | 1492500 |
| 2052 | 983300 | 1989300 | 2224900 | 1519800 |
| 2053 | 985900 | 1988600 | 2238300 | 1549900 |
| 2054 | 987900 | 1989500 | 2249000 | 1581200 |
| 2055 | 989400 | 1990700 | 2256700 | 1615300 |
| 2056 | 990300 | 1993000 | 2262400 | 1650400 |
| 2057 | 990800 | 1995500 | 2268900 | 1684800 |
| 2058 | 990900 | 1999100 | 2276000 | 1717500 |
| 2059 | 990700 | 2002800 | 2286000 | 1747500 |
| 2060 | 990400 | 2007700 | 2295600 | 1776600 |
| 2061 | 990100 | 2012000 | 2307600 | 1803900 |
| 2062 | 989900 | 2016700 | 2321000 | 1829400 |
| 2063 | 989800 | 2025600 | 2330900 | 1854100 |
| 2064 | 990000 | 2034500 | 2342600 | 1876700 |
| 2065 | 990500 | 2042100 | 2353200 | 1901500 |
| 2066 | 991300 | 2049500 | 2364800 | 1925300 |
| 2067 | 992500 | 2056700 | 2377800 | 1947300 |
| 2068 | 994200 | 2063800 | 2390400 | 1969500 |
| 2069 | 996300 | 2070800 | 2401300 | 1993100 |
| 2070 | 998800 | 2077700 | 2411700 | 2016600 |
| 2071 | 1001700 | 2084400 | 2420700 | 2040900 |
| 2072 | 1004900 | 2091100 | 2425200 | 2069200 |
| 2073 | 1008500 | 2097600 | 2427100 | 2099400 |
| 2074 | 1012300 | 2104000 | 2429600 | 2128200 |
| 2075 | 1016400 | 2110200 | 2430900 | 2157600 |
| 2076 | 1020600 | 2116200 | 2432600 | 2185900 |
| 2077 | 1024900 | 2121900 | 2434600 | 2213300 |
| 2078 | 1029300 | 2127300 | 2437100 | 2239600 |
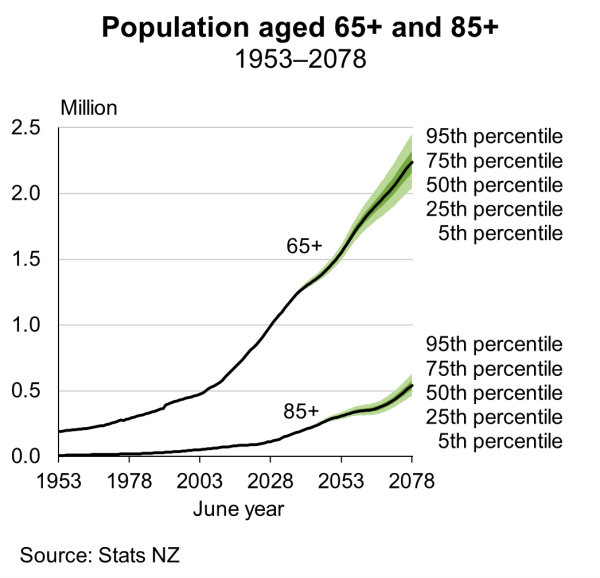
Text alternative for Population aged 65+ and 85+, 1953-2078
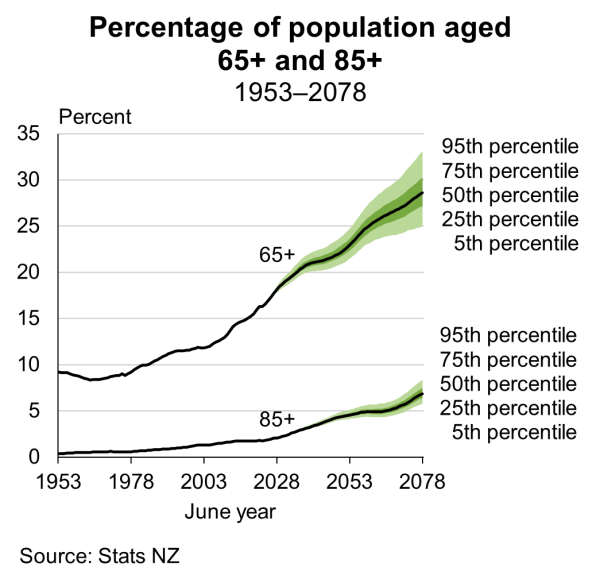
Text alternative for Percentage of population aged 65+ and 85+, 1953-2078
Within the 65+ age group, the number of people aged 85 years and over (85+) is expected to increase significantly. It is expected that 275,000 to 322,000 people will be aged 85+ in 2051, and 459,000 to 628,000 in 2078, up from 95,000 in 2024.
By the 2050s, about 1 in 5 people aged 65+ will be 85+, compared with around 1 in 9 in 2024.
More aged 65+ relative to those aged 15 to 64
Dependency ratios relate the number of people in the 'dependent' age groups (defined here as 0 to 14 years and 65+) to the working-age population (15 to 64 years). They indicate changes in New Zealand's age structure. However, because of their simplicity, dependency ratios ignore that some people in the working-age population are not in the workforce, and that some people aged 65+ are in the workforce. For those aged 65+, the term 'dependency' does not necessarily imply financial or economic dependency, given people are progressively living longer, are healthier, and are working longer.
The 65+ dependency ratio (the number of people aged 65+ per 100 people aged 15 to 64 years) increased gradually from 14 per 100 in the mid-1960s to 25 per 100 in 2024. It is projected to increase significantly, with the ratio expected to be in the range of 31 to 34 per 100 in 2038, 33 to 38 per 100 in 2051, and 43 to 57 per 100 in 2078.
This means that for every person aged 65+, there will be about 3.1 people aged 15 to 64 years in 2038, 2.8 in 2051, and 2.0 in 2078. This compares with 3.9 people in 2024 and 7.1 in the mid-1960s.
In contrast, the 0-14 dependency ratio (the number of people aged 0 to 14 years per 100 people aged 15 to 64 years) decreased from a peak of 57 per 100 in 1961 to 28 per 100 in 2024. This downward trend is likely to continue, with the ratio expected to be in the range of 21 to 27 per 100 in 2038, 18 to 28 per 100 in 2051, and 14 to 31 per 100 in 2078.
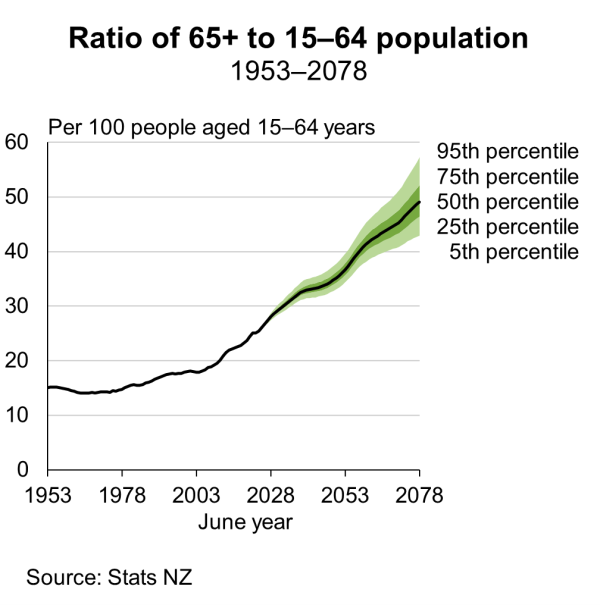
Text alternative for Ratio of 65+ to 15-64 population, 1953-2078
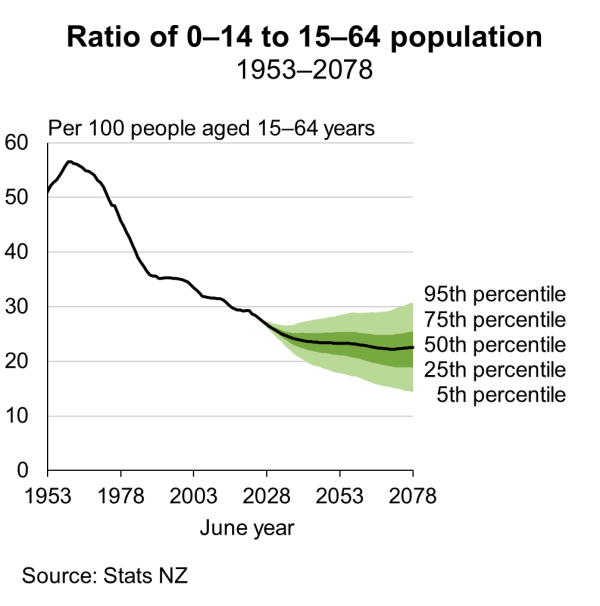
Text alternative for Ratio of 0-14 to 15-64 population, 1953-2078
The total dependency ratio (sum of the 0-14 and 65+ dependency ratios) reached its lowest level since the mid-1930s in 2006 (50 per 100). It is projected to increase from 54 per 100 in 2024, to be in the range of 53 to 60 per 100 in 2038, 54 to 64 per 100 in 2051, and 66 to 78 per 100 in 2078.
The 65+ dependency ratio will then contribute more than two-thirds to the total dependency ratio, compared with nearly half in 2024. A total dependency ratio of over 70 per 100 was also experienced in the early 1960s, when the 65+ dependency ratio contributed about one-fifth to the total dependency ratio.
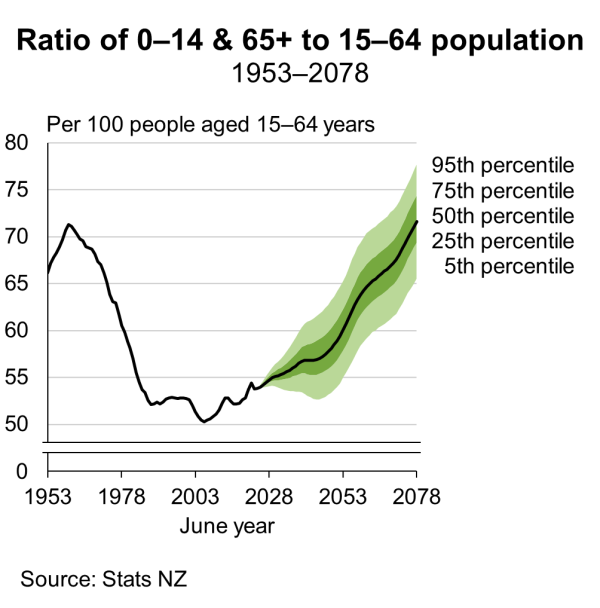
Text alternative for Ratio of 0-14 and 65+ to 15-64 population, 1953-2078
| Year | Very high migration | Very high fertility | Very low mortality | Cyclic migration | 50th percentile | Very low fertility | No migration |
| 2024 | 5290100 | 5290100 | 5290100 | 5290100 | 5290100 | 5290100 | 5290100 |
| 2025 | 5336700 | 5337700 | 5337000 | 5336700 | 5336700 | 5332900 | 5311400 |
| 2026 | 5407900 | 5392200 | 5388500 | 5387700 | 5387700 | 5378100 | 5331400 |
| 2027 | 5503900 | 5450800 | 5442100 | 5440600 | 5440600 | 5423100 | 5350200 |
| 2028 | 5625100 | 5512700 | 5497300 | 5494800 | 5494800 | 5467500 | 5367500 |
| 2029 | 5746600 | 5577200 | 5553500 | 5559700 | 5549600 | 5510900 | 5383300 |
| 2030 | 5868200 | 5643700 | 5610100 | 5635100 | 5604700 | 5553000 | 5397600 |
| 2031 | 5990000 | 5711400 | 5666700 | 5720600 | 5659500 | 5593300 | 5410500 |
| 2032 | 6112000 | 5780000 | 5723100 | 5816100 | 5713700 | 5631700 | 5421900 |
| 2033 | 6234100 | 5849300 | 5779200 | 5881400 | 5767300 | 5668400 | 5431900 |
| 2034 | 6356400 | 5919400 | 5835100 | 5916200 | 5820500 | 5703600 | 5440700 |
| 2035 | 6478900 | 5990000 | 5890900 | 5919900 | 5873200 | 5737300 | 5448200 |
| 2036 | 6601700 | 6061200 | 5946700 | 5942600 | 5925600 | 5769900 | 5454600 |
| 2037 | 6724600 | 6132900 | 6002400 | 5984600 | 5977600 | 5801400 | 5460000 |
| 2038 | 6847800 | 6205000 | 6058200 | 6036300 | 6029400 | 5832100 | 5464400 |
| 2039 | 6971200 | 6277400 | 6114100 | 6097700 | 6080900 | 5862100 | 5467800 |
| 2040 | 7094800 | 6349900 | 6170000 | 6169100 | 6132100 | 5891600 | 5470400 |
| 2041 | 7218500 | 6422400 | 6226100 | 6250600 | 6183200 | 5920700 | 5472000 |
| 2042 | 7342300 | 6494900 | 6282200 | 6342400 | 6233900 | 5949500 | 5472700 |
| 2043 | 7466100 | 6567200 | 6338300 | 6404300 | 6284400 | 5977800 | 5472400 |
| 2044 | 7589800 | 6639300 | 6394400 | 6435700 | 6334500 | 6005700 | 5471100 |
| 2045 | 7713400 | 6711200 | 6450300 | 6436100 | 6384200 | 6033100 | 5468700 |
| 2046 | 7836800 | 6782800 | 6506200 | 6455400 | 6433500 | 6060000 | 5465200 |
| 2047 | 7959900 | 6854000 | 6561800 | 6493900 | 6482200 | 6086200 | 5460500 |
| 2048 | 8082700 | 6924800 | 6617100 | 6541700 | 6530400 | 6111900 | 5454600 |
| 2049 | 8205100 | 6995300 | 6672200 | 6599000 | 6578000 | 6136800 | 5447600 |
| 2050 | 8327100 | 7065500 | 6727000 | 6666000 | 6625000 | 6161000 | 5439300 |
| 2051 | 8448700 | 7135400 | 6781400 | 6742800 | 6671500 | 6184400 | 5429800 |
| 2052 | 8569900 | 7205100 | 6835500 | 6829500 | 6717300 | 6207100 | 5419100 |
| 2053 | 8690800 | 7274800 | 6889300 | 6886200 | 6762700 | 6229100 | 5407400 |
| 2054 | 8811300 | 7344600 | 6942900 | 6912300 | 6807500 | 6250200 | 5394500 |
| 2055 | 8931600 | 7414700 | 6996300 | 6907400 | 6852000 | 6270600 | 5380700 |
| 2056 | 9051600 | 7485200 | 7049500 | 6921500 | 6896100 | 6290200 | 5365900 |
| 2057 | 9171500 | 7556400 | 7102700 | 6954900 | 6939900 | 6309000 | 5350300 |
| 2058 | 9291200 | 7628400 | 7155800 | 6998100 | 6983500 | 6327100 | 5333800 |
| 2059 | 9410900 | 7701400 | 7208900 | 7051200 | 7027000 | 6344500 | 5316600 |
| 2060 | 9530600 | 7775500 | 7262200 | 7114400 | 7070400 | 6361200 | 5298700 |
| 2061 | 9650300 | 7850900 | 7315600 | 7188000 | 7113700 | 6377200 | 5280200 |
| 2062 | 9770000 | 7927500 | 7369200 | 7272100 | 7157000 | 6392600 | 5261000 |
| 2063 | 9889800 | 8005500 | 7423000 | 7326700 | 7200400 | 6407300 | 5241200 |
| 2064 | 10009600 | 8084800 | 7477100 | 7351200 | 7243800 | 6421500 | 5220900 |
| 2065 | 10129400 | 8165300 | 7531600 | 7345300 | 7287300 | 6435200 | 5200100 |
| 2066 | 10249200 | 8247100 | 7586300 | 7358700 | 7330800 | 6448400 | 5178700 |
| 2067 | 10368900 | 8330000 | 7641300 | 7391800 | 7374400 | 6461000 | 5156900 |
| 2068 | 10488500 | 8413900 | 7696700 | 7434700 | 7417900 | 6473200 | 5134500 |
| 2069 | 10607700 | 8498700 | 7752300 | 7487600 | 7461400 | 6484900 | 5111500 |
| 2070 | 10726500 | 8584000 | 7808200 | 7550600 | 7504700 | 6496000 | 5088000 |
| 2071 | 10844800 | 8669900 | 7864300 | 7623600 | 7547700 | 6506500 | 5063800 |
| 2072 | 10962300 | 8756000 | 7920600 | 7706800 | 7590400 | 6516200 | 5038900 |
| 2073 | 11078900 | 8842300 | 7976900 | 7759900 | 7632600 | 6525300 | 5013200 |
| 2074 | 11194400 | 8928500 | 8033100 | 7782300 | 7674100 | 6533400 | 4986700 |
| 2075 | 11308700 | 9014500 | 8089300 | 7773500 | 7715100 | 6540700 | 4959300 |
| 2076 | 11421700 | 9100300 | 8145300 | 7783200 | 7755300 | 6547100 | 4931100 |
| 2077 | 11533300 | 9185700 | 8201100 | 7811700 | 7794700 | 6552500 | 4901900 |
| 2078 | 11643500 | 9270700 | 8256600 | 7849300 | 7833300 | 6556900 | 4871900 |
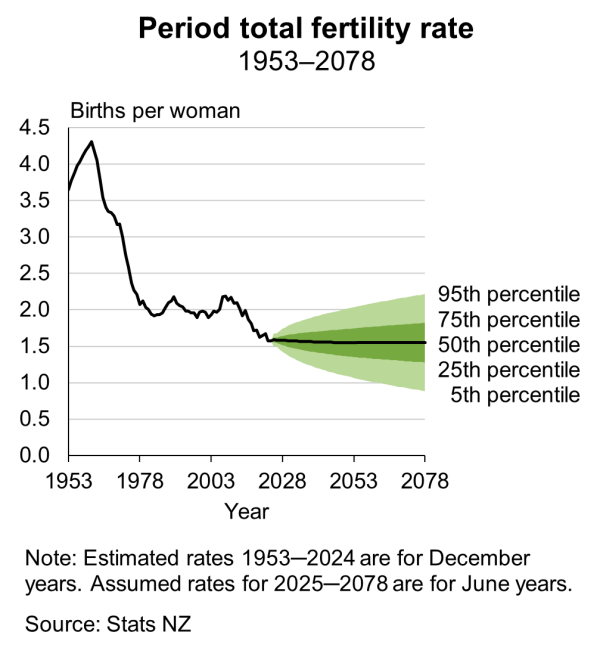
Text alternative for Period total fertility rate, 1953-2078
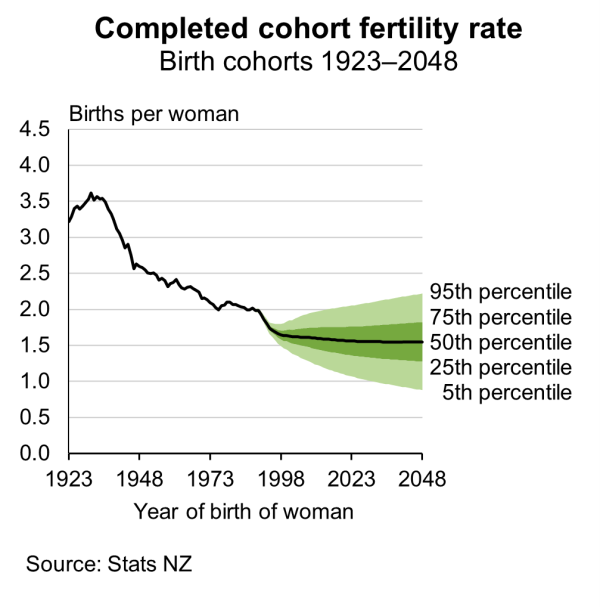
Text alternative for Completed cohort fertility rate, birth cohorts 1923-2048
| Year | 15 years | 20 years | 25 years | 30 years | 35 years | 40 years | 45 years |
| 1968 | 6.15 | 172.06 | 239.47 | 146.71 | 68 | 23.75 | 3.25 |
| 1969 | 7.2 | 163.57 | 246.4 | 146.29 | 67.32 | 26.88 | 2.91 |
| 1970 | 6.65 | 166.05 | 235.38 | 135.47 | 63.45 | 21.46 | 2.31 |
| 1971 | 7.91 | 165.9 | 225.65 | 137.97 | 57.38 | 21.94 | 1.92 |
| 1972 | 9.28 | 158.11 | 222.92 | 124.52 | 55.17 | 19.34 | 2.55 |
| 1973 | 10.18 | 148.32 | 208.57 | 117.83 | 47.78 | 15.2 | 2.06 |
| 1974 | 11.01 | 137.3 | 199.41 | 106.98 | 41.96 | 14.03 | 1.49 |
| 1975 | 9.43 | 124.55 | 188.69 | 101.59 | 34.69 | 12.49 | 1.78 |
| 1976 | 8.9 | 116.7 | 179.21 | 93.24 | 32.49 | 9.93 | 1.53 |
| 1977 | 9.41 | 111.22 | 171.73 | 100.16 | 33.94 | 11.06 | 0.54 |
| 1978 | 8.38 | 98.32 | 168.04 | 96.03 | 33.93 | 7.48 | 0.75 |
| 1979 | 6.59 | 96.53 | 172.65 | 100.69 | 35.5 | 8.01 | 0.85 |
| 1980 | 6.48 | 95.06 | 163.5 | 97.23 | 33.78 | 7.17 | 1.07 |
| 1981 | 5.37 | 91.93 | 159.31 | 99.71 | 30.28 | 7.83 | 0.34 |
| 1982 | 5.21 | 81.56 | 154.16 | 104.44 | 33.77 | 7.71 | 1.05 |
| 1983 | 4.86 | 77.25 | 147.86 | 103.53 | 33.36 | 7.91 | 0.58 |
| 1984 | 5.23 | 73.19 | 157.22 | 111.11 | 35.95 | 7.58 | 0.55 |
| 1985 | 4.76 | 67.8 | 149.36 | 110.81 | 37.86 | 7.37 | 0.56 |
| 1986 | 4.32 | 73.76 | 140.25 | 121.07 | 40.48 | 7.74 | 0.53 |
| 1987 | 4.73 | 74.48 | 141.87 | 122.64 | 45.61 | 7.59 | 0.7 |
| 1988 | 4.66 | 76.76 | 145.51 | 129.28 | 50.48 | 9.71 | 0.88 |
| 1989 | 4.43 | 72.5 | 141.21 | 132.43 | 51.4 | 10.43 | 0.91 |
| 1990 | 5 | 74.1 | 138.95 | 140.41 | 60.91 | 10.99 | 0.72 |
| 1991 | 5.5 | 73.08 | 135.15 | 133.88 | 60.51 | 12 | 0.51 |
| 1992 | 4.26 | 71.18 | 124.85 | 136.29 | 64.62 | 13.19 | 0.7 |
| 1993 | 4.63 | 69.62 | 119.84 | 132.26 | 66.52 | 13.24 | 0.89 |
| 1994 | 5.15 | 65.88 | 114.49 | 126.34 | 65.14 | 14.91 | 1.06 |
| 1995 | 5.67 | 67.49 | 109.52 | 130.44 | 66.47 | 15.15 | 1.16 |
| 1996 | 4.97 | 65.8 | 106.21 | 122.67 | 68.71 | 16.76 | 1.24 |
| 1997 | 5.43 | 67.38 | 100.52 | 125.7 | 72.78 | 18.54 | 1.06 |
| 1998 | 3.7 | 62.38 | 98.7 | 122.49 | 73.34 | 16.5 | 1 |
| 1999 | 4.11 | 66.24 | 103.14 | 130.27 | 75.69 | 18.17 | 1.12 |
| 2000 | 4.45 | 64.09 | 98.9 | 124.98 | 83.69 | 20.13 | 0.84 |
| 2001 | 4.4 | 62.98 | 101.65 | 125.48 | 79.32 | 21.33 | 1.49 |
| 2002 | 3.55 | 56.39 | 93.07 | 117.62 | 82.64 | 21.73 | 1.42 |
| 2003 | 3.86 | 54.24 | 93.2 | 119.92 | 86.84 | 25.13 | 1.21 |
| 2004 | 4.09 | 57.15 | 91.29 | 125.74 | 89.65 | 24.32 | 1.71 |
| 2005 | 3.97 | 56.56 | 90.52 | 122.73 | 89.01 | 23.8 | 1.63 |
| 2006 | 3.57 | 60.58 | 89.4 | 118.84 | 92.98 | 26.41 | 1.67 |
| 2007 | 5.11 | 68.48 | 95.22 | 129.12 | 102.45 | 30.27 | 1.64 |
| 2008 | 5.29 | 70.21 | 97.89 | 130.29 | 104.88 | 27.48 | 1.95 |
| 2009 | 3.83 | 68.6 | 95.71 | 128.28 | 101.63 | 30.41 | 1.61 |
| 2010 | 3.83 | 67.21 | 96.62 | 130.79 | 101.73 | 29.92 | 2.31 |
| 2011 | 3.26 | 62.72 | 92.34 | 124.13 | 98.87 | 29.55 | 2.09 |
| 2012 | 2.95 | 59.48 | 91.08 | 128.73 | 101.56 | 30.32 | 1.89 |
| 2013 | 2.81 | 53.98 | 87.7 | 123.03 | 97.22 | 29.82 | 2.66 |
| 2014 | 2.45 | 48.42 | 84.23 | 120.31 | 92.09 | 29.65 | 1.62 |
| 2015 | 2.57 | 49.15 | 86.87 | 127.39 | 97.5 | 32.3 | 2.41 |
| 2016 | 1.97 | 43.03 | 76.99 | 120.59 | 97.13 | 27.82 | 1.82 |
| 2017 | 1.81 | 43.39 | 78.83 | 118.88 | 90.4 | 29.18 | 2.09 |
| 2018 | 2.03 | 38.52 | 73.36 | 110.71 | 89.06 | 27.8 | 2.23 |
| 2019 | 1.29 | 37.4 | 73.72 | 110.99 | 90.16 | 29.34 | 2.57 |
| 2020 | 1.37 | 34.78 | 67.46 | 107.36 | 85.57 | 26.76 | 2.26 |
| 2021 | 1.54 | 33.32 | 68.1 | 109.83 | 88.34 | 26.27 | 1.86 |
| 2022 | 1.19 | 34.99 | 72.05 | 109.94 | 91.52 | 27.19 | 1.86 |
| 2023 | 1.32 | 33.22 | 64.55 | 103.8 | 84.5 | 25.25 | 1.92 |
| 2024 | 1.23 | 31.51 | 66.53 | 102.79 | 84.31 | 26.69 | 1.85 |
| 2025 | 1.44 | 32.78 | 67.4 | 104 | 84.75 | 26.01 | 1.89 |
| 2026 | 1.39 | 32.09 | 66.81 | 104.03 | 85.24 | 26.25 | 1.92 |
| 2027 | 1.34 | 31.42 | 66.23 | 104.07 | 85.72 | 26.49 | 1.94 |
| 2028 | 1.29 | 30.78 | 65.68 | 104.09 | 86.18 | 26.71 | 1.96 |
| 2029 | 1.25 | 30.16 | 65.14 | 104.12 | 86.62 | 26.93 | 1.98 |
| 2030 | 1.2 | 29.57 | 64.63 | 104.15 | 87.05 | 27.13 | 2 |
| 2031 | 1.16 | 29 | 64.14 | 104.18 | 87.46 | 27.33 | 2.02 |
| 2032 | 1.12 | 28.45 | 63.67 | 104.2 | 87.85 | 27.52 | 2.04 |
| 2033 | 1.08 | 27.93 | 63.21 | 104.22 | 88.23 | 27.71 | 2.06 |
| 2034 | 1.05 | 27.43 | 62.78 | 104.25 | 88.59 | 27.88 | 2.08 |
| 2035 | 1.01 | 26.95 | 62.37 | 104.27 | 88.93 | 28.05 | 2.09 |
| 2036 | 0.98 | 26.5 | 61.98 | 104.29 | 89.25 | 28.21 | 2.11 |
| 2037 | 0.95 | 26.07 | 61.61 | 104.31 | 89.56 | 28.36 | 2.13 |
| 2038 | 0.92 | 25.67 | 61.27 | 104.33 | 89.85 | 28.5 | 2.14 |
| 2039 | 0.89 | 25.29 | 60.94 | 104.34 | 90.12 | 28.63 | 2.15 |
| 2040 | 0.86 | 24.93 | 60.63 | 104.36 | 90.38 | 28.75 | 2.16 |
| 2041 | 0.84 | 24.6 | 60.34 | 104.38 | 90.62 | 28.87 | 2.18 |
| 2042 | 0.82 | 24.29 | 60.07 | 104.39 | 90.84 | 28.98 | 2.19 |
| 2043 | 0.8 | 24.01 | 59.83 | 104.4 | 91.04 | 29.08 | 2.2 |
| 2044 | 0.78 | 23.74 | 59.6 | 104.41 | 91.23 | 29.17 | 2.21 |
| 2045 | 0.76 | 23.51 | 59.4 | 104.43 | 91.4 | 29.25 | 2.21 |
| 2046 | 0.74 | 23.29 | 59.21 | 104.44 | 91.55 | 29.33 | 2.22 |
| 2047 | 0.73 | 23.1 | 59.05 | 104.44 | 91.69 | 29.39 | 2.23 |
| 2048 | 0.72 | 22.94 | 58.91 | 104.45 | 91.81 | 29.45 | 2.23 |
| 2049 | 0.71 | 22.79 | 58.78 | 104.46 | 91.91 | 29.5 | 2.24 |
| 2050 | 0.7 | 22.67 | 58.68 | 104.46 | 92 | 29.54 | 2.24 |
| 2051 | 0.69 | 22.58 | 58.6 | 104.47 | 92.07 | 29.58 | 2.25 |
| 2052 | 0.69 | 22.51 | 58.54 | 104.47 | 92.12 | 29.6 | 2.25 |
| 2053 | 0.68 | 22.46 | 58.49 | 104.47 | 92.15 | 29.62 | 2.25 |
| 2054 | 0.68 | 22.44 | 58.47 | 104.47 | 92.17 | 29.63 | 2.25 |
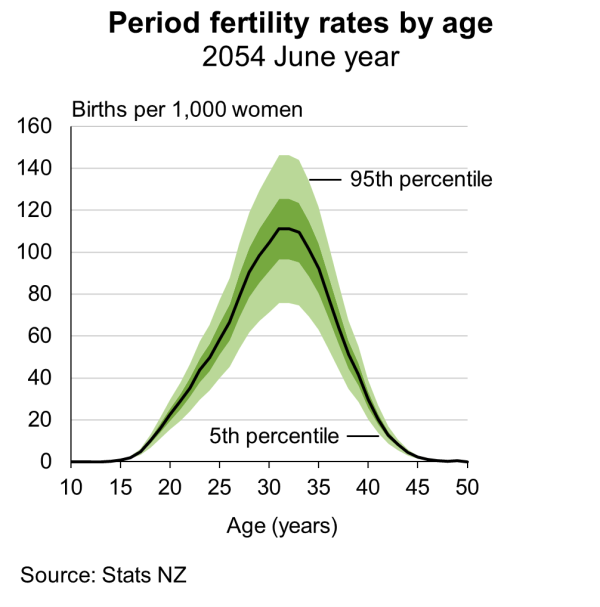
Text alternative for Period fertility rates by age, 2054 June year
| June year | 0 years | 5 years | 20 years | 45 years | 65 years | 75 years | 85 years |
| 1953 | 31.9 | 0.58 | 2.29 | 4.73 | 33.08 | 73.27 | |
| 1954 | 30.51 | 0.81 | 2.54 | 4.36 | 33.71 | 72.27 | |
| 1955 | 28.48 | 0.9 | 2.22 | 4.3 | 34.32 | 72.99 | |
| 1956 | 29.8 | 0.88 | 1.95 | 4.11 | 33.51 | 72.59 | |
| 1957 | 25.92 | 0.99 | 2.05 | 4.29 | 36.29 | 75.51 | |
| 1958 | 28.91 | 0.76 | 2.38 | 4.68 | 36.46 | 74.63 | |
| 1959 | 26.86 | 0.56 | 2.16 | 4.56 | 36.53 | 76.42 | |
| 1960 | 26.94 | 0.53 | 1.68 | 4.05 | 34.9 | 78.05 | |
| 1961 | 26 | 0.69 | 1.28 | 4.31 | 31.5 | 78.74 | |
| 1962 | 26.64 | 0.62 | 1.32 | 4.41 | 32.98 | 80.42 | 204.8 |
| 1963 | 23.88 | 0.49 | 1.59 | 4.59 | 35.65 | 85.67 | 197.48 |
| 1964 | 22.58 | 0.68 | 1.65 | 4.16 | 37.03 | 85.09 | 170.75 |
| 1965 | 21.94 | 0.54 | 1.67 | 4.39 | 36.98 | 83.41 | 170.97 |
| 1966 | 22.73 | 0.5 | 1.78 | 4.48 | 36.03 | 84.43 | 191.34 |
| 1967 | 21.5 | 0.65 | 1.76 | 5.13 | 36.98 | 82.9 | 183.29 |
| 1968 | 21.56 | 0.58 | 1.88 | 4.75 | 35.05 | 78.86 | 175.07 |
| 1969 | 21.82 | 0.6 | 2.03 | 4.28 | 34.86 | 85.16 | 181.1 |
| 1970 | 20.19 | 0.57 | 1.48 | 4.7 | 36.13 | 89.61 | 177.45 |
| 1971 | 18.87 | 0.57 | 1.21 | 4.69 | 36.13 | 88.83 | 191.34 |
| 1972 | 18.1 | 0.56 | 2.07 | 4.18 | 35.61 | 88.05 | 182.9 |
| 1973 | 18.2 | 0.47 | 2.53 | 4.32 | 35.93 | 82.43 | 177.33 |
| 1974 | 19.55 | 0.46 | 1.89 | 4.13 | 34.78 | 80.54 | 183.67 |
| 1975 | 18.62 | 0.56 | 1.45 | 4.14 | 33.81 | 77.04 | 188.07 |
| 1976 | 18.5 | 0.61 | 1.64 | 4.31 | 32.65 | 74.85 | 175.11 |
| 1977 | 16.15 | 0.48 | 2.08 | 3.79 | 33.89 | 77.26 | 172.37 |
| 1978 | 17.13 | 0.37 | 2.09 | 3.65 | 30.76 | 75.22 | 161.06 |
| 1979 | 16.37 | 0.42 | 1.86 | 4.17 | 30.14 | 73.89 | 151.44 |
| 1980 | 14.51 | 0.43 | 1.93 | 4.04 | 29.97 | 73.95 | 175.89 |
| 1981 | 13.35 | 0.4 | 1.78 | 3.7 | 30.46 | 74.02 | 173.49 |
| 1982 | 13.36 | 0.59 | 2.04 | 3.29 | 27.12 | 69.48 | 169.59 |
| 1983 | 13.64 | 0.38 | 1.82 | 3.84 | 26.55 | 70.53 | 168.72 |
| 1984 | 13.57 | 0.46 | 1.77 | 2.78 | 29.53 | 76.23 | 173.52 |
| 1985 | 13.75 | 0.34 | 1.68 | 2.93 | 25.85 | 68.54 | 169.89 |
| 1986 | 11.79 | 0.27 | 1.37 | 3.51 | 28.82 | 73.46 | 162.77 |
| 1987 | 12.68 | 0.38 | 2.21 | 3.02 | 26.1 | 61.84 | 173.72 |
| 1988 | 11 | 0.46 | 2.13 | 2.36 | 25.69 | 70.3 | 142.15 |
| 1989 | 12.62 | 0.35 | 1.97 | 2.96 | 23.92 | 68.3 | 159.66 |
| 1990 | 11.96 | 0.46 | 1.9 | 2.74 | 23.15 | 65.58 | 147.01 |
| 1991 | 9.43 | 0.11 | 1.92 | 2.7 | 23.56 | 58.96 | 149.25 |
| 1992 | 9.6 | 0.26 | 2.04 | 2.62 | 24.76 | 55.16 | 125.2 |
| 1993 | 8.01 | 0.21 | 1.65 | 2.35 | 21.82 | 60.73 | 152.16 |
| 1994 | 7.61 | 0.24 | 1.75 | 2.41 | 20.06 | 60.88 | 152.74 |
| 1995 | 7.59 | 0.26 | 1.39 | 2.1 | 22.49 | 52.83 | 143.6 |
| 1996 | 6.73 | 0.19 | 1.73 | 2.63 | 19.81 | 58.17 | 158.32 |
| 1997 | 7.86 | 0.28 | 1.76 | 2.12 | 21.58 | 52.07 | 154.55 |
| 1998 | 6.89 | 0.25 | 1.19 | 2.72 | 17.07 | 48.92 | 147.87 |
| 1999 | 6.93 | 0.13 | 1.57 | 2.02 | 17.9 | 48.17 | 134.25 |
| 2000 | 6.43 | 0.16 | 1.12 | 2.13 | 15.53 | 46.41 | 134.08 |
| 2001 | 7.16 | 0.23 | 1.09 | 2.21 | 16.18 | 46.67 | 118.43 |
| 2002 | 5.85 | 0.17 | 1.13 | 2.16 | 15.54 | 44.1 | 131.64 |
| 2003 | 6.15 | 0.2 | 0.89 | 2.12 | 16.31 | 36.55 | 132.74 |
| 2004 | 6.24 | 0.1 | 1.13 | 2.53 | 13.01 | 41.25 | 122.56 |
| 2005 | 5.89 | 0.1 | 1.09 | 1.93 | 14.38 | 38.26 | 124.12 |
| 2006 | 6.22 | 0.23 | 1.1 | 2.2 | 13.68 | 34.22 | 112.41 |
| 2007 | 6.4 | 0.2 | 1.22 | 2.39 | 13.38 | 36.43 | 113.5 |
| 2008 | 5.53 | 0.2 | 1.25 | 2.49 | 13.61 | 33.94 | 116.9 |
| 2009 | 5.04 | 0.1 | 0.89 | 2.4 | 12.97 | 35.53 | 104.58 |
| 2010 | 5.51 | 0.13 | 0.71 | 2.15 | 12.28 | 35.99 | 112.82 |
| 2011 | 6.27 | 0.1 | 1.05 | 1.78 | 10.88 | 30.97 | 109.02 |
| 2012 | 5.06 | 0 | 0.79 | 1.88 | 10.62 | 29.31 | 99.87 |
| 2013 | 5.42 | 0.09 | 1.02 | 2.33 | 11.38 | 32.59 | 103.74 |
| 2014 | 5.56 | 0.15 | 0.9 | 1.71 | 9.82 | 30.11 | 104.65 |
| 2015 | 5.18 | 0.12 | 0.49 | 1.77 | 10.15 | 28.33 | 92.71 |
| 2016 | 4.54 | 0.18 | 0.62 | 1.67 | 11.09 | 30.75 | 100.73 |
| 2017 | 4.46 | 0.27 | 0.57 | 1.96 | 10.45 | 27.45 | 102.46 |
| 2018 | 5.08 | 0.15 | 0.91 | 2.09 | 9.71 | 27.42 | 100 |
| 2019 | 4.29 | 0.03 | 0.66 | 1.98 | 9.17 | 27.83 | 97.11 |
| 2020 | 5.16 | 0.15 | 0.57 | 1.99 | 9.85 | 26.97 | 90.81 |
| 2021 | 5.45 | 0.15 | 0.59 | 1.39 | 8.9 | 28.53 | 100.56 |
| 2022 | 5.87 | 0.15 | 0.69 | 2.05 | 10.64 | 29.33 | 99.63 |
| 2023 | 5.75 | 0.13 | 0.76 | 1.76 | 9.51 | 27.82 | 95.07 |
| 2024 | 4.53 | 0.03 | 0.75 | 1.53 | 8.97 | 26.96 | 91.61 |
| 2025 | 5.11 | 0.1 | 0.66 | 1.73 | 9.21 | 25.57 | 91.09 |
| 2026 | 4.93 | 0.1 | 0.64 | 1.7 | 8.92 | 25 | 90.08 |
| 2027 | 4.79 | 0.09 | 0.62 | 1.67 | 8.69 | 24.48 | 88.94 |
| 2028 | 4.65 | 0.09 | 0.61 | 1.64 | 8.48 | 23.98 | 87.84 |
| 2029 | 4.51 | 0.09 | 0.6 | 1.61 | 8.28 | 23.48 | 86.73 |
| 2030 | 4.38 | 0.08 | 0.58 | 1.58 | 8.08 | 22.99 | 85.65 |
| 2031 | 4.25 | 0.08 | 0.57 | 1.56 | 7.88 | 22.52 | 84.58 |
| 2032 | 4.13 | 0.08 | 0.56 | 1.53 | 7.7 | 22.05 | 83.52 |
| 2033 | 4.01 | 0.08 | 0.55 | 1.5 | 7.51 | 21.6 | 82.49 |
| 2034 | 3.9 | 0.07 | 0.54 | 1.48 | 7.34 | 21.15 | 81.47 |
| 2035 | 3.79 | 0.07 | 0.53 | 1.45 | 7.17 | 20.72 | 80.46 |
| 2036 | 3.68 | 0.07 | 0.52 | 1.43 | 7.01 | 20.3 | 79.48 |
| 2037 | 3.58 | 0.07 | 0.51 | 1.4 | 6.85 | 19.89 | 78.5 |
| 2038 | 3.48 | 0.06 | 0.5 | 1.38 | 6.69 | 19.49 | 77.54 |
| 2039 | 3.39 | 0.06 | 0.49 | 1.36 | 6.55 | 19.1 | 76.6 |
| 2040 | 3.3 | 0.06 | 0.48 | 1.33 | 6.4 | 18.71 | 75.67 |
| 2041 | 3.21 | 0.06 | 0.48 | 1.31 | 6.26 | 18.34 | 74.75 |
| 2042 | 3.12 | 0.06 | 0.47 | 1.29 | 6.12 | 17.97 | 73.84 |
| 2043 | 3.04 | 0.05 | 0.46 | 1.27 | 5.99 | 17.62 | 72.95 |
| 2044 | 2.96 | 0.05 | 0.45 | 1.24 | 5.86 | 17.27 | 72.06 |
| 2045 | 2.88 | 0.05 | 0.44 | 1.22 | 5.73 | 16.92 | 71.19 |
| 2046 | 2.81 | 0.05 | 0.44 | 1.2 | 5.61 | 16.59 | 70.34 |
| 2047 | 2.73 | 0.05 | 0.43 | 1.18 | 5.49 | 16.26 | 69.49 |
| 2048 | 2.66 | 0.05 | 0.42 | 1.16 | 5.37 | 15.94 | 68.65 |
| 2049 | 2.59 | 0.05 | 0.42 | 1.14 | 5.26 | 15.63 | 67.82 |
| 2050 | 2.52 | 0.04 | 0.41 | 1.12 | 5.14 | 15.32 | 67.01 |
| 2051 | 2.46 | 0.04 | 0.4 | 1.1 | 5.04 | 15.02 | 66.2 |
| 2052 | 2.4 | 0.04 | 0.4 | 1.08 | 4.93 | 14.72 | 65.41 |
| 2053 | 2.33 | 0.04 | 0.39 | 1.06 | 4.82 | 14.44 | 64.62 |
| 2054 | 2.27 | 0.04 | 0.39 | 1.05 | 4.72 | 14.15 | 63.85 |
| 2055 | 2.22 | 0.04 | 0.38 | 1.03 | 4.62 | 13.88 | 63.08 |
| 2056 | 2.16 | 0.04 | 0.37 | 1.01 | 4.53 | 13.6 | 62.33 |
| 2057 | 2.1 | 0.04 | 0.37 | 0.99 | 4.43 | 13.34 | 61.58 |
| 2058 | 2.05 | 0.03 | 0.36 | 0.98 | 4.34 | 13.08 | 60.84 |
| 2059 | 2 | 0.03 | 0.36 | 0.96 | 4.25 | 12.82 | 60.12 |
| 2060 | 1.95 | 0.03 | 0.35 | 0.94 | 4.16 | 12.57 | 59.4 |
| 2061 | 1.9 | 0.03 | 0.35 | 0.93 | 4.07 | 12.33 | 58.69 |
| 2062 | 1.85 | 0.03 | 0.34 | 0.91 | 3.98 | 12.09 | 57.98 |
| 2063 | 1.8 | 0.03 | 0.34 | 0.9 | 3.9 | 11.85 | 57.29 |
| 2064 | 1.76 | 0.03 | 0.33 | 0.88 | 3.82 | 11.62 | 56.61 |
| 2065 | 1.71 | 0.03 | 0.33 | 0.87 | 3.74 | 11.39 | 55.93 |
| 2066 | 1.67 | 0.03 | 0.32 | 0.85 | 3.66 | 11.17 | 55.26 |
| 2067 | 1.62 | 0.03 | 0.32 | 0.84 | 3.58 | 10.95 | 54.6 |
| 2068 | 1.58 | 0.03 | 0.31 | 0.82 | 3.51 | 10.74 | 53.95 |
| 2069 | 1.54 | 0.02 | 0.31 | 0.81 | 3.44 | 10.53 | 53.31 |
| 2070 | 1.5 | 0.02 | 0.3 | 0.8 | 3.36 | 10.33 | 52.67 |
| 2071 | 1.47 | 0.02 | 0.3 | 0.78 | 3.29 | 10.13 | 52.05 |
| 2072 | 1.43 | 0.02 | 0.29 | 0.77 | 3.23 | 9.93 | 51.43 |
| 2073 | 1.39 | 0.02 | 0.29 | 0.76 | 3.16 | 9.74 | 50.81 |
| 2074 | 1.36 | 0.02 | 0.28 | 0.74 | 3.09 | 9.55 | 50.21 |
| 2075 | 1.32 | 0.02 | 0.28 | 0.73 | 3.03 | 9.36 | 49.61 |
| 2076 | 1.29 | 0.02 | 0.28 | 0.72 | 2.96 | 9.18 | 49.02 |
| 2077 | 1.26 | 0.02 | 0.27 | 0.71 | 2.9 | 9 | 48.44 |
| 2078 | 1.22 | 0.02 | 0.27 | 0.69 | 2.84 | 8.83 | 47.86 |
| June year | 0 years | 5 years | 20 years | 45 years | 65 years | 75 years | 85 years |
| 1953 | 26.38 | 0.64 | 1.19 | 4.1 | 21.94 | 58.88 | |
| 1954 | 22.42 | 0.7 | 0.95 | 3.61 | 20.41 | 59.16 | |
| 1955 | 21.74 | 0.58 | 0.51 | 3.55 | 20.58 | 60.21 | |
| 1956 | 21.73 | 0.34 | 0.58 | 3.56 | 20.82 | 56.96 | |
| 1957 | 21.87 | 0.44 | 0.81 | 3.68 | 19.94 | 51.36 | |
| 1958 | 21.68 | 0.67 | 0.82 | 3.6 | 20.04 | 49.02 | |
| 1959 | 20.94 | 0.59 | 0.55 | 3.47 | 20.26 | 53.3 | |
| 1960 | 21.5 | 0.42 | 0.7 | 3.31 | 19.83 | 54.32 | |
| 1961 | 20.31 | 0.43 | 0.71 | 3.28 | 19.24 | 52.54 | |
| 1962 | 20.27 | 0.43 | 0.43 | 2.95 | 19.61 | 52.01 | 136.69 |
| 1963 | 17.35 | 0.4 | 0.55 | 3.19 | 21.04 | 52.68 | 145.34 |
| 1964 | 17.22 | 0.41 | 0.75 | 3.19 | 20.32 | 54.89 | 144.2 |
| 1965 | 16.36 | 0.39 | 0.53 | 2.96 | 21.2 | 52.46 | 146.64 |
| 1966 | 16.29 | 0.4 | 0.49 | 2.91 | 21.42 | 49.75 | 147.39 |
| 1967 | 15.43 | 0.35 | 0.61 | 2.83 | 21.71 | 49.29 | 139.16 |
| 1968 | 15.93 | 0.34 | 0.49 | 3.15 | 21.35 | 46.31 | 144.31 |
| 1969 | 16.72 | 0.46 | 0.43 | 3.95 | 19.97 | 48.62 | 143.01 |
| 1970 | 14.25 | 0.55 | 0.64 | 3.89 | 18.16 | 55.21 | 137.44 |
| 1971 | 15.19 | 0.44 | 0.82 | 3.5 | 18.59 | 53.07 | 135.28 |
| 1972 | 15.2 | 0.37 | 0.73 | 2.93 | 19.65 | 50.22 | 122.92 |
| 1973 | 14.09 | 0.34 | 0.56 | 2.92 | 18.44 | 49.83 | 124.51 |
| 1974 | 13.7 | 0.33 | 0.62 | 3.08 | 16.65 | 43.71 | 126.37 |
| 1975 | 13.06 | 0.31 | 0.62 | 3.35 | 16.89 | 43.47 | 127.85 |
| 1976 | 13.07 | 0.24 | 0.65 | 3.42 | 16.07 | 43.4 | 120.62 |
| 1977 | 12.25 | 0.38 | 0.57 | 3.09 | 16.57 | 43.86 | 113.87 |
| 1978 | 11.57 | 0.47 | 0.51 | 2.36 | 15.02 | 41.88 | 115.66 |
| 1979 | 11.22 | 0.32 | 0.65 | 2.76 | 15.65 | 41.58 | 109.62 |
| 1980 | 10.14 | 0.33 | 0.65 | 3.19 | 16.63 | 43.31 | 111.34 |
| 1981 | 11.66 | 0.42 | 0.69 | 2.77 | 17.17 | 40.95 | 122.51 |
| 1982 | 10.39 | 0.35 | 0.66 | 2.48 | 14.93 | 37.23 | 117.04 |
| 1983 | 11 | 0.2 | 0.45 | 2.35 | 14.66 | 37.18 | 121.61 |
| 1984 | 11.87 | 0.4 | 0.79 | 2.6 | 13.27 | 39.9 | 106.85 |
| 1985 | 9.27 | 0.12 | 0.6 | 2.09 | 14.99 | 34.54 | 110.48 |
| 1986 | 9.25 | 0.24 | 0.71 | 2.8 | 13.95 | 42.85 | 124 |
| 1987 | 10.56 | 0.37 | 0.68 | 1.99 | 13.17 | 39.46 | 103.58 |
| 1988 | 9.83 | 0.29 | 0.62 | 2.37 | 14.32 | 39.41 | 114.93 |
| 1989 | 8.94 | 0.24 | 0.58 | 2.1 | 14.76 | 38.67 | 102.07 |
| 1990 | 8.51 | 0.24 | 0.37 | 2.32 | 14.25 | 37.73 | 100.74 |
| 1991 | 6.97 | 0.16 | 0.48 | 2.16 | 12.93 | 34.47 | 103.13 |
| 1992 | 7 | 0.31 | 0.46 | 2.31 | 13.87 | 33.97 | 91.8 |
| 1993 | 6.44 | 0.22 | 0.57 | 1.58 | 11.53 | 34.38 | 101.06 |
| 1994 | 6.55 | 0.11 | 0.41 | 1.56 | 12.69 | 33.71 | 99.08 |
| 1995 | 7.02 | 0.24 | 0.71 | 1.74 | 14.23 | 32.47 | 100.8 |
| 1996 | 6.53 | 0.2 | 0.63 | 2.05 | 13.99 | 34.43 | 102.8 |
| 1997 | 6.56 | 0.16 | 0.3 | 1.79 | 11.32 | 33.23 | 86.99 |
| 1998 | 5.68 | 0.1 | 0.5 | 1.86 | 11.42 | 30.2 | 86.03 |
| 1999 | 4.41 | 0.2 | 0.42 | 1.58 | 12.63 | 30.34 | 96.61 |
| 2000 | 5.2 | 0.07 | 0.22 | 1.32 | 9.89 | 27.21 | 92.9 |
| 2001 | 5.28 | 0.14 | 0.23 | 1.65 | 10.78 | 26.7 | 86.23 |
| 2002 | 4.75 | 0.28 | 0.22 | 1.75 | 10.47 | 27.42 | 92.74 |
| 2003 | 5.62 | 0.03 | 0.74 | 1.78 | 8.49 | 26.82 | 91.21 |
| 2004 | 4.66 | 0.14 | 0.42 | 1.38 | 9.77 | 24.79 | 90.86 |
| 2005 | 5.65 | 0.17 | 0.21 | 1.79 | 9.65 | 23.98 | 87.87 |
| 2006 | 4.64 | 0.07 | 0.46 | 1.74 | 9.5 | 21.33 | 82.34 |
| 2007 | 4.65 | 0.1 | 0.59 | 1.44 | 8.31 | 24.31 | 78.22 |
| 2008 | 4.55 | 0.14 | 0.54 | 1.11 | 8.57 | 24.68 | 79.48 |
| 2009 | 4 | 0.07 | 0.45 | 1.5 | 8.48 | 21 | 77.28 |
| 2010 | 4.78 | 0.03 | 0.37 | 1.09 | 8.34 | 20.4 | 74.66 |
| 2011 | 4.31 | 0.14 | 0.54 | 1.41 | 7.59 | 23.29 | 79.03 |
| 2012 | 4.26 | 0.07 | 0.61 | 1.1 | 8.07 | 22.66 | 84.24 |
| 2013 | 4.73 | 0.06 | 0.22 | 1.2 | 6.99 | 21.87 | 79.45 |
| 2014 | 4.04 | 0.19 | 0.28 | 1.46 | 6.98 | 20.21 | 77.64 |
| 2015 | 4.8 | 0.06 | 0.38 | 1.49 | 6.84 | 20.65 | 74.23 |
| 2016 | 4.32 | 0.06 | 0.32 | 1.51 | 6.32 | 20.3 | 76.06 |
| 2017 | 4.15 | 0.13 | 0.35 | 1.58 | 6.23 | 19.29 | 76.87 |
| 2018 | 4.45 | 0.03 | 0.32 | 1.34 | 6.88 | 20.56 | 74.01 |
| 2019 | 4.09 | 0.1 | 0.23 | 1.26 | 7.47 | 19.24 | 65.77 |
| 2020 | 4.57 | 0.03 | 0.41 | 1.23 | 5.73 | 17.85 | 67.53 |
| 2021 | 3.77 | 0.07 | 0.28 | 1.28 | 6.58 | 18.39 | 66.66 |
| 2022 | 4.76 | 0.1 | 0.39 | 1.21 | 6.81 | 20.67 | 70.59 |
| 2023 | 4.47 | 0 | 0.5 | 1.28 | 7.32 | 20.25 | 74.34 |
| 2024 | 4.93 | 0 | 0.42 | 1.32 | 6.89 | 18.76 | 62.99 |
| 2025 | 4.48 | 0.09 | 0.31 | 1.28 | 6.48 | 17.29 | 67.48 |
| 2026 | 4.36 | 0.09 | 0.3 | 1.26 | 6.33 | 16.91 | 66.47 |
| 2027 | 4.21 | 0.08 | 0.29 | 1.24 | 6.16 | 16.53 | 65.59 |
| 2028 | 4.08 | 0.08 | 0.28 | 1.22 | 5.98 | 16.14 | 64.71 |
| 2029 | 3.95 | 0.08 | 0.28 | 1.2 | 5.82 | 15.78 | 63.86 |
| 2030 | 3.83 | 0.08 | 0.27 | 1.18 | 5.66 | 15.43 | 63.04 |
| 2031 | 3.71 | 0.07 | 0.26 | 1.16 | 5.52 | 15.09 | 62.23 |
| 2032 | 3.6 | 0.07 | 0.26 | 1.14 | 5.37 | 14.76 | 61.43 |
| 2033 | 3.49 | 0.07 | 0.25 | 1.12 | 5.24 | 14.43 | 60.65 |
| 2034 | 3.39 | 0.07 | 0.25 | 1.1 | 5.11 | 14.12 | 59.88 |
| 2035 | 3.29 | 0.06 | 0.24 | 1.08 | 4.98 | 13.82 | 59.12 |
| 2036 | 3.2 | 0.06 | 0.23 | 1.06 | 4.86 | 13.52 | 58.38 |
| 2037 | 3.1 | 0.06 | 0.23 | 1.05 | 4.74 | 13.24 | 57.64 |
| 2038 | 3.02 | 0.06 | 0.23 | 1.03 | 4.62 | 12.96 | 56.92 |
| 2039 | 2.93 | 0.06 | 0.22 | 1.01 | 4.51 | 12.68 | 56.2 |
| 2040 | 2.85 | 0.05 | 0.22 | 0.99 | 4.41 | 12.41 | 55.5 |
| 2041 | 2.77 | 0.05 | 0.21 | 0.97 | 4.3 | 12.15 | 54.81 |
| 2042 | 2.69 | 0.05 | 0.21 | 0.96 | 4.2 | 11.9 | 54.12 |
| 2043 | 2.62 | 0.05 | 0.2 | 0.94 | 4.1 | 11.65 | 53.45 |
| 2044 | 2.55 | 0.05 | 0.2 | 0.92 | 4 | 11.41 | 52.78 |
| 2045 | 2.48 | 0.05 | 0.2 | 0.91 | 3.91 | 11.17 | 52.13 |
| 2046 | 2.41 | 0.04 | 0.19 | 0.89 | 3.82 | 10.94 | 51.48 |
| 2047 | 2.34 | 0.04 | 0.19 | 0.88 | 3.73 | 10.71 | 50.84 |
| 2048 | 2.28 | 0.04 | 0.19 | 0.86 | 3.65 | 10.49 | 50.21 |
| 2049 | 2.22 | 0.04 | 0.18 | 0.85 | 3.56 | 10.27 | 49.59 |
| 2050 | 2.16 | 0.04 | 0.18 | 0.83 | 3.48 | 10.06 | 48.97 |
| 2051 | 2.1 | 0.04 | 0.18 | 0.82 | 3.4 | 9.85 | 48.37 |
| 2052 | 2.05 | 0.04 | 0.17 | 0.8 | 3.33 | 9.65 | 47.77 |
| 2053 | 1.99 | 0.04 | 0.17 | 0.79 | 3.25 | 9.45 | 47.18 |
| 2054 | 1.94 | 0.03 | 0.17 | 0.77 | 3.18 | 9.26 | 46.59 |
| 2055 | 1.89 | 0.03 | 0.16 | 0.76 | 3.1 | 9.07 | 46.02 |
| 2056 | 1.84 | 0.03 | 0.16 | 0.75 | 3.03 | 8.88 | 45.45 |
| 2057 | 1.79 | 0.03 | 0.16 | 0.73 | 2.97 | 8.7 | 44.89 |
| 2058 | 1.74 | 0.03 | 0.16 | 0.72 | 2.9 | 8.52 | 44.33 |
| 2059 | 1.69 | 0.03 | 0.15 | 0.71 | 2.83 | 8.35 | 43.79 |
| 2060 | 1.65 | 0.03 | 0.15 | 0.7 | 2.77 | 8.18 | 43.25 |
| 2061 | 1.61 | 0.03 | 0.15 | 0.68 | 2.71 | 8.01 | 42.71 |
| 2062 | 1.56 | 0.03 | 0.14 | 0.67 | 2.65 | 7.85 | 42.18 |
| 2063 | 1.52 | 0.03 | 0.14 | 0.66 | 2.59 | 7.69 | 41.66 |
| 2064 | 1.48 | 0.03 | 0.14 | 0.65 | 2.53 | 7.53 | 41.15 |
| 2065 | 1.44 | 0.02 | 0.14 | 0.64 | 2.47 | 7.38 | 40.64 |
| 2066 | 1.41 | 0.02 | 0.14 | 0.63 | 2.42 | 7.23 | 40.14 |
| 2067 | 1.37 | 0.02 | 0.13 | 0.62 | 2.36 | 7.08 | 39.65 |
| 2068 | 1.33 | 0.02 | 0.13 | 0.61 | 2.31 | 6.94 | 39.16 |
| 2069 | 1.3 | 0.02 | 0.13 | 0.59 | 2.26 | 6.8 | 38.68 |
| 2070 | 1.26 | 0.02 | 0.13 | 0.58 | 2.21 | 6.66 | 38.2 |
| 2071 | 1.23 | 0.02 | 0.12 | 0.57 | 2.16 | 6.52 | 37.73 |
| 2072 | 1.2 | 0.02 | 0.12 | 0.56 | 2.11 | 6.39 | 37.26 |
| 2073 | 1.17 | 0.02 | 0.12 | 0.55 | 2.07 | 6.26 | 36.8 |
| 2074 | 1.14 | 0.02 | 0.12 | 0.54 | 2.02 | 6.14 | 36.35 |
| 2075 | 1.11 | 0.02 | 0.12 | 0.54 | 1.98 | 6.01 | 35.9 |
| 2076 | 1.08 | 0.02 | 0.11 | 0.53 | 1.93 | 5.89 | 35.46 |
| 2077 | 1.05 | 0.02 | 0.11 | 0.52 | 1.89 | 5.77 | 35.03 |
| 2078 | 1.02 | 0.02 | 0.11 | 0.51 | 1.85 | 5.65 | 34.59 |
| June year | 2026 | 2031 | 2051 |
| Low - 5th percentile | 10000 | 15000 | 20000 |
| Q1 | 23000 | 26000 | 30000 |
| Median | 30000 | 38000 | 43000 |
| Q3 | 35000 | 44000 | 56000 |
| High - 95th percentile | 50000 | 50000 | 60000 |
More data
Aotearoa Data Explorer has detailed national population projections. The following links will take you to the three specific tables:
- National population projections, by age and sex, 2024(base)-2078
- National population projections, characteristics, 2024(base)-2078
- National population projections, projection assumptions, 2024(base)-2078.
Definitions and metadata
National population projections (series) - DataInfo+ provides general information about national population projections.
National population projections (data collection) - DataInfo+ provides information about projections methodology.
Technical enquiries
Melissa Adams
[email protected]
03 964 8348
ISSN 1178-0584
Next related release
National labour force projections: 2024(base)-2078 will be released on 25 June 2025.


