The UNSW City Futures Research Centre project presents important data on how the community is taking to a major piece of expanding infrastructure.

On the right track? The project tracks data including the purpose of cycling on the Greenway, from commuter trips to recreation.
A UNSW City Futures research project funded by the National Heart Foundation focuses on the GreenWay in Sydney’s Inner West, measuring active travel rates on an easy-to-use dashboard called ‘Map Story’.
Inner West Council has invested significant resources in the GreenWay urban corridor, which follows the route of the Rozelle to Dulwich Hill freight rail line. A network of footpaths, cycleways, parks, playgrounds, bush care sites, cafes, public art and community facilities will connect two of Sydney’s most important waterways – the Cooks River and the Parramatta River at Iron Cove Bay.
To date, about half the GreenWay corridor has been completed and, when it is finished in a few years, it will link two important cycling routes along the rivers.

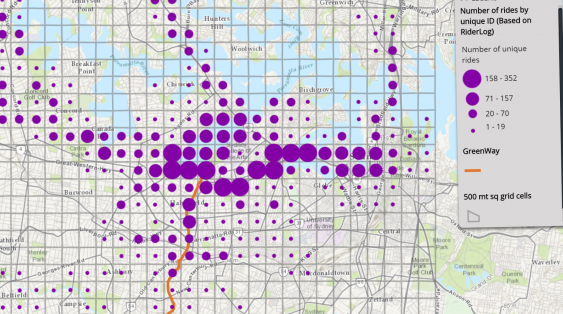
The number of rides based on the RiderLog data for January 2010 to July 2014, generalised into a 500 by 500 metre grid, wherein the size of the circle represents the volume of rides along that grid.
The dashboard project, conducted by Professor Chris Pettit and Dr Ori Gudes from the City Futures Research Centre, meets a core Heart Foundation objective to encourage active travel and increase infrastructure that supports it. First, they collected, cleaned and analysed data from various sources that measure active travel rates on the GreenWay.
"We collected data from the Inner West Council – some are traditional or conventional sources such as the Super Sunday report, where someone in a predefined location monitors how many people are walking, running or cycling along the GreenWay," says Dr Gudes.
"We also have data from Roads and Maritime Services [RMS] about how infrastructure is being used across all the Inner West Council area; we have data from the crowdsource applications Strava and RiderLog; and I have measured air quality using Appmosfera."

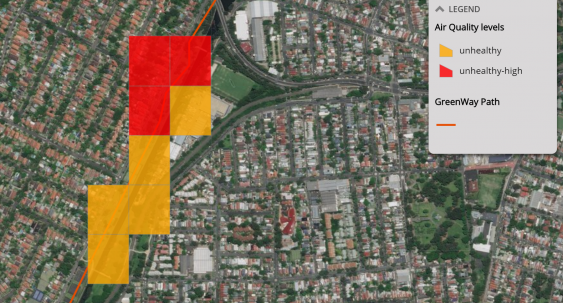
Air quality data measured on 14 June during the evening, using the Appmosfera device, represented as 152 by 152 metre coloured tiles.
The researchers then created visualisations by layering the data into maps hosted on the Map Story dashboard.
"Map Story gives decision makers and urban planners – especially from the Inner West Council – a one-stop shop where they can look at data and quickly understand how the infrastructure is being used," says Dr Gudes.
"By looking at data captured over the last few years, current data and data after the project has been completed, we will have a picture of the extent to which and how the infrastructure is being used."
Heart Foundation CEO NSW, Kerry Doyle, says the project meets a core Heart Foundation objective to encourage active travel and the infrastructure to make it possible.

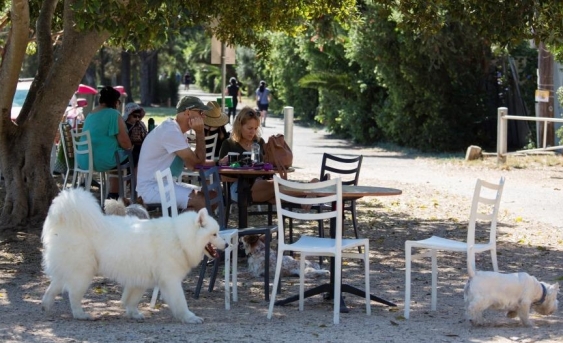
The dog-friendly Cafe Bones is one of the cafes on the GreenWay, where community transport and recreation facilities are a priority.
"The Heart Foundation places a high priority on active travel, because walking, cycling, scooting or catching public transport – which typically involves a walk at the beginning and end of the trip – are among the easiest ways to build 30 minutes of exercise into our busy lives," Ms Doyle says.
"Physical inactivity is a major risk factor for heart disease, which is still the single leading cause of death in Australia. Heart disease is responsible for a death every 30 minutes.
"We are very happy to support the GreenWay Dashboard project. It has the power to demonstrate in a very tangible form how thoughtful infrastructure can translate into increased physical activity and better public health outcomes."
The dashboard is available at https://cityfutures.be.unsw.edu.au/cityviz/the-greenway/.


