Overseas merchandise trade statistics provide information on imports and exports of merchandise goods between New Zealand and other countries.
Key facts
This release refers to trade in goods only.
In February 2026, compared with February 2025:
- goods exports rose by $27 million (0.4 percent), to $6.6 billion
- goods imports rose by $728 million (12 percent), to $6.9 billion
- the monthly trade balance was a deficit of $257 million.
| Year | Exports | Imports |
| 2006 | 2595135137 | 2968944755 |
| 2007 | 2847306905 | 2974750351 |
| 2008 | 3698939543 | 3456249276 |
| 2009 | 3441554562 | 2959029667 |
| 2010 | 3319987179 | 2992155036 |
| 2011 | 3860067650 | 3676230205 |
| 2012 | 3617968870 | 3407395514 |
| 2013 | 3893052249 | 3460754971 |
| 2014 | 4531450064 | 3734368381 |
| 2015 | 3887048559 | 3803076917 |
| 2016 | 4237195041 | 3870269730 |
| 2017 | 4014518142 | 4056794611 |
| 2018 | 4444689404 | 4256432858 |
| 2019 | 4708285499 | 4801869636 |
| 2020 | 4888459478 | 4337820171 |
| 2021 | 4746223785 | 4296376775 |
| 2022 | 5190196779 | 5904997936 |
| 2023 | 5066418005 | 5913175635 |
| 2024 | 5784622173 | 6103611320 |
| 2025 | 6606364542 | 6162794675 |
| 2026 | 6633077490 | 6890571044 |
Exports
Goods exports rose by $27 million (0.4 percent) in February 2026 (to $6.6 billion), compared with February 2025.
Milk powder, butter, and cheese lead fall in exports
Milk powder, butter, and cheese fell $105 million (4.8 percent), to $2.1 billion.
February 2026 value ($ million) |
Change in value ($ million) |
Change in value |
Change in quantity |
Change in unit price |
|
Milk powder, butter, and cheese |
2,092 |
-105 |
-4.8% |
* |
* |
Milk powder |
1,003 |
-126 |
-11% |
-0.8% |
-12% |
Milk fats (including butter) |
489 |
-21 |
-4.1% |
-8.2% |
-11% |
Cheese |
300 |
-14 |
-4.4% |
-1.1% |
-3.3% |
Fresh milk and cream |
152 |
3.3 |
2.2% |
* |
* |
* Changes in total quantity and unit price are omitted due to differences in units of measure. |
|||||
Precious metals, jewellery, and coins rose $85 million (63 percent) to $219 million in February 2026, compared with February 2025. This was led by gold, which rose $84 million (74 percent), to $198 million.
| Month | Value ($) |
| Feb-21 | 30629236 |
| Mar-21 | 32693656 |
| Apr-21 | 35478632 |
| May-21 | 26166212 |
| Jun-21 | 49787171 |
| Jul-21 | 48265955 |
| Aug-21 | 20397113 |
| Sept-21 | 32204287 |
| Oct-21 | 45090046 |
| Nov-21 | 37755098 |
| Dec-21 | 55350187 |
| Jan-22 | 52588965 |
| Feb-22 | 34754381 |
| Mar-22 | 65169474 |
| Apr-22 | 38029927 |
| May-22 | 55190179 |
| Jun-22 | 53870510 |
| Jul-22 | 65612017 |
| Aug-22 | 49846331 |
| Sept-22 | 54723220 |
| Oct-22 | 54686812 |
| Nov-22 | 44085395 |
| Dec-22 | 59096203 |
| Jan-23 | 61505401 |
| Feb-23 | 37935338 |
| Mar-23 | 53312029 |
| Apr-23 | 57007067 |
| May-23 | 54503300 |
| Jun-23 | 91672826 |
| Jul-23 | 61406665 |
| Aug-23 | 75604709 |
| Sept-23 | 66064468 |
| Oct-23 | 62581541 |
| Nov-23 | 60765874 |
| Dec-23 | 73906332 |
| Jan-24 | 61757610 |
| Feb-24 | 62666058 |
| Mar-24 | 96205029 |
| Apr-24 | 70577717 |
| May-24 | 84667881 |
| Jun-24 | 61191092 |
| Jul-24 | 83578770 |
| Aug-24 | 53711747 |
| Sept-24 | 83230699 |
| Oct-24 | 126517248 |
| Nov-24 | 106822811 |
| Dec-24 | 113071123 |
| Jan-25 | 121367650 |
| Feb-25 | 113942721 |
| Mar-25 | 74856202 |
| Apr-25 | 107110863 |
| May-25 | 155775033 |
| Jun-25 | 96558768 |
| Jul-25 | 156671780 |
| Aug-25 | 122337807 |
| Sept-25 | 173497663 |
| Oct-25 | 152232444 |
| Nov-25 | 222476500 |
| Dec-25 | 336941896 |
| Jan-26 | 219683394 |
| Feb-26 | 197802494 |
Top monthly export movements by country
The monthly movements in February 2026, compared with February 2025, for our top export partners (in order of total annual goods exports) were:
- China: total exports were down $65 million (3.6 percent).
The largest rises were milk powder, butter, and cheese, up $20 million; fish, crustaceans, and molluscs, up $16 million; and albumins, gelatin, glues, and enzymes, up $12 million.
The largest falls were casein and caseinates, down $34 million; preparations of milk, cereals, flour, and starch, down $29 million; and meat and edible offal, down $26 million. - Australia: total exports were up $17 million (2.0 percent).
The largest rise was precious metals, jewellery, and coins, up $69 million.
The largest fall was petroleum and products, down $71 million. - USA: total exports were up $64 million (8.2 percent).
The largest rises were meat and edible offal, up $46 million; milk powder, butter, and cheese, up $27 million; and electrical machinery and equipment, up $10 million.
The largest fall was mechanical machinery and equipment, down $12 million. - EU: total exports were up $65 million (15 percent).
The largest rises were milk powder, butter, and cheese, up $25 million; and mechanical machinery and equipment, up $10 million.
There were no significant falls over $10 million. - Japan: total exports were down $41 million (14 percent).
There were no significant rises over $10 million.
The largest fall was milk powder, butter, and cheese, down $12 million.
Imports
Goods imports rose by $728 million (12 percent) in February 2026 (to $6.9 billion), compared with February 2025.
Top monthly import movements by country
The monthly movements in February 2026, compared with February 2025, for our top import partners (in order of total annual goods imports) were:
- China: total imports were up $197 million (15 percent).
The largest rises were electrical machinery and equipment, up $102 million; vehicles, parts, and accessories, up $61 million; and petroleum and products, up $46 million.
The largest fall was textiles and textile articles, down $37 million. - EU: total imports were up $133 million (16 percent).
The largest rises were pharmaceutical products, up $47 million; aircraft and parts, up $39 million; and optical, medical, and measuring equipment, up $17 million.
The largest fall was vehicles, parts, and accessories, down $26 million. - Australia: total imports were up $203 million (30 percent).
The largest rises were precious metals, jewellery, and coins, up $77 million; sugars and sugar confectionery, up $28 million; and paper and paperboard, and articles, up $20 million.
The largest fall was cereals, down $29 million. - USA: total imports were up $31 million (5.4 percent).
The largest rises were food residues, wastes, and fodder, up $27 million; optical, medical, and measuring equipment, up $17 million; and weapons and ammunition, up $17 million.
The largest falls were aircraft and parts, down $43 million; mechanical machinery and equipment, down $22 million; and vehicles, parts, and accessories, down $18 million. - South Korea: total imports were up $205 million (79 percent).
The largest rises were petroleum and products, up $177 million; and vehicles, parts, and accessories, up $28 million.
There were no significant falls over $10 million.
Trade deficit in February 2026
The monthly trade balance was a deficit of $257 million.
| Date | Trade Balance |
| Feb-17 | -42276469 |
| Mar-17 | 261589138 |
| Apr-17 | 546879922 |
| May-17 | 62020162 |
| Jun-17 | 243117487 |
| Jul-17 | 92027349 |
| Aug-17 | -1174342582 |
| Sept-17 | -1165209854 |
| Oct-17 | -839633458 |
| Nov-17 | -1222417301 |
| Dec-17 | 614310559 |
| Jan-18 | -662421494 |
| Feb-18 | 188256546 |
| Mar-18 | -150609406 |
| Apr-18 | 199745211 |
| May-18 | 199288004 |
| Jun-18 | -285260079 |
| Jul-18 | -203110333 |
| Aug-18 | -1566757996 |
| Sept-18 | -1579921712 |
| Oct-18 | -1305105133 |
| Nov-18 | -1003973060 |
| Dec-18 | 9286883 |
| Jan-19 | -934926531 |
| Feb-19 | -93584137 |
| Mar-19 | 825181314 |
| Apr-19 | 360963002 |
| May-19 | 174927698 |
| Jun-19 | 329812747 |
| Jul-19 | -732335397 |
| Aug-19 | -1641634097 |
| Sept-19 | -1309937148 |
| Oct-19 | -1038380593 |
| Nov-19 | -786493088 |
| Dec-19 | 379772255 |
| Jan-20 | -395635011 |
| Feb-20 | 550639307 |
| Mar-20 | 522807892 |
| Apr-20 | 1374019783 |
| May-20 | 1222702687 |
| Jun-20 | 416538602 |
| Jul-20 | 387761796 |
| Aug-20 | -320606284 |
| Sept-20 | -1132334429 |
| Oct-20 | -465913506 |
| Nov-20 | 679104 |
| Dec-20 | 230069561 |
| Jan-21 | -729765438 |
| Feb-21 | 449847010 |
| Mar-21 | -182555509 |
| Apr-21 | 557914991 |
| May-21 | 404936125 |
| Jun-21 | 442108253 |
| Jul-21 | -387158502 |
| Aug-21 | -2132508281 |
| Sept-21 | -2166033786 |
| Oct-21 | -1282573004 |
| Nov-21 | -1085761728 |
| Dec-21 | -990246456 |
| Jan-22 | -1106744295 |
| Feb-22 | -714801157 |
| Mar-22 | -593488596 |
| Apr-22 | 469495559.5 |
| May-22 | 148263036 |
| Jun-22 | -1132868318 |
| Jul-22 | -1415192071 |
| Aug-22 | -2634137110 |
| Sept-22 | -2519671472 |
| Oct-22 | -2315527621 |
| Nov-22 | -2183787239 |
| Dec-22 | -650530508 |
| Jan-23 | -2095237898 |
| Feb-23 | -846757630 |
| Mar-23 | -1602490156 |
| Apr-23 | 220723935 |
| May-23 | 41615990.2 |
| Jun-23 | -114738381 |
| Jul-23 | -1174149043 |
| Aug-23 | -2266681329 |
| Sept-23 | -2420838856 |
| Oct-23 | -1732504563 |
| Nov-23 | -1258971689 |
| Dec-23 | -372771305 |
| Jan-24 | -1064170538 |
| Feb-24 | -318989147 |
| Mar-24 | 469883412 |
| Apr-24 | -11882445 |
| May-24 | 59494662 |
| Jun-24 | 577124190 |
| Jul-24 | -1021575122 |
| Aug-24 | -2316015330 |
| Sept-24 | -2166468080 |
| Oct-24 | -1653634248 |
| Nov-24 | -449804544 |
| Dec-24 | 36046105 |
| Jan-25 | -549356414 |
| Feb-25 | 443569867 |
| Mar-25 | 791665130 |
| Apr-25 | 1197956921 |
| May-25 | 1101679700 |
| Jun-25 | 158845513 |
| Jul-25 | -761568183 |
| Aug-25 | -1312707996 |
| Sept-25 | -1406470725 |
| Oct-25 | -1584405113 |
| Nov-25 | -323113904.1 |
| Dec-25 | 26820151 |
| Jan-26 | -626808033 |
| Feb-26 | -257493554 |
February 2026 year
Annual values are actual and compared with the year ended February 2025.
- Annual goods exports were valued at $80.6 billion, up $7.7 billion from the previous year.
- Annual goods imports were valued at $83.6 billion, up $4.2 billion from the previous year.
- The annual trade deficit was $3.0 billion. In the year ended February 2025 the deficit was $6.6 billion.
| Date | Trade balance |
| Feb-17 | -3782164840 |
| Mar-17 | -3709425552 |
| Apr-17 | -3512075703 |
| May-17 | -3793134384 |
| Jun-17 | -3656807285 |
| Jul-17 | -3213352131 |
| Aug-17 | -3147802862 |
| Sept-17 | -2925025327 |
| Oct-17 | -2967007635 |
| Nov-17 | -3466223824 |
| Dec-17 | -2850478094 |
| Jan-18 | -3286356541 |
| Feb-18 | -3055823526 |
| Mar-18 | -3468022070 |
| Apr-18 | -3815156781 |
| May-18 | -3677888939 |
| Jun-18 | -4206266505 |
| Jul-18 | -4501404187 |
| Aug-18 | -4893819601 |
| Sept-18 | -5308531459 |
| Oct-18 | -5774003134 |
| Nov-18 | -5555558893 |
| Dec-18 | -6160582569 |
| Jan-19 | -6433087606 |
| Feb-19 | -6714928289 |
| Mar-19 | -5739137569 |
| Apr-19 | -5577919778 |
| May-19 | -5602280084 |
| Jun-19 | -4987207258 |
| Jul-19 | -5516432322 |
| Aug-19 | -5591308423 |
| Sept-19 | -5321323859 |
| Oct-19 | -5054599319 |
| Nov-19 | -4837119347 |
| Dec-19 | -4466633975 |
| Jan-20 | -3927342455 |
| Feb-20 | -3283119011 |
| Mar-20 | -3585492433 |
| Apr-20 | -2572435652 |
| May-20 | -1524660663 |
| Jun-20 | -1437934808 |
| Jul-20 | -317837615 |
| Aug-20 | 1003190198 |
| Sept-20 | 1180792917 |
| Oct-20 | 1753260004 |
| Nov-20 | 2540432196 |
| Dec-20 | 2390729502 |
| Jan-21 | 2056599075 |
| Feb-21 | 1955806778 |
| Mar-21 | 1250443377 |
| Apr-21 | 434338585 |
| May-21 | -383427977 |
| Jun-21 | -357858326 |
| Jul-21 | -1132778624 |
| Aug-21 | -2944680621 |
| Sept-21 | -3978379978 |
| Oct-21 | -4795039476 |
| Nov-21 | -5881480308 |
| Dec-21 | -7101796325 |
| Jan-22 | -7478775182 |
| Feb-22 | -8643423349 |
| Mar-22 | -9054356436 |
| Apr-22 | -9142775868 |
| May-22 | -9399448957 |
| Jun-22 | -10974425528 |
| Jul-22 | -12002459097 |
| Aug-22 | -12504087926 |
| Sept-22 | -12857725612 |
| Oct-22 | -13890680229 |
| Nov-22 | -14988705740 |
| Dec-22 | -14648989792 |
| Jan-23 | -15637483395 |
| Feb-23 | -15769439868 |
| Mar-23 | -16778441428 |
| Apr-23 | -17027213052 |
| May-23 | -17133860098 |
| Jun-23 | -16115730161 |
| Jul-23 | -15874687133 |
| Aug-23 | -15507231352 |
| Sept-23 | -15408398736 |
| Oct-23 | -14825375678 |
| Nov-23 | -13900560128 |
| Dec-23 | -13622800925 |
| Jan-24 | -12591733565 |
| Feb-24 | -12063965082 |
| Mar-24 | -9991591514 |
| Apr-24 | -10224197894 |
| May-24 | -10206319222 |
| Jun-24 | -9514456651 |
| Jul-24 | -9361882730 |
| Aug-24 | -9411216731 |
| Sept-24 | -9156845955 |
| Oct-24 | -9077975640 |
| Nov-24 | -8268808495 |
| Dec-24 | -7859991085 |
| Jan-25 | -7345176961 |
| Feb-25 | -6582617947 |
| Mar-25 | -6260836229 |
| Apr-25 | -5050996863 |
| May-25 | -4008811825 |
| Jun-25 | -4427090502 |
| Jul-25 | -4167083563 |
| Aug-25 | -3163776229 |
| Sept-25 | -2403778874 |
| Oct-25 | -2334549739 |
| Nov-25 | -2207859099 |
| Dec-25 | -2217085053 |
| Jan-26 | -2294536672 |
| Feb-26 | -2995600093 |
| Date | Exports | Imports |
| Feb-17 | 48305011954 | 52087176794 |
| Mar-17 | 48694076739 | 52403502291 |
| Apr-17 | 49076148830 | 52588224533 |
| May-17 | 49424472301 | 53217606685 |
| Jun-17 | 49873491508 | 53530298793 |
| Jul-17 | 50528773127 | 53742125258 |
| Aug-17 | 50834401328 | 53982204190 |
| Sept-17 | 51160043929 | 54085069256 |
| Oct-17 | 51791672041 | 54758679676 |
| Nov-17 | 52532859588 | 55999083412 |
| Dec-17 | 53625488161 | 56475966255 |
| Jan-18 | 53965184420 | 57251540961 |
| Feb-18 | 54395355682 | 57451179208 |
| Mar-18 | 54602966051 | 58070988121 |
| Apr-18 | 54860205151 | 58675361932 |
| May-18 | 55304076433 | 58981965372 |
| Jun-18 | 55490192916 | 59696459421 |
| Jul-18 | 56206201587 | 60707605774 |
| Aug-18 | 56493336022 | 61387155623 |
| Sept-18 | 56954044261 | 62262575720 |
| Oct-18 | 57226558637 | 63000561771 |
| Nov-18 | 57470599037 | 63026157930 |
| Dec-18 | 57251104265 | 63411686834 |
| Jan-19 | 57320341207 | 63753428813 |
| Feb-19 | 57583937302 | 64298865591 |
| Mar-19 | 58386241764 | 64125379333 |
| Apr-19 | 58900924296 | 64478844074 |
| May-19 | 59293597157 | 64895877241 |
| Jun-19 | 59378412551 | 64365619809 |
| Jul-19 | 58963308257 | 64479740579 |
| Aug-19 | 59050318141 | 64641626564 |
| Sept-19 | 59153331446 | 64474655305 |
| Oct-19 | 59330562863 | 64385162182 |
| Nov-19 | 59689705163 | 64526824510 |
| Dec-19 | 59899236281 | 64365870256 |
| Jan-20 | 60232430772 | 64159773227 |
| Feb-20 | 60412604751 | 63695723762 |
| Mar-20 | 60424643728 | 64010136161 |
| Apr-20 | 60267881085 | 62840316737 |
| May-20 | 59860029862 | 61384690525 |
| Jun-20 | 59923371349 | 61361306157 |
| Jul-20 | 59958852127 | 60276689742 |
| Aug-20 | 60267415950 | 59264225752 |
| Sept-20 | 59811824505 | 58631031588 |
| Oct-20 | 59608519266 | 57855259262 |
| Nov-20 | 59310670094 | 56770237898 |
| Dec-20 | 59352090268 | 56961360766 |
| Jan-21 | 58791158732 | 56734559657 |
| Feb-21 | 58648923039 | 56693116261 |
| Mar-21 | 58509007529 | 57258564152 |
| Apr-21 | 58727983912 | 58293645327 |
| May-21 | 59187764622 | 59571192599 |
| Jun-21 | 60317064345 | 60674922671 |
| Jul-21 | 61137731227 | 62270509851 |
| Aug-21 | 61130377632 | 64075058253 |
| Sept-21 | 61626437404 | 65604817382 |
| Oct-21 | 62203301840 | 66998341316 |
| Nov-21 | 62957144846 | 68838625154 |
| Dec-21 | 63494172023 | 70595968348 |
| Jan-22 | 64179336420 | 71658111602 |
| Feb-22 | 64623309414 | 73266732763 |
| Mar-22 | 65620086364 | 74674442800 |
| Apr-22 | 66238532811 | 75381308679 |
| May-22 | 67249624549 | 76649073506 |
| Jun-22 | 67320451696 | 78294877224 |
| Jul-22 | 67880911372 | 79883370469 |
| Aug-22 | 68799762323 | 81303850249 |
| Sept-22 | 70313919973 | 83171645585 |
| Oct-22 | 70886872314 | 84777552543 |
| Nov-22 | 71544229919 | 86532935659 |
| Dec-22 | 71970611821 | 86619601613 |
| Jan-23 | 72476808672 | 88114292067 |
| Feb-23 | 72353029898 | 88122469766 |
| Mar-23 | 72141630258 | 88920071686 |
| Apr-23 | 72569483052 | 89596696104 |
| May-23 | 72717557731 | 89851417829 |
| Jun-23 | 72672011431 | 88787741592 |
| Jul-23 | 71711512987 | 87586200120 |
| Aug-23 | 71402878992 | 86910110344 |
| Sept-23 | 70258409955 | 85666808691 |
| Oct-23 | 69672337565 | 84497713243 |
| Nov-23 | 69280620301 | 83181180429 |
| Dec-23 | 68620962133 | 82243763058 |
| Jan-24 | 68136465013 | 80728198578 |
| Feb-24 | 68854669181 | 80918634263 |
| Mar-24 | 68969169693 | 78960761207 |
| Apr-24 | 68673149211 | 78897347105 |
| May-24 | 68719391678 | 78925710900 |
| Jun-24 | 68567972772 | 78082429423 |
| Jul-24 | 69269795361 | 78631678091 |
| Aug-24 | 69130797935 | 78542014666 |
| Sept-24 | 69260320778 | 78417166733 |
| Oct-24 | 69512025393 | 78590001033 |
| Nov-24 | 69976656237 | 78245464732 |
| Dec-24 | 70797191828 | 78657182913 |
| Jan-25 | 72028232122 | 79373409083 |
| Feb-25 | 72849974491 | 79432592438 |
| Mar-25 | 73882412413 | 80143248642 |
| Apr-25 | 75265394153 | 80316391016 |
| May-25 | 75782612377 | 79791424202 |
| Jun-25 | 76239234143 | 80666324645 |
| Jul-25 | 76669987193 | 80837070756 |
| Aug-25 | 77602688743 | 80766464972 |
| Sept-25 | 78467180850 | 80870959724 |
| Oct-25 | 79292259622 | 81626809361 |
| Nov-25 | 79680759523 | 81888618622 |
| Dec-25 | 80522657154 | 82739742207 |
| Jan-26 | 80567200466 | 82861737138 |
| Feb-26 | 80593913414 | 83589513507 |
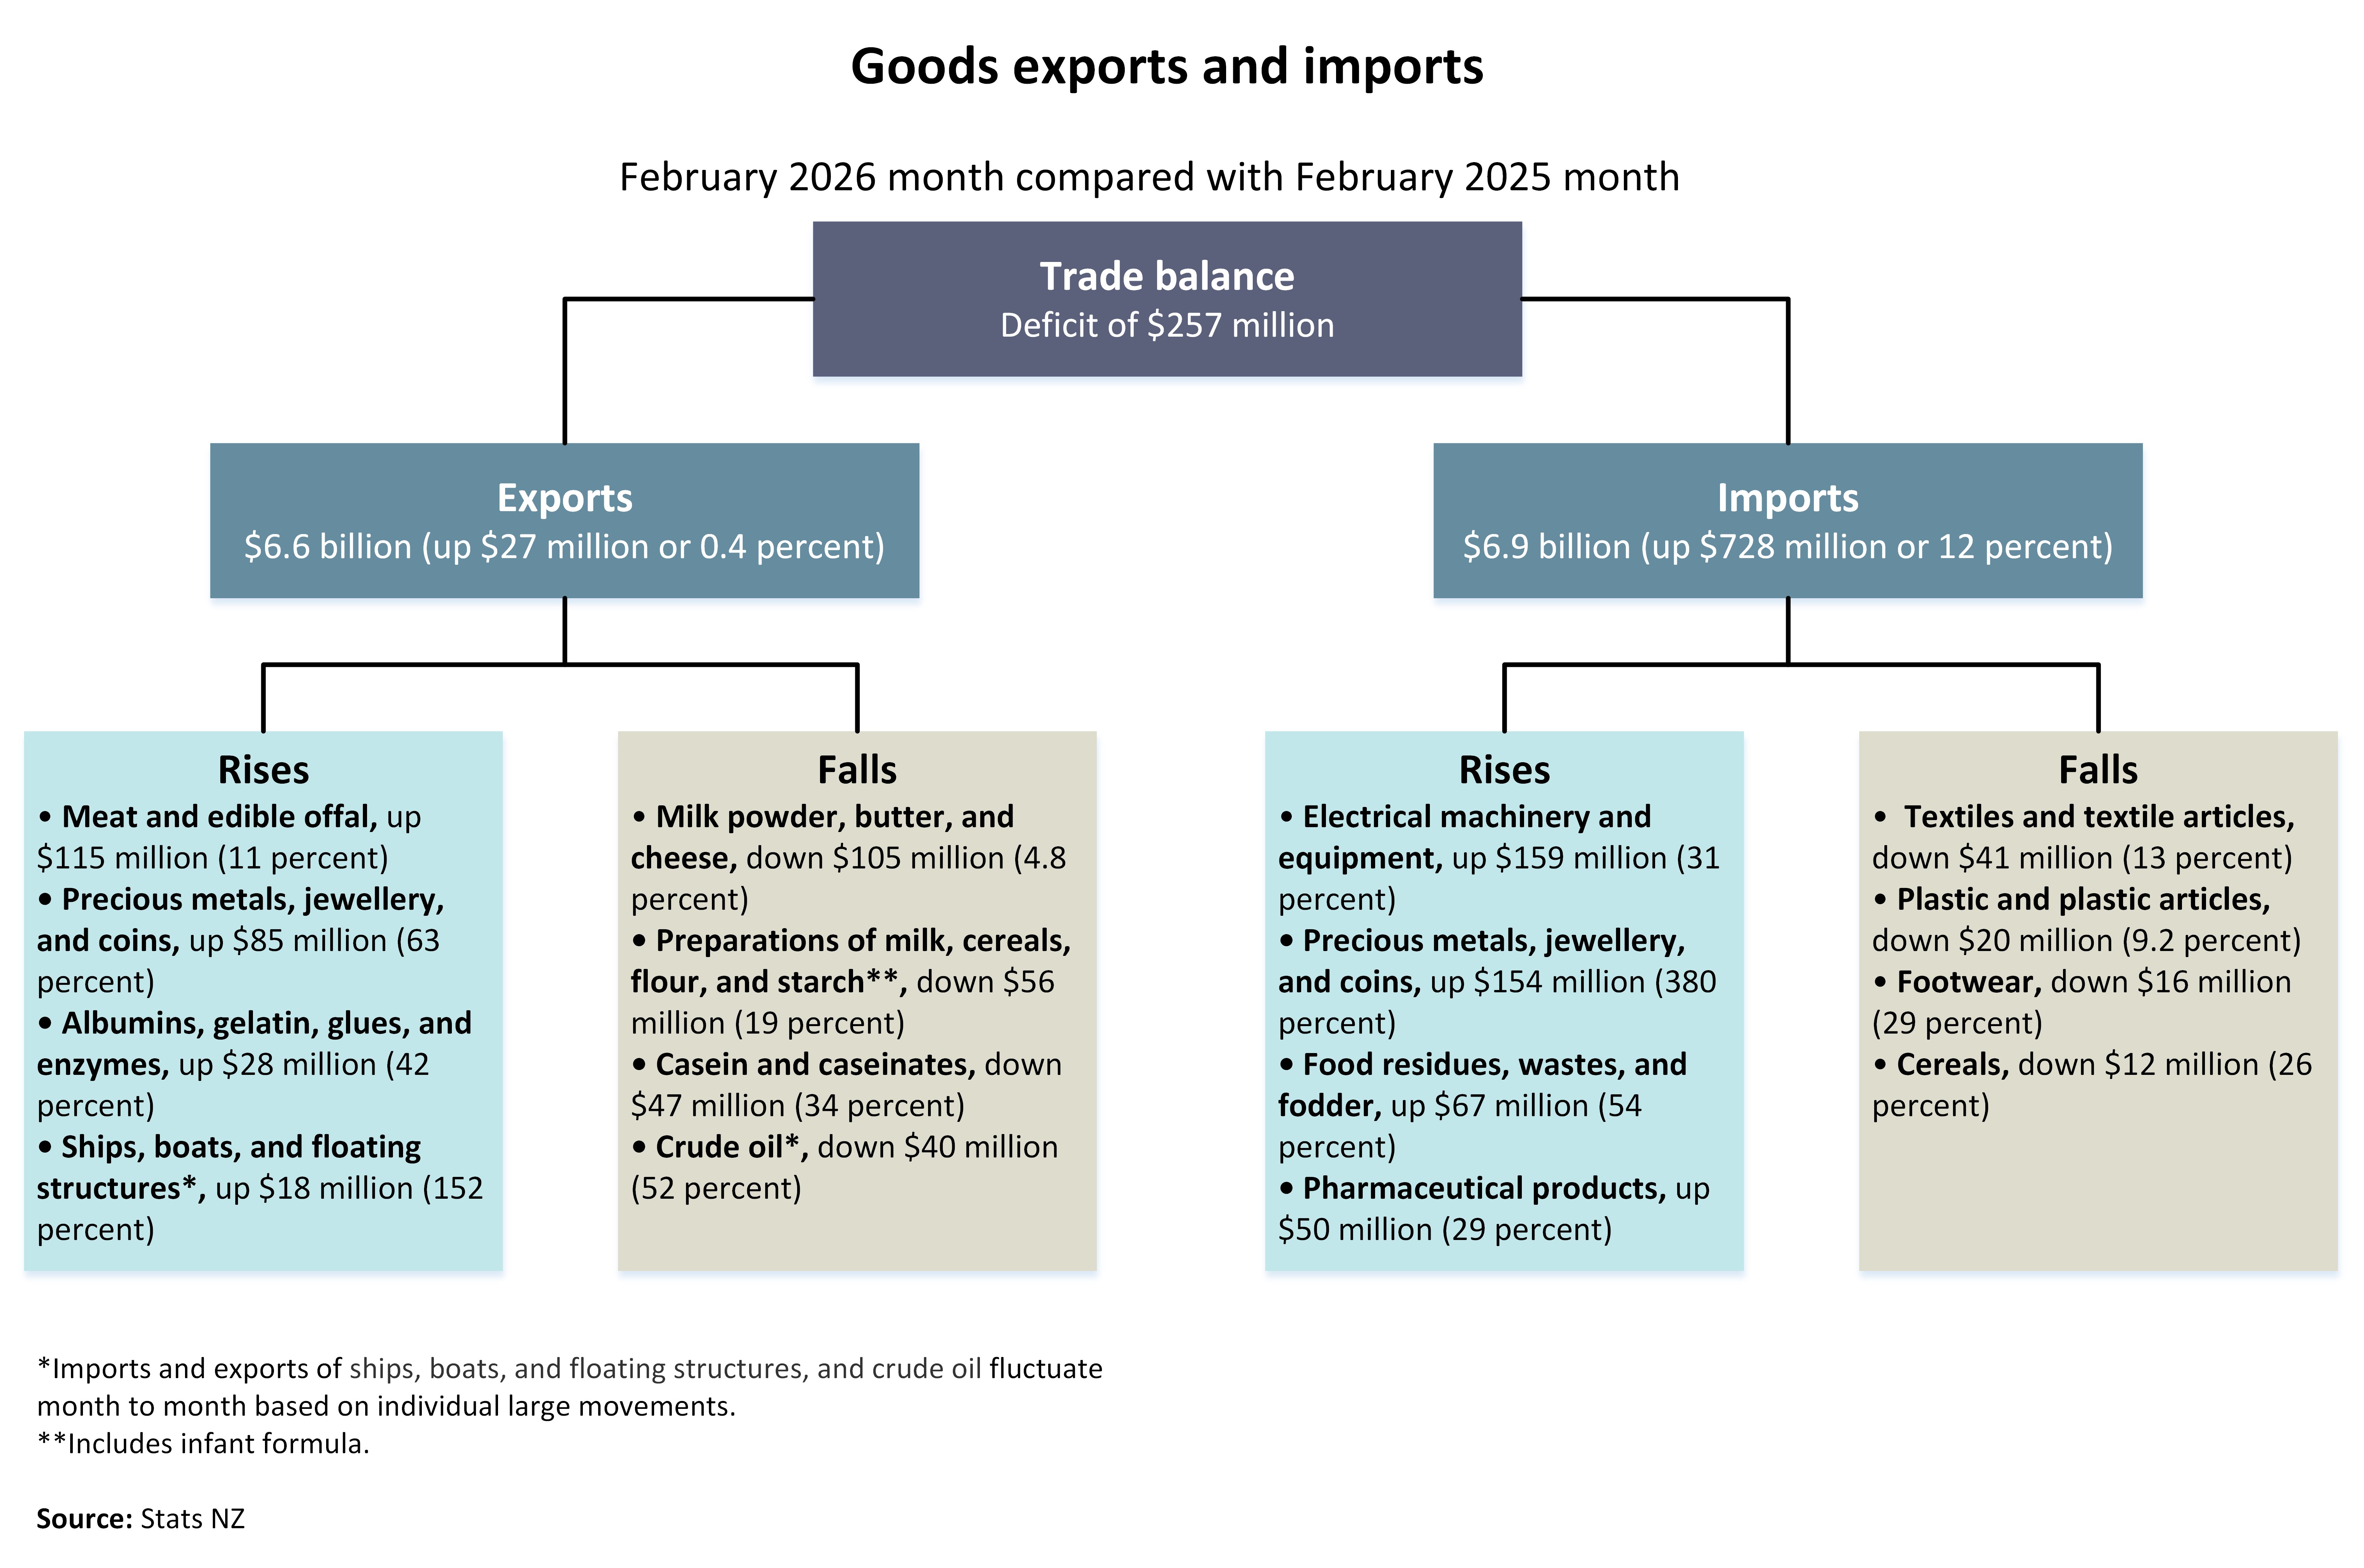
Text alternative for Goods exports and imports, February 2026 month compared with February 2025 month
The diagram shows goods exports and imports for the February 2026 month compared with the February 2025 month.
The trade balance is a deficit of $257 million. This is the difference between exports valued at $6.6 billion (up $27 million or 0.4 percent) and imports valued at $6.9 billion (up $728 million or 12 percent).
Export commodities that rose included: meat and edible offal, up $115 million (11 percent); precious metals, jewellery, and coins, up $85 million (63 percent); albumins, gelatin, glues, and enzymes, up $28 million (42 percent); and ships, boats, and floating structures*, up $18 million (152 percent).
Export commodities that fell included: milk powder, butter, and cheese, down $105 million (4.8 percent); preparations of milk, cereals, flour, and starch**, down $56 million (19 percent); casein and caseinates, down $47 million (34 percent); and crude oil*, down $40 million (52 percent).
Import commodities that rose included: electrical machinery and equipment, up $159 million (31 percent); precious metals, jewellery, and coins, up $154 million (380 percent); food residues, wastes, and fodder, up $67 million (54 percent); and pharmaceutical products, up $50 million (29 percent).
Import commodities that fell included: textiles and textile articles, down $41 million (13 percent); plastic and plastic articles, down $20 million (9.2 percent); footwear, down $16 million (29 percent); and cereals, down $12 million (26 percent).
*Imports and exports of ships, boats, and floating structures, and crude oil fluctuate month to month based on individual large movements.
**Includes infant formula.
Source: Stats NZ
More data
Use Infoshare to access time-series data for imports and exports (subject category: Imports and exports).
Overseas merchandise trade datasets has CSV data for goods imports and exports.
International trade: December 2025 quarter has information on trade in goods and services.
Definitions and metadata
Overseas merchandise trade - DataInfo+ provides the definitions of terms used in this release and general methodology used to produce overseas merchandise trade statistics.
Technical enquiries
Aaron McRae
[email protected]
04 931 4600
ISSN 1178-0320
Next release
Overseas merchandise trade: March 2026 will be released on 20 April 2026.


