Overseas merchandise trade statistics provide information on imports and exports of merchandise goods between New Zealand and other countries.
Key facts
This release refers to trade in goods only.
In July 2025, compared with July 2024:
- goods exports rose by $626 million (10 percent), to $6.7 billion
- goods imports rose by $183 million (2.6 percent), to $7.3 billion
- the monthly trade balance was a deficit of $578 million.
| Year | Exports | Imports |
| 2005 | 2426263434 | 3050411346 |
| 2006 | 3020356105 | 3713824251 |
| 2007 | 2640668783 | 3448204459 |
| 2008 | 3431915482 | 4229035708 |
| 2009 | 3172680634 | 3350262864 |
| 2010 | 3553375807 | 3739362422 |
| 2011 | 3707599515 | 3604683215 |
| 2012 | 4044069095 | 3946531863 |
| 2013 | 3827899644 | 4616006147 |
| 2014 | 3684319949 | 4626853657 |
| 2015 | 4168609773 | 4899053730 |
| 2016 | 3965353750 | 4316781555 |
| 2017 | 4620635369 | 4528608020 |
| 2018 | 5336644040 | 5539754373 |
| 2019 | 4921539746 | 5653875143 |
| 2020 | 4957020524 | 4569258728 |
| 2021 | 5777687406 | 6164845908 |
| 2022 | 6338147082 | 7753339153 |
| 2023 | 5377648638 | 6551797681 |
| 2024 | 6079471227 | 7101046349 |
| 2025 | 6705883704 | 7283849121 |
Text alternative for Goods imports and exports, July 2025 month compared with July 2024 month.
Exports
Goods exports rose by $626 million (10 percent) in July 2025 (to $6.7 billion), compared with July 2024.
Milk powder, butter, and cheese rose $ 275 million (17 percent), to $1.9 billion.
July 2025 |
Change in |
Change in |
Change in |
Change in |
|
Milk powder, butter, |
1,859 |
275 |
17% |
* |
* |
Milk powder |
827 |
158 |
24% |
0.2% |
23% |
Butter and dairy spreads |
508 |
109 |
27% |
13% |
13% |
Fresh milk and cream |
98 |
-14 |
-13% |
* |
* |
Cheese |
284 |
-7.5 |
-2.6% |
-12% |
10% |
* Changes in total quantity and unit price are omitted due to differences in units of measure. |
|||||
Fresh or chilled beef and frozen beef export rose $58 million (17 percent), to $401 million.
| Countries | 2022 | 2023 | 2024 | 2025 |
| United States of America | 1311737686 | 1408429492 | 1724176493 | 2173869628 |
| "China | 1964063546 | 1848114587 | 1212013431 | 920876081 |
| People's Republic of" | 97085307 | 119968922 | 208216525 | 361177029 |
| Canada | 333546900 | 237898595 | 339045086 | 290691315 |
| Japan | 81018906 | 105942120 | 103713046 | 136779316 |
| EU |
Top monthly export movements by country
The monthly movements in July 2025, compared with July 2024, for our top export partners (in order of total annual goods exports) were:
- China: total exports were up $98 million (7.1 percent).
- The largest rises were preparations of milk, cereals, flour, and starch, up $85 million; milk powder, butter, and cheese, up $77 million; and meat and edible offal, up $19 million.
- The largest falls were fruit, down $62 million; and casein and caseinates, down $48 million.
- Australia: total exports were up $39 million (4.7 percent).
- The largest rises were precious metals, jewellery, and coins, up $61 million; and fruit, up $17 million.
- The largest falls were crude oil, down $71 million; and miscellaneous edible preparations, down $13 million.
- USA: total exports were up $57 million (7.7 percent).
- The largest rises were meat and edible offal, up $32 million; casein and caseinates, up $14 million; and logs, wood, and wood articles, up $13 million.
- The largest falls were wine, down $27 million; and iron and steel, and articles, down $10 million.
- EU: total exports were up $136 million (28 percent).
- The largest rises were mechanical machinery and equipment, up $49 million; fruit, up $35 million; and meat and edible offal, up $32 million.
- There were no significant falls over $10 million.
- Japan: total exports were up $76 million (23 percent).
- The largest rises were fruit, up $37 million; and milk powder, butter, and cheese, up $23 million.
- The largest fall was aluminium and aluminium articles, down $12 million.
Imports
Goods imports rose by $183 million (2.6 percent), in July 2025 (to $7.3 billion), compared with July 2024.
Top monthly import movements by country
The monthly movements in July 2025, compared with July 2024, for our top import partners (in order of total annual goods imports) were:
- China: total imports were up $103 million (6.9 percent).
- The largest rises were electrical machinery and equipment, up $41 million; vehicles, parts, and accessories, up $36 million; and mechanical machinery and equipment, up $32 million.
- The largest falls were petroleum and products, down $54 million; and fertilisers, down $26 million.
- EU: total imports were up $194 million (22 percent).
- The largest rises were mechanical machinery and equipment, up $42 million; vehicles, parts, and accessories, up $39 million; and aircraft and parts, up $31 million.
- There were no significant falls over $10 million.
- Australia: total imports were up $21 million (2.7 percent).
- The largest rise was paper and paperboard, and articles, up $13 million.
- The largest falls were sugars and sugar confectionery, down $28 million; and vehicles, parts, and accessories, down $13 million.
- USA: total imports were up $147 million (24 percent).
- The largest rises were mechanical machinery and equipment, up $80 million; aircraft and parts, up $61 million; and optical, medical, and measuring equipment, up $16 million.
- The largest falls were electrical machinery and equipment, down $19 million; and petroleum and products, down $17 million.
- South Korea: total imports were down $316 million (33 percent).
- The largest rises were fertilisers, up $22 million; and vehicles, parts, and accessories, up $10 million.
- The largest fall was petroleum and products, down $367 million.
Trade deficit in July 2025
The monthly trade balance was a deficit of $578 million.
| Date | Trade Balance |
| Jul-16 | -351427805 |
| Aug-16 | -1239891851 |
| Sep-16 | -1387987389 |
| Oct-16 | -797651150 |
| Nov-16 | -723201112 |
| Dec-16 | -1435171 |
| Jan-17 | -226543047 |
| Feb-17 | -42276469 |
| Mar-17 | 261589138 |
| Apr-17 | 546879922 |
| May-17 | 62020162 |
| Jun-17 | 243117487 |
| Jul-17 | 92027349 |
| Aug-17 | -1174342582 |
| Sep-17 | -1165209854 |
| Oct-17 | -839633458 |
| Nov-17 | -1222417301 |
| Dec-17 | 614310559 |
| Jan-18 | -662421494 |
| Feb-18 | 188256546 |
| Mar-18 | -150609406 |
| Apr-18 | 199745211 |
| May-18 | 199288004 |
| Jun-18 | -285260079 |
| Jul-18 | -203110333 |
| Aug-18 | -1566757996 |
| Sep-18 | -1579921712 |
| Oct-18 | -1305105133 |
| Nov-18 | -1003973060 |
| Dec-18 | 9286883 |
| Jan-19 | -934926531 |
| Feb-19 | -93584137 |
| Mar-19 | 825181314 |
| Apr-19 | 360963002 |
| May-19 | 174927698 |
| Jun-19 | 329812747 |
| Jul-19 | -732335397 |
| Aug-19 | -1641634097 |
| Sep-19 | -1309937148 |
| Oct-19 | -1038380593 |
| Nov-19 | -786493088 |
| Dec-19 | 379772255 |
| Jan-20 | -395635011 |
| Feb-20 | 550639307 |
| Mar-20 | 522807892 |
| Apr-20 | 1374019783 |
| May-20 | 1222702687 |
| Jun-20 | 416538602 |
| Jul-20 | 387761796 |
| Aug-20 | -320606284 |
| Sep-20 | -1132334429 |
| Oct-20 | -465913506 |
| Nov-20 | 679104 |
| Dec-20 | 230069561 |
| Jan-21 | -729765438 |
| Feb-21 | 449847010 |
| Mar-21 | -182555509 |
| Apr-21 | 557914991 |
| May-21 | 404936125 |
| Jun-21 | 442108253 |
| Jul-21 | -387158502 |
| Aug-21 | -2132508281 |
| Sep-21 | -2166033786 |
| Oct-21 | -1282573004 |
| Nov-21 | -1085761728 |
| Dec-21 | -990246456 |
| Jan-22 | -1106744295 |
| Feb-22 | -714801157 |
| Mar-22 | -593488596 |
| Apr-22 | 469495559.5 |
| May-22 | 148263036 |
| Jun-22 | -1132868318 |
| Jul-22 | -1415192071 |
| Aug-22 | -2634137110 |
| Sep-22 | -2519671472 |
| Oct-22 | -2315527621 |
| Nov-22 | -2183787239 |
| Dec-22 | -650530508 |
| Jan-23 | -2095237898 |
| Feb-23 | -846757630 |
| Mar-23 | -1602490156 |
| Apr-23 | 220854073 |
| May-23 | 41615990.2 |
| Jun-23 | -114738381 |
| Jul-23 | -1174149043 |
| Aug-23 | -2266681329 |
| Sep-23 | -2420838856 |
| Oct-23 | -1732504563 |
| Nov-23 | -1258971689 |
| Dec-23 | -372771305 |
| Jan-24 | -1064170538 |
| Feb-24 | -318989147 |
| Mar-24 | 469883412 |
| Apr-24 | -11882445 |
| May-24 | 59494662 |
| Jun-24 | 577124190 |
| Jul-24 | -1021575122 |
| Aug-24 | -2316015330 |
| Sep-24 | -2166468080 |
| Oct-24 | -1653634248 |
| Nov-24 | -449804544 |
| Dec-24 | 36046105 |
| Jan-25 | -549356414 |
| Feb-25 | 443569867 |
| Mar-25 | 789871688 |
| Apr-25 | 1197956921 |
| May-25 | 1102591601 |
| Jun-25 | 202595389 |
| Jul-25 | -577965417 |
July 2025 year
Annual values are actual and compared with the year ended July 2024.
- Annual goods exports were valued at $76.9 billion, up $7.6 billion from the previous year.
- Annual goods imports were valued at $80.9 billion, up $2.2 billion from the previous year.
- The annual trade deficit was $3.9 billion. In the year ended July 2024 the deficit was $9.4 billion.
| Month | Trade balance |
| Jul-15 | -2762446249 |
| Aug-15 | -3388079713 |
| Sep-15 | -3169130897 |
| Oct-15 | -3182409618 |
| Nov-15 | -3694857477 |
| Dec-15 | -3536562994 |
| Jan-16 | -3576399416 |
| Feb-16 | -3293445747 |
| Mar-16 | -3765397257 |
| Apr-16 | -3599939057 |
| May-16 | -3624030736 |
| Jun-16 | -3335288185 |
| Jul-16 | -2956272033 |
| Aug-16 | -3105993844 |
| Sep-16 | -3353967015 |
| Oct-16 | -3246795580 |
| Nov-16 | -3174570464 |
| Dec-16 | -3134099782 |
| Jan-17 | -3372963060 |
| Feb-17 | -3782164840 |
| Mar-17 | -3709425552 |
| Apr-17 | -3512075703 |
| May-17 | -3793134384 |
| Jun-17 | -3656807285 |
| Jul-17 | -3213352131 |
| Aug-17 | -3147802862 |
| Sep-17 | -2925025327 |
| Oct-17 | -2967007635 |
| Nov-17 | -3466223824 |
| Dec-17 | -2850478094 |
| Jan-18 | -3286356541 |
| Feb-18 | -3055823526 |
| Mar-18 | -3468022070 |
| Apr-18 | -3815156781 |
| May-18 | -3677888939 |
| Jun-18 | -4206266505 |
| Jul-18 | -4501404187 |
| Aug-18 | -4893819601 |
| Sep-18 | -5308531459 |
| Oct-18 | -5774003134 |
| Nov-18 | -5555558893 |
| Dec-18 | -6160582569 |
| Jan-19 | -6433087606 |
| Feb-19 | -6714928289 |
| Mar-19 | -5739137569 |
| Apr-19 | -5577919778 |
| May-19 | -5602280084 |
| Jun-19 | -4987207258 |
| Jul-19 | -5516432322 |
| Aug-19 | -5591308423 |
| Sep-19 | -5321323859 |
| Oct-19 | -5054599319 |
| Nov-19 | -4837119347 |
| Dec-19 | -4466633975 |
| Jan-20 | -3927342455 |
| Feb-20 | -3283119011 |
| Mar-20 | -3585492433 |
| Apr-20 | -2572435652 |
| May-20 | -1524660663 |
| Jun-20 | -1437934808 |
| Jul-20 | -317837615 |
| Aug-20 | 1003190198 |
| Sep-20 | 1180792917 |
| Oct-20 | 1753260004 |
| Nov-20 | 2540432196 |
| Dec-20 | 2390729502 |
| Jan-21 | 2056599075 |
| Feb-21 | 1955806778 |
| Mar-21 | 1250443377 |
| Apr-21 | 434338585 |
| May-21 | -383427977 |
| Jun-21 | -357858326 |
| Jul-21 | -1132778624 |
| Aug-21 | -2944680621 |
| Sep-21 | -3978379978 |
| Oct-21 | -4795039476 |
| Nov-21 | -5881480308 |
| Dec-21 | -7101796325 |
| Jan-22 | -7478775182 |
| Feb-22 | -8643423349 |
| Mar-22 | -9054356436 |
| Apr-22 | -9142775867 |
| May-22 | -9399448956 |
| Jun-22 | -10974425528 |
| Jul-22 | -12002459097 |
| Aug-22 | -12504087926 |
| Sep-22 | -12857725612 |
| Oct-22 | -13890680229 |
| Nov-22 | -14988705740 |
| Dec-22 | -14648989792 |
| Jan-23 | -15637483395 |
| Feb-23 | -15769439868 |
| Mar-23 | -16778441428 |
| Apr-23 | -17027082914 |
| May-23 | -17133729960 |
| Jun-23 | -16115600023 |
| Jul-23 | -15874556995 |
| Aug-23 | -15507101214 |
| Sep-23 | -15408268598 |
| Oct-23 | -14825245540 |
| Nov-23 | -13900429990 |
| Dec-23 | -13622670787 |
| Jan-24 | -12591603427 |
| Feb-24 | -12063834944 |
| Mar-24 | -9991461376 |
| Apr-24 | -10224197894 |
| May-24 | -10206319222 |
| Jun-24 | -9514456651 |
| Jul-24 | -9361882730 |
| Aug-24 | -9411216731 |
| Sep-24 | -9156845955 |
| Oct-24 | -9077975640 |
| Nov-24 | -8268808495 |
| Dec-24 | -7859991085 |
| Jan-25 | -7345176961 |
| Feb-25 | -6582617947 |
| Mar-25 | -6262629671 |
| Apr-25 | -5052790305 |
| May-25 | -4009693366 |
| Jun-25 | -4384222167 |
| Jul-25 | -3940612462 |
| Month | Exports | Imports |
| Jul-15 | 48880453005 | 51642899254 |
| Aug-15 | 49057455495 | 52445535208 |
| Sep-15 | 49117987199 | 52287118096 |
| Oct-15 | 48918947187 | 52101356805 |
| Nov-15 | 48952719875 | 52647577352 |
| Dec-15 | 48973550776 | 52510113770 |
| Jan-16 | 49187466085 | 52763865501 |
| Feb-16 | 49537612567 | 52831058314 |
| Mar-16 | 48833243763 | 52598641020 |
| Apr-16 | 49026536183 | 52626475240 |
| May-16 | 49230155446 | 52854186182 |
| Jun-16 | 49324864243 | 52660152428 |
| Jul-16 | 49121608220 | 52077880253 |
| Aug-16 | 48793893786 | 51899887630 |
| Sep-16 | 48583604241 | 51937571256 |
| Oct-16 | 48696300602 | 51943096182 |
| Nov-16 | 48493856234 | 51668426698 |
| Dec-16 | 48486904078 | 51621003860 |
| Jan-17 | 48527688853 | 51900651913 |
| Feb-17 | 48305011954 | 52087176794 |
| Mar-17 | 48694076739 | 52403502291 |
| Apr-17 | 49076148830 | 52588224533 |
| May-17 | 49424472301 | 53217606685 |
| Jun-17 | 49873491508 | 53530298793 |
| Jul-17 | 50528773127 | 53742125258 |
| Aug-17 | 50834401328 | 53982204190 |
| Sep-17 | 51160043929 | 54085069256 |
| Oct-17 | 51791672041 | 54758679676 |
| Nov-17 | 52532859588 | 55999083412 |
| Dec-17 | 53625488161 | 56475966255 |
| Jan-18 | 53965184420 | 57251540961 |
| Feb-18 | 54395355682 | 57451179208 |
| Mar-18 | 54602966051 | 58070988121 |
| Apr-18 | 54860205151 | 58675361932 |
| May-18 | 55304076433 | 58981965372 |
| Jun-18 | 55490192916 | 59696459421 |
| Jul-18 | 56206201587 | 60707605774 |
| Aug-18 | 56493336022 | 61387155623 |
| Sep-18 | 56954044261 | 62262575720 |
| Oct-18 | 57226558637 | 63000561771 |
| Nov-18 | 57470599037 | 63026157930 |
| Dec-18 | 57251104265 | 63411686834 |
| Jan-19 | 57320341207 | 63753428813 |
| Feb-19 | 57583937302 | 64298865591 |
| Mar-19 | 58386241764 | 64125379333 |
| Apr-19 | 58900924296 | 64478844074 |
| May-19 | 59293597157 | 64895877241 |
| Jun-19 | 59378412551 | 64365619809 |
| Jul-19 | 58963308257 | 64479740579 |
| Aug-19 | 59050318141 | 64641626564 |
| Sep-19 | 59153331446 | 64474655305 |
| Oct-19 | 59330562863 | 64385162182 |
| Nov-19 | 59689705163 | 64526824510 |
| Dec-19 | 59899236281 | 64365870256 |
| Jan-20 | 60232430772 | 64159773227 |
| Feb-20 | 60412604751 | 63695723762 |
| Mar-20 | 60424643728 | 64010136161 |
| Apr-20 | 60267881085 | 62840316737 |
| May-20 | 59860029862 | 61384690525 |
| Jun-20 | 59923371349 | 61361306157 |
| Jul-20 | 59958852127 | 60276689742 |
| Aug-20 | 60267415950 | 59264225752 |
| Sep-20 | 59811824505 | 58631031588 |
| Oct-20 | 59608519266 | 57855259262 |
| Nov-20 | 59310670094 | 56770237898 |
| Dec-20 | 59352090268 | 56961360766 |
| Jan-21 | 58791158732 | 56734559657 |
| Feb-21 | 58648923039 | 56693116261 |
| Mar-21 | 58509007529 | 57258564152 |
| Apr-21 | 58727983912 | 58293645327 |
| May-21 | 59187764622 | 59571192599 |
| Jun-21 | 60317064345 | 60674922671 |
| Jul-21 | 61137731227 | 62270509851 |
| Aug-21 | 61130377632 | 64075058253 |
| Sep-21 | 61626437404 | 65604817382 |
| Oct-21 | 62203301840 | 66998341316 |
| Nov-21 | 62957144846 | 68838625154 |
| Dec-21 | 63494172023 | 70595968348 |
| Jan-22 | 64179336420 | 71658111602 |
| Feb-22 | 64623309414 | 73266732763 |
| Mar-22 | 65620086364 | 74674442800 |
| Apr-22 | 66238532811 | 75381308679 |
| May-22 | 67249624549 | 76649073506 |
| Jun-22 | 67320451696 | 78294877224 |
| Jul-22 | 67880911372 | 79883370469 |
| Aug-22 | 68799762323 | 81303850249 |
| Sep-22 | 70313919973 | 83171645585 |
| Oct-22 | 70886872314 | 84777552543 |
| Nov-22 | 71544229919 | 86532935659 |
| Dec-22 | 71970611821 | 86619601613 |
| Jan-23 | 72476808672 | 88114292067 |
| Feb-23 | 72353029898 | 88122469766 |
| Mar-23 | 72141630258 | 88920071686 |
| Apr-23 | 72569483052 | 89596565966 |
| May-23 | 72717557731 | 89851287691 |
| Jun-23 | 72672011431 | 88787611454 |
| Jul-23 | 71711512987 | 87586069982 |
| Aug-23 | 71402878992 | 86909980206 |
| Sep-23 | 70258409955 | 85666678553 |
| Oct-23 | 69672337565 | 84497583105 |
| Nov-23 | 69280620301 | 83181050291 |
| Dec-23 | 68620962133 | 82243632920 |
| Jan-24 | 68136465013 | 80728068440 |
| Feb-24 | 68854669181 | 80918504125 |
| Mar-24 | 68969169693 | 78960631069 |
| Apr-24 | 68673149211 | 78897347105 |
| May-24 | 68719391678 | 78925710900 |
| Jun-24 | 68567972772 | 78082429423 |
| Jul-24 | 69269795361 | 78631678091 |
| Aug-24 | 69130797935 | 78542014666 |
| Sep-24 | 69260320778 | 78417166733 |
| Oct-24 | 69512025393 | 78590001033 |
| Nov-24 | 69976656237 | 78245464732 |
| Dec-24 | 70797191828 | 78657182913 |
| Jan-25 | 72028232122 | 79373409083 |
| Feb-25 | 72849974491 | 79432592438 |
| Mar-25 | 73879888401 | 80142518072 |
| Apr-25 | 75262870141 | 80315660446 |
| May-25 | 75781187036 | 79790880402 |
| Jun-25 | 76283603661 | 80667825828 |
| Jul-25 | 76910016138 | 80850628600 |
Text alternative for Goods imports and exports, July 2025 month compared with July 2024 month
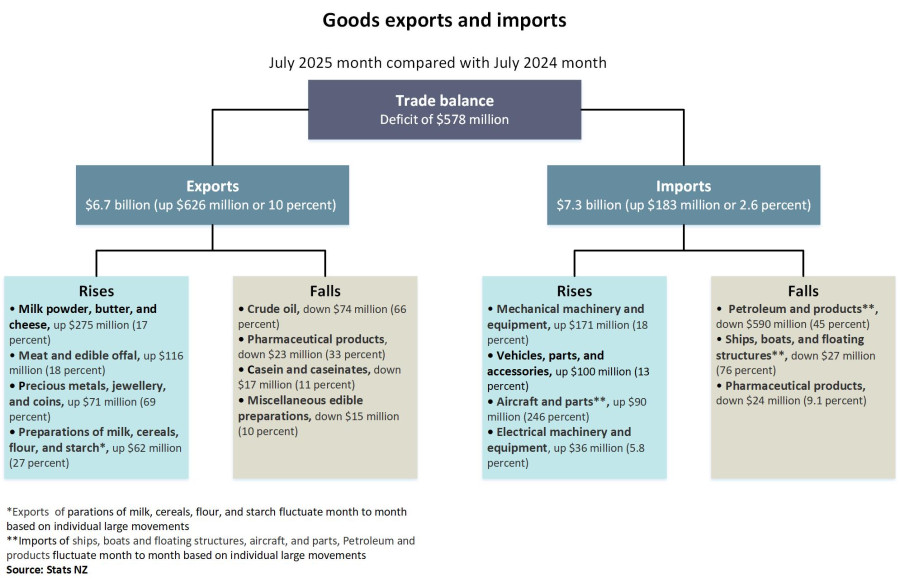
The diagram shows goods exports and imports for the July 2025 month compared with the July 2024 month.
The trade balance is a deficit of $578 million. This is the difference between exports valued at $6.7 billion (up $626 million or 10 percent) and imports valued at $7.3 billion (up $183 million or 2.6 percent).
Export commodities that rose included: milk powder, butter, and cheese, up $275 million (17 percent); meat and edible offal, up $116 million (18 percent); precious metals, jewellery, and coins, up $71 million (69 percent); and preparations of milk, cereals, flour, and starch*, up $62 million (27 percent).
Export commodities that fell included: crude oil**, down $74 million (66 percent); pharmaceutical products, down $23 million (33 percent); casein and caseinates, down $17 million (11 percent); and miscellaneous edible preparations, down $15 million (10 percent).
Import commodities that rose included: mechanical machinery and equipment, up $171 million (18 percent); vehicles, parts, and accessories, up $100 million (13 percent); aircraft and parts**, up $90 million (246 percent); and electrical machinery and equipment, up $36 million (5.8 percent).
Import commodities that fell included: petroleum and products**, down $590 million (45 percent); ships, boats, and floating structures**, down $27 million (76 percent); and pharmaceutical products, down $24 million (9.1 percent).
*Includes infant formula.
**Imports and exports of crude oil; ships, boats and floating structures; aircraft, and parts; and petroleum and products fluctuate month to month based on individual large movements.
Source: Stats NZ
![]()
More data
Use Infoshare to access time-series data for imports and exports.
Subject category: Imports and exports
Overseas merchandise trade datasets has CSV data for goods imports and exports.
International trade: March 2025 quarter has information on trade in goods and services.
Definitions and metadata
Overseas merchandise trade - DataInfo+ provides the definitions of terms used in this release and general methodology used to produce overseas merchandise trade statistics.
Technical enquiries
Danyal Sabzi
[email protected]
04 931 4600
ISSN 1178-0320
Next release
Overseas merchandise trade: August 2025 will be released on 19 September 2025.


