Overseas merchandise trade statistics provide information on imports and exports of merchandise goods between New Zealand and other countries.
Key facts
This release refers to trade in goods only.
In February 2024, compared with February 2023:
- goods exports rose by $823 million (16 percent), to $5.9 billion
- goods imports rose by $194 million (3.3 percent), to $6.1 billion
- the monthly trade balance was a deficit of $218 million.
| Year | Exports | Imports |
| 2003 | 2310405550 | 2319437433 |
| 2004 | 2504164986 | 2416767645 |
| 2005 | 2648296614 | 2754314096 |
| 2006 | 2595135137 | 2968944755 |
| 2007 | 2847306905 | 2974750351 |
| 2008 | 3698939543 | 3456249276 |
| 2009 | 3441554562 | 2959029667 |
| 2010 | 3319987179 | 2992155036 |
| 2011 | 3860067650 | 3676230205 |
| 2012 | 3617968870 | 3407395514 |
| 2013 | 3893052249 | 3460754971 |
| 2014 | 4531450064 | 3734368381 |
| 2015 | 3887048559 | 3803076917 |
| 2016 | 4237195041 | 3870269730 |
| 2017 | 4014518142 | 4056794611 |
| 2018 | 4444689404 | 4256432858 |
| 2019 | 4708285499 | 4801869636 |
| 2020 | 4888459478 | 4337820171 |
| 2021 | 4746223785 | 4296376775 |
| 2022 | 5190196779 | 5904997936 |
| 2023 | 5066418005 | 5913175635 |
| 2024 | 5889544312 | 6107639911 |
Exports
Goods exports rose by $823 million (16 percent) in February 2024 (to $5.9 billion), compared with February 2023.
Milk powder, butter, and cheese leads rise in exports.
Milk powder, butter, and cheese rose $389 million (26 percent), to $1.9 billion.
February 2024 value ($ million) |
Change in value ($ million) |
Change in value |
Change in quantity |
Change in unit price |
|
Milk powder, butter, and cheese |
1,878 |
389 |
26% |
* |
* |
Milk powder |
1,031 |
311 |
43% |
55% |
-7.6% |
Milk fats (including butter) |
351 |
38 |
12% |
10% |
1.6% |
Cheese |
214 |
-19 |
-8.0% |
1.8% |
-9.6% |
Fresh milk and cream |
119 |
13 |
12% |
* |
* |
* Changes in total quantity are omitted due to differences in units of measure. |
|||||
Other dairy-based products including infant formula and casein fell.
February 2024 value ($ million) |
Change in value ($ million) |
Change in value |
Change in quantity |
Change in unit price |
|
Infant formula |
143 |
-41 |
-22% |
29% |
9.2% |
Casein |
127 |
-24 |
-16% |
20% |
-30% |
Infant formula is included in preparations of milk, cereals, flour, and starch, which fell by $38 million (17 percent) to $189 million.
Exports of whey and milk constituents, a minor component of the milk powder, butter, and cheese category, also saw a large rise in February, up $51 million (52 percent), with the majority going to the United States of America.
| Month | Milk powder | Whey and milk constituents | Milk fats (including butter) | Cheese |
| Feb-22 | 428454 | 24801341 | 2799574 | 1402132 |
| Mar-22 | 406264 | 41099209 | 9066975 | 447705 |
| Apr-22 | 719053 | 39880222 | 6485932 | 1685672 |
| May-22 | 515898 | 35040871 | 10866235 | 383807 |
| Jun-22 | 258023 | 37030971 | 7577531 | 795969 |
| Jul-22 | 743205 | 33898675 | 7551494 | 810685 |
| Aug-22 | 172174 | 15752992 | 7277352 | 206942 |
| Sep-22 | 1610352 | 33678193 | 14329548 | 406952 |
| Oct-22 | 954415 | 26510665 | 22266518 | 687658 |
| Nov-22 | 1609407 | 50942990 | 26767158 | 192003 |
| Dec-22 | 4746127 | 52456765 | 53176784 | 408710 |
| Jan-23 | 689435 | 69296978 | 23153364 | 1340399 |
| Feb-23 | 1430406 | 47364512 | 14101257 | 1127676 |
| Mar-23 | 4717236 | 31344604 | 22119858 | 1559557 |
| Apr-23 | 3402786 | 14431702 | 26837107 | 588037 |
| May-23 | 4147910 | 43462180 | 22062923 | 381129 |
| Jun-23 | 2681880 | 38639775 | 24168362 | 600203 |
| Jul-23 | 142813 | 66621781 | 25149121 | 199387 |
| Aug-23 | 4424279 | 44822651 | 16710442 | 1558797 |
| Sep-23 | 1283952 | 11174600 | 14253675 | 1894037 |
| Oct-23 | 1652257 | 35270879 | 35697846 | 972163 |
| Nov-23 | 1108926 | 44773587 | 30482178 | 411825 |
| Dec-23 | 4253171 | 28557681 | 26343042 | 1375220 |
| Jan-24 | 1885519 | 22787897 | 27409929 | 628195 |
| Feb-24 | 2967672 | 94597077 | 47894909 | 1919139 |
Top monthly export movements by country
The monthly movements in February 2024, compared with February 2023, for our top export partners (in order of total annual goods exports) were:
- China: total exports were up $154 million (10 percent).
- The largest rises were milk powder, butter, and cheese, up $159 million; logs, wood, and wood articles, up $91 million; and fish, crustaceans, and molluscs, up $21 million.
- The largest falls were preparations of milk, cereals, flour, and starch, down $48 million; meat and edible offal, down $30 million; and pharmaceutical products, down $17 million.
- Australia: total exports were up $39 million (5.9 percent).
- The largest rises were precious metals, jewellery, and coins, up $28 million and miscellaneous edible preparations, up $15 million.
- The largest fall was milk powder, butter, and cheese, down $12 million.
- USA: total exports were up $305 million (52 percent).
- The largest rises were meat and edible offal, up $85 million; milk powder, butter, and cheese, up $83 million; and mechanical machinery and equipment, up $33 million.
- The largest fall was animal or vegetable fats and oils, down $18 million.
- EU: total exports were up $23 million (7.9 percent).
- The largest rise was milk powder, butter, and cheese, up $12 million.
- There were no significant falls over $10 million.
- Japan: total exports were down $31 million (10 percent).
- The largest rise was meat and edible offal, up $11 million.
- The largest falls were milk powder, butter, and cheese, down $26 million and mineral fuels and oils, down $10 million.
Imports
Goods imports rose by $194 million (3.3 percent), in February 2024 (to $6.1 billion), compared with February 2023.
Petroleum and products lead rise in imports
Petroleum and products rose $166 million (24 percent) to $866 million.
February 2024 value ($ million) |
Change in value ($ million) |
Change in value |
Change in quantity |
|
Petroleum and products |
866 |
166 |
24% |
* |
Diesel |
324 |
-42 |
-11% |
1.8% |
Petrol |
246 |
41 |
20% |
* |
Jet fuel |
240 |
152 |
173% |
200% |
* Changes in total quantity are omitted due to differences in units of measure. |
||||
Top monthly import movements by country
The monthly movements in February 2024, compared with February 2023, for our top import partners (in order of total annual goods imports) were:
- China: total imports were up $86 million (7.1 percent).
- The largest rises were electrical machinery and equipment, up $36 million; plastic and plastic articles, up $23 million; and textiles and textile articles, up $22 million.
- The largest fall was vehicles, parts, and accessories, down $89 million.
- EU: total imports were down $67 million (7.0 percent).
- There were no significant rises over $10 million.
- The largest falls were pharmaceutical products, down $24 million and electrical machinery and equipment, down $14 million.
- Australia: total imports were up $48 million (7.0 percent).
- The largest rises were sugars and sugar confectionery, up $33 million; pharmaceutical products, up $31 million; and vehicles, parts, and accessories, up $27 million.
- The largest falls were cereals, down $40 million and animal or vegetable fats and oils, down $13 million.
- USA: total imports were down $116 million (20 percent).
- There were no significant rises over $10 million.
- The largest falls were mechanical machinery and equipment, down $57 million and vehicles, parts, and accessories, down $21 million.
- South Korea: total imports were up $177 million (42 percent).
- The largest rise was petroleum and products, up $207 million.
- The largest fall was vehicles, parts, and accessories, down $27 million.
Trade deficit in February 2024
The monthly trade balance was a deficit of $218 million.
| Month | Trade balance |
| Feb-15 | 83971642 |
| Mar-15 | 660801360 |
| Apr-15 | 184071873 |
| May-15 | 367170522 |
| Jun-15 | -181952163 |
| Jul-15 | -730443957 |
| Aug-15 | -1090170040 |
| Sep-15 | -1140014218 |
| Oct-15 | -904822585 |
| Nov-15 | -795426228 |
| Dec-15 | -41905853 |
| Jan-16 | 12320231 |
| Feb-16 | 366925311 |
| Mar-16 | 188849850 |
| Apr-16 | 349530073 |
| May-16 | 343078843 |
| Jun-16 | 106790388 |
| Jul-16 | -351427805 |
| Aug-16 | -1239891851 |
| Sep-16 | -1387987389 |
| Oct-16 | -797651150 |
| Nov-16 | -723201112 |
| Dec-16 | -1435171 |
| Jan-17 | -226543047 |
| Feb-17 | -42276469 |
| Mar-17 | 261589138 |
| Apr-17 | 546879922 |
| May-17 | 62020162 |
| Jun-17 | 243117487 |
| Jul-17 | 92027349 |
| Aug-17 | -1174342582 |
| Sep-17 | -1165209854 |
| Oct-17 | -839633458 |
| Nov-17 | -1222417301 |
| Dec-17 | 614310559 |
| Jan-18 | -662421494 |
| Feb-18 | 188256546 |
| Mar-18 | -150609406 |
| Apr-18 | 199745211 |
| May-18 | 199288004 |
| Jun-18 | -285260079 |
| Jul-18 | -203110333 |
| Aug-18 | -1566757996 |
| Sep-18 | -1579921712 |
| Oct-18 | -1305105133 |
| Nov-18 | -1003973060 |
| Dec-18 | 9286883 |
| Jan-19 | -934926531 |
| Feb-19 | -93584137 |
| Mar-19 | 825181314 |
| Apr-19 | 360963002 |
| May-19 | 174927698 |
| Jun-19 | 329812747 |
| Jul-19 | -732335397 |
| Aug-19 | -1641634097 |
| Sep-19 | -1309937148 |
| Oct-19 | -1038380593 |
| Nov-19 | -786493088 |
| Dec-19 | 379772255 |
| Jan-20 | -395635011 |
| Feb-20 | 550639307 |
| Mar-20 | 522807892 |
| Apr-20 | 1374019783 |
| May-20 | 1222702687 |
| Jun-20 | 416538602 |
| Jul-20 | 387761796 |
| Aug-20 | -320606284 |
| Sep-20 | -1132334429 |
| Oct-20 | -465913506 |
| Nov-20 | 679104 |
| Dec-20 | 230069561 |
| Jan-21 | -729765438 |
| Feb-21 | 449847010 |
| Mar-21 | -182555509 |
| Apr-21 | 557914991 |
| May-21 | 404936125 |
| Jun-21 | 442108253 |
| Jul-21 | -387158502 |
| Aug-21 | -2132508281 |
| Sep-21 | -2166033786 |
| Oct-21 | -1282573004 |
| Nov-21 | -1085761728 |
| Dec-21 | -990246456 |
| Jan-22 | -1106744295 |
| Feb-22 | -714801157 |
| Mar-22 | -593488596 |
| Apr-22 | 469495559.5 |
| May-22 | 148263036 |
| Jun-22 | -1132868318 |
| Jul-22 | -1415192071 |
| Aug-22 | -2634137110 |
| Sep-22 | -2519671472 |
| Oct-22 | -2315527621 |
| Nov-22 | -2183787239 |
| Dec-22 | -650530508 |
| Jan-23 | -2095237898 |
| Feb-23 | -846757630 |
| Mar-23 | -1602490156 |
| Apr-23 | 220854073 |
| May-23 | 41615990.2 |
| Jun-23 | -114738381 |
| Jul-23 | -1174149043 |
| Aug-23 | -2266681329 |
| Sep-23 | -2420838856 |
| Oct-23 | -1732504563 |
| Nov-23 | -1258971689 |
| Dec-23 | -376581239 |
| Jan-24 | -1088667290 |
| Feb-24 | -218095599 |
February 2024 year
Annual values are actual and compared with the year ended February 2023.
- Annual goods exports were valued at $68.9 billion, down $3.4 billion from the previous year.
- Annual goods imports were valued at $80.9 billion, down $7.2 billion from the previous year.
- The annual trade deficit was $12.0 billion. In the year ended February 2023 the deficit was $15.8 billion.
| Year | Trade balance |
| Feb-12 | 663398577.4 |
| Mar-12 | 266764072.4 |
| Apr-12 | -554395299.6 |
| May-12 | -849901593.6 |
| Jun-12 | -762502438.6 |
| Jul-12 | -767881506.6 |
| Aug-12 | -888982677.4 |
| Sep-12 | -891350807.4 |
| Oct-12 | -1378944128 |
| Nov-12 | -1389201096 |
| Dec-12 | -1155072488 |
| Jan-13 | -1288043737 |
| Feb-13 | -1066319815 |
| Mar-13 | -520650473.8 |
| Apr-13 | -686505191.9 |
| May-13 | -901370376.9 |
| Jun-13 | -819339518.9 |
| Jul-13 | -1704983254 |
| Aug-13 | -2129039774 |
| Sep-13 | -1559173572 |
| Oct-13 | -1014147600 |
| Nov-13 | -273792891.1 |
| Dec-13 | -316678281.6 |
| Jan-14 | 261872324.7 |
| Feb-14 | 626656729.7 |
| Mar-14 | 798308321.7 |
| Apr-14 | 1095053945 |
| May-14 | 1319568933 |
| Jun-14 | 1188788452 |
| Jul-14 | 1034361247 |
| Aug-14 | 1805429958 |
| Sep-14 | 667403260.8 |
| Oct-14 | -55529708.2 |
| Nov-14 | -491585024.2 |
| Dec-14 | -1183419240 |
| Jan-15 | -1416085181 |
| Feb-15 | -2129195222 |
| Mar-15 | -2372062053 |
| Apr-15 | -2655363178 |
| May-15 | -2552535649 |
| Jun-15 | -2974536000 |
| Jul-15 | -2762446249 |
| Aug-15 | -3388079713 |
| Sep-15 | -3169130897 |
| Oct-15 | -3182409618 |
| Nov-15 | -3694857477 |
| Dec-15 | -3536562994 |
| Jan-16 | -3576399416 |
| Feb-16 | -3293445747 |
| Mar-16 | -3765397257 |
| Apr-16 | -3599939057 |
| May-16 | -3624030736 |
| Jun-16 | -3335288185 |
| Jul-16 | -2956272033 |
| Aug-16 | -3105993844 |
| Sep-16 | -3353967015 |
| Oct-16 | -3246795580 |
| Nov-16 | -3174570464 |
| Dec-16 | -3134099782 |
| Jan-17 | -3372963060 |
| Feb-17 | -3782164840 |
| Mar-17 | -3709425552 |
| Apr-17 | -3512075703 |
| May-17 | -3793134384 |
| Jun-17 | -3656807285 |
| Jul-17 | -3213352131 |
| Aug-17 | -3147802862 |
| Sep-17 | -2925025327 |
| Oct-17 | -2967007635 |
| Nov-17 | -3466223824 |
| Dec-17 | -2850478094 |
| Jan-18 | -3286356541 |
| Feb-18 | -3055823526 |
| Mar-18 | -3468022070 |
| Apr-18 | -3815156781 |
| May-18 | -3677888939 |
| Jun-18 | -4206266505 |
| Jul-18 | -4501404187 |
| Aug-18 | -4893819601 |
| Sep-18 | -5308531459 |
| Oct-18 | -5774003134 |
| Nov-18 | -5555558893 |
| Dec-18 | -6160582569 |
| Jan-19 | -6433087606 |
| Feb-19 | -6714928289 |
| Mar-19 | -5739137569 |
| Apr-19 | -5577919778 |
| May-19 | -5602280084 |
| Jun-19 | -4987207258 |
| Jul-19 | -5516432322 |
| Aug-19 | -5591308423 |
| Sep-19 | -5321323859 |
| Oct-19 | -5054599319 |
| Nov-19 | -4837119347 |
| Dec-19 | -4466633975 |
| Jan-20 | -3927342455 |
| Feb-20 | -3283119011 |
| Mar-20 | -3585492433 |
| Apr-20 | -2572435652 |
| May-20 | -1524660663 |
| Jun-20 | -1437934808 |
| Jul-20 | -317837615 |
| Aug-20 | 1003190198 |
| Sep-20 | 1180792917 |
| Oct-20 | 1753260004 |
| Nov-20 | 2540432196 |
| Dec-20 | 2390729502 |
| Jan-21 | 2056599075 |
| Feb-21 | 1955806778 |
| Mar-21 | 1250443377 |
| Apr-21 | 434338585 |
| May-21 | -383427977 |
| Jun-21 | -357858326 |
| Jul-21 | -1132778624 |
| Aug-21 | -2944680621 |
| Sep-21 | -3978379978 |
| Oct-21 | -4795039476 |
| Nov-21 | -5881480308 |
| Dec-21 | -7101796325 |
| Jan-22 | -7478775182 |
| Feb-22 | -8643423349 |
| Mar-22 | -9054356436 |
| Apr-22 | -9142775867 |
| May-22 | -9399448956 |
| Jun-22 | -10974425528 |
| Jul-22 | -12002459097 |
| Aug-22 | -12504087926 |
| Sep-22 | -12857725612 |
| Oct-22 | -13890680229 |
| Nov-22 | -14988705740 |
| Dec-22 | -14648989792 |
| Jan-23 | -15637483395 |
| Feb-23 | -15769439868 |
| Mar-23 | -16778441428 |
| Apr-23 | -17027082914 |
| May-23 | -17133729960 |
| Jun-23 | -16115600023 |
| Jul-23 | -15874556995 |
| Aug-23 | -15507101214 |
| Sep-23 | -15408268598 |
| Oct-23 | -14825245540 |
| Nov-23 | -13900429990 |
| Dec-23 | -13626480721 |
| Jan-24 | -12619910113 |
| Feb-24 | -11991248082 |
| Year | Exports | Imports |
| Feb-12 | 47880112896 | 47216714319 |
| Mar-12 | 47468228908 | 47201464836 |
| Apr-12 | 46652215164 | 47206610464 |
| May-12 | 46464577295 | 47314478889 |
| Jun-12 | 46688062463 | 47450564902 |
| Jul-12 | 47024532043 | 47792413550 |
| Aug-12 | 46902580753 | 47791563431 |
| Sep-12 | 46748201197 | 47639552005 |
| Oct-12 | 46325381943 | 47704326072 |
| Nov-12 | 46244855731 | 47634056828 |
| Dec-12 | 46064057146 | 47219129634 |
| Jan-13 | 45684264233 | 46972307970 |
| Feb-13 | 45959347612 | 47025667427 |
| Mar-13 | 46160364525 | 46681014999 |
| Apr-13 | 46233655653 | 46920160845 |
| May-13 | 45878406742 | 46779777119 |
| Jun-13 | 45704290138 | 46523629657 |
| Jul-13 | 45488120687 | 47193103941 |
| Aug-13 | 45475128020 | 47604167795 |
| Sep-13 | 46004783845 | 47563957418 |
| Oct-13 | 46782091774 | 47796239375 |
| Nov-13 | 47396776750 | 47670569642 |
| Dec-13 | 48043670100 | 48360348382 |
| Jan-14 | 48764834860 | 48502962536 |
| Feb-14 | 49403232675 | 48776575946 |
| Mar-14 | 50027958728 | 49229650407 |
| Apr-14 | 50491458212 | 49396404267 |
| May-14 | 50989992815 | 49670423882 |
| Jun-14 | 51161136425 | 49972347973 |
| Jul-14 | 51017556730 | 49983195483 |
| Aug-14 | 51254401927 | 49448971969 |
| Sep-14 | 51053416397 | 50386013136 |
| Oct-14 | 50823329360 | 50878859068 |
| Nov-14 | 50421695797 | 50913280821 |
| Dec-14 | 50074641250 | 51258060490 |
| Jan-15 | 49687287730 | 51103372911 |
| Feb-15 | 49042886225 | 51172081447 |
| Mar-15 | 48915143951 | 51287206004 |
| Apr-15 | 48642733035 | 51298096213 |
| May-15 | 48423057431 | 50975593080 |
| Jun-15 | 48396163181 | 51370699181 |
| Jul-15 | 48880453005 | 51642899254 |
| Aug-15 | 49057455495 | 52445535208 |
| Sep-15 | 49117987199 | 52287118096 |
| Oct-15 | 48918947187 | 52101356805 |
| Nov-15 | 48952719875 | 52647577352 |
| Dec-15 | 48973550776 | 52510113770 |
| Jan-16 | 49187466085 | 52763865501 |
| Feb-16 | 49537612567 | 52831058314 |
| Mar-16 | 48833243763 | 52598641020 |
| Apr-16 | 49026536183 | 52626475240 |
| May-16 | 49230155446 | 52854186182 |
| Jun-16 | 49324864243 | 52660152428 |
| Jul-16 | 49121608220 | 52077880253 |
| Aug-16 | 48793893786 | 51899887630 |
| Sep-16 | 48583604241 | 51937571256 |
| Oct-16 | 48696300602 | 51943096182 |
| Nov-16 | 48493856234 | 51668426698 |
| Dec-16 | 48486904078 | 51621003860 |
| Jan-17 | 48527688853 | 51900651913 |
| Feb-17 | 48305011954 | 52087176794 |
| Mar-17 | 48694076739 | 52403502291 |
| Apr-17 | 49076148830 | 52588224533 |
| May-17 | 49424472301 | 53217606685 |
| Jun-17 | 49873491508 | 53530298793 |
| Jul-17 | 50528773127 | 53742125258 |
| Aug-17 | 50834401328 | 53982204190 |
| Sep-17 | 51160043929 | 54085069256 |
| Oct-17 | 51791672041 | 54758679676 |
| Nov-17 | 52532859588 | 55999083412 |
| Dec-17 | 53625488161 | 56475966255 |
| Jan-18 | 53965184420 | 57251540961 |
| Feb-18 | 54395355682 | 57451179208 |
| Mar-18 | 54602966051 | 58070988121 |
| Apr-18 | 54860205151 | 58675361932 |
| May-18 | 55304076433 | 58981965372 |
| Jun-18 | 55490192916 | 59696459421 |
| Jul-18 | 56206201587 | 60707605774 |
| Aug-18 | 56493336022 | 61387155623 |
| Sep-18 | 56954044261 | 62262575720 |
| Oct-18 | 57226558637 | 63000561771 |
| Nov-18 | 57470599037 | 63026157930 |
| Dec-18 | 57251104265 | 63411686834 |
| Jan-19 | 57320341207 | 63753428813 |
| Feb-19 | 57583937302 | 64298865591 |
| Mar-19 | 58386241764 | 64125379333 |
| Apr-19 | 58900924296 | 64478844074 |
| May-19 | 59293597157 | 64895877241 |
| Jun-19 | 59378412551 | 64365619809 |
| Jul-19 | 58963308257 | 64479740579 |
| Aug-19 | 59050318141 | 64641626564 |
| Sep-19 | 59153331446 | 64474655305 |
| Oct-19 | 59330562863 | 64385162182 |
| Nov-19 | 59689705163 | 64526824510 |
| Dec-19 | 59899236281 | 64365870256 |
| Jan-20 | 60232430772 | 64159773227 |
| Feb-20 | 60412604751 | 63695723762 |
| Mar-20 | 60424643728 | 64010136161 |
| Apr-20 | 60267881085 | 62840316737 |
| May-20 | 59860029862 | 61384690525 |
| Jun-20 | 59923371349 | 61361306157 |
| Jul-20 | 59958852127 | 60276689742 |
| Aug-20 | 60267415950 | 59264225752 |
| Sep-20 | 59811824505 | 58631031588 |
| Oct-20 | 59608519266 | 57855259262 |
| Nov-20 | 59310670094 | 56770237898 |
| Dec-20 | 59352090268 | 56961360766 |
| Jan-21 | 58791158732 | 56734559657 |
| Feb-21 | 58648923039 | 56693116261 |
| Mar-21 | 58509007529 | 57258564152 |
| Apr-21 | 58727983912 | 58293645327 |
| May-21 | 59187764622 | 59571192599 |
| Jun-21 | 60317064345 | 60674922671 |
| Jul-21 | 61137731227 | 62270509851 |
| Aug-21 | 61130377632 | 64075058253 |
| Sep-21 | 61626437404 | 65604817382 |
| Oct-21 | 62203301840 | 66998341316 |
| Nov-21 | 62957144846 | 68838625154 |
| Dec-21 | 63494172023 | 70595968348 |
| Jan-22 | 64179336420 | 71658111602 |
| Feb-22 | 64623309414 | 73266732763 |
| Mar-22 | 65620086364 | 74674442800 |
| Apr-22 | 66238532811 | 75381308679 |
| May-22 | 67249624549 | 76649073506 |
| Jun-22 | 67320451696 | 78294877224 |
| Jul-22 | 67880911372 | 79883370469 |
| Aug-22 | 68799762323 | 81303850249 |
| Sep-22 | 70313919973 | 83171645585 |
| Oct-22 | 70886872314 | 84777552543 |
| Nov-22 | 71544229919 | 86532935659 |
| Dec-22 | 71970611821 | 86619601613 |
| Jan-23 | 72476808672 | 88114292067 |
| Feb-23 | 72353029898 | 88122469766 |
| Mar-23 | 72141630258 | 88920071686 |
| Apr-23 | 72569483052 | 89596565966 |
| May-23 | 72717557731 | 89851287691 |
| Jun-23 | 72672011431 | 88787611454 |
| Jul-23 | 71711512987 | 87586069982 |
| Aug-23 | 71402878992 | 86909980206 |
| Sep-23 | 70258409955 | 85666678553 |
| Oct-23 | 69672337565 | 84497583105 |
| Nov-23 | 69280620301 | 83181050291 |
| Dec-23 | 68616904361 | 82243385082 |
| Jan-24 | 68125102872 | 80745012985 |
| Feb-24 | 68948229179 | 80939477261 |
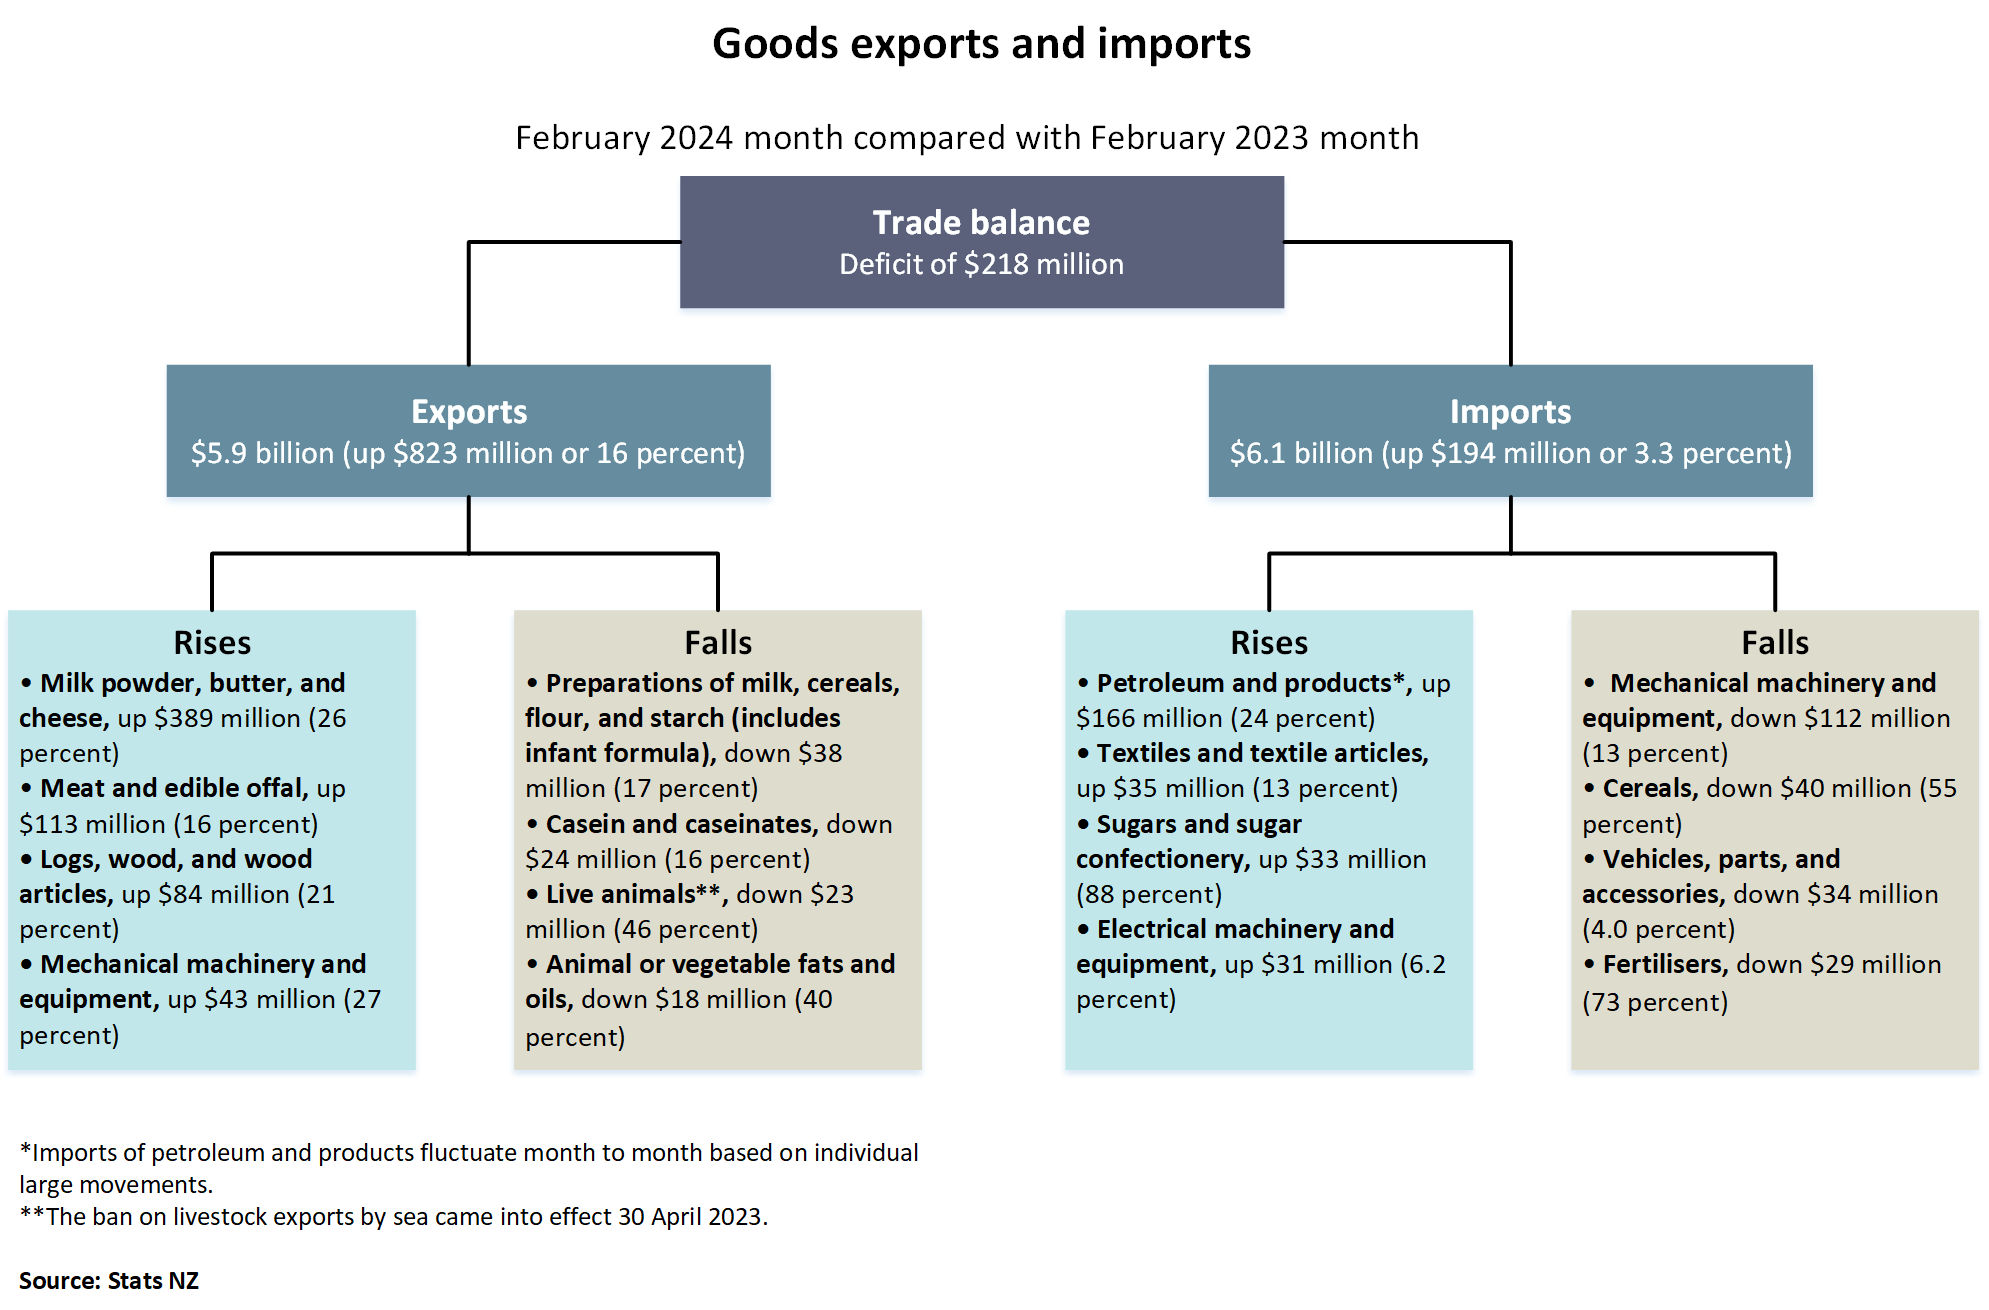
Text alternative for Goods exports and imports, February 2024 month compared with February 2023 month
The diagram shows goods exports and imports for the February 2024 month compared with the February 2023 month.
The trade balance is a deficit of $218 million. This is the difference between exports valued at $5.9 billion (up $823 million or 16 percent) and imports valued at $6.1 billion (up $194 million or 3.3 percent).
Export commodities that rose included: milk powder, butter, and cheese, up $389 million (26 percent); meat and edible offal, up $113 million (16 percent); logs, wood, and wood articles, up $84 million (21 percent); mechanical machinery and equipment, up $43 million (27 percent).
Export commodities that fell included: preparations of milk, cereals, flour, and starch (includes infant formula), down $38 million (17 percent); casein and caseinates, down $24 million (16 percent); live animals**, down $23 million (46 percent); animal or vegetable fats and oils, down $18 million (40 percent).
Import commodities that rose included: petroleum and products*, up $166 million (24 percent); textiles and textile articles, up $35 million (13 percent); sugars and sugar confectionery, up $33 million (88 percent); electrical machinery and equipment, up $31 million (6.2 percent).
Import commodities that fell included: mechanical machinery and equipment, down $112 million (13 percent); cereals, down $40 million (55 percent); vehicles, parts, and accessories, down $34 million (4.0 percent); fertilisers, down $29 million (73 percent).
* Imports of petroleum and products fluctuate month to month based on individual large movements.
**The ban on livestock exports by sea came into effect 30 April 2023.
Source: Stats NZ
More data
Use Infoshare to access time-series data for imports and exports.
Subject category: Imports and exports
Overseas merchandise trade datasets has CSV data for goods imports and exports.
International trade: December 2023 quarter has information on trade in goods and services.
Definitions and metadata
Overseas merchandise trade - DataInfo+ provides the definitions of terms used in this release and general methodology used to produce overseas merchandise trade statistics.
Technical enquiries
Taylor Nutira
04 931 4600
[email protected]
ISSN 1178-0320
Next release
Overseas merchandise trade: March 2024 will be released on 24 April 2024.


