Living income are increasingly considered as an important strategy to guarantee that smallholder farmers' revenues are sufficient to meet their own basic needs and those of their families as well as to put aside some savings, thus being more likely to find their way out of poverty. There is widespread acceptance of an international standard for measuring living income and an active community of practice to support its implementation.
Living income are increasingly considered as an important strategy to guarantee that smallholder farmers' revenues are sufficient to meet their own basic needs and those of their families as well as to put aside some savings, thus being more likely to find their way out of poverty. There is widespread acceptance of an international standard for measuring living income and an active community of practice to support its implementation.
The last few years, a lot of effort and resources have been devoted to the estimation of living income benchmarks in a broad range of countries and for different commodities, rural and (peri)urban locations and types of farms. This information is conveniently bundled in the living-wage-and-income-dataset that includes more than 120 detailed field studies that measure living income benchmarks. There are still considerable differences between these estimates for the same location.
Notwithstanding these valuable efforts, it is important to ask the question whether these living income benchmarks could be assessed in a less cumbersome manner. And whether living incomes could be estimated from available open data sources. We therefore looked particularly at the poverty line estimates by the World Bank that might provide us with an acceptable proxy for the living income benchmark. Poverty line data is widely available and consistently considers differences in purchasing power between countries. These poverty estimates are computed from household survey data collected from nationally representative samples of households.
Relationship poverty line and living income
It is worthwhile to take a closer look at the relationship between poverty lines and living income estimates. Using available data we analysed whether such a systematic and meaningful relationship can be detected. This might enable us to considerably reduce time investments in field measurement and create more space for the development of serious proposals for reducing the current living income gap.
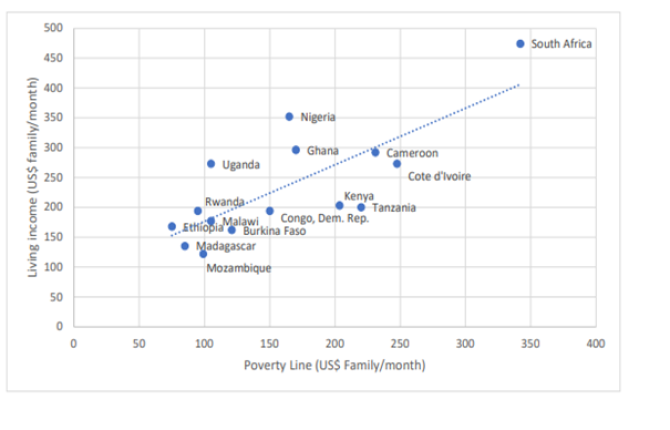
We therefore made an effort to assess the relationship between (family per month) living income with the poverty line (per family/month) for rural areas in 15 sub-Saharan countries for the year 2021 (see Figure 1). On average, living incomes are 50% higher than poverty lines. In some countries (Uganda, South Africa, Nigeria and Ghana) the living income benchmark is twice as high as the World Bank poverty line, whereas in other countries like Kenya and Tanzania differences are small to negligible
We can estimate a regression that takes living income as the outcome (dependent variable) and the poverty line as the independent variable. Living income becomes a function of a fixed intercept (reflecting country-level development as determined by resource availability, social and physical infrastructure, urbanization and education) and a correlation coefficient that indicates how the poverty line relates to living income (reflecting the return to resources). The (dotted) regression line indicates that most observations are fairly equally distributed around the estimated values, and that 61% of the difference are explained by the regression function. Moreover, the explanatory variable (poverty line) is very significant.
The dotted regression line has the following function: Living Income = 82 + 0.95*(Poverty Line). The graph indicates that the average relationship between poverty line and living income is fairly robust. But some countries (i.e. Nigeria, Ghana, Uganda) register higher living incomes benchmarks. We would need an upward shift of the intercept with 35-45% to ensure that households in these countries reach their minimum living income benchmark. The downside is that some other countries that have a very low poverty line (i.e. Ethiopia, Rwanda, Mozambique, Madagascar) would then receive 20-30% too much living incomes (compared to their benchmarks). This indicates that more disaggregation is required between different types of countries for reaching an acceptable average living income estimate.
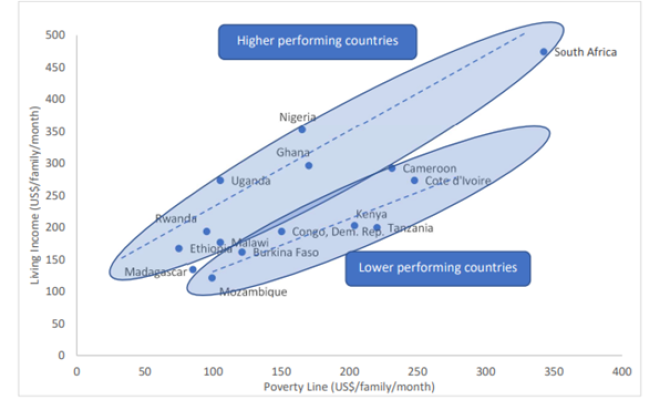
As can be noted from Figure 1, countries with relatively high living income gaps compared to the poverty line (> 25%) are characterized by stronger growth dynamics and their economies also tend to be more market-oriented. These 'higher-performing' countries face larger challenges to guarantee that domestic incomes satisfy minimum living conditions, since risks are high and access to innovations for improving factor productivity of land and labour remains limited. On the other hand, in several other 'lower performing' SSA countries, the gap between poverty and living income levels is fairly small (and sometimes even negative), basically because there is still a lot of subsistence production and limited access to land, labour and capital markets constrains efforts for poverty reduction.
In order reduce this heterogeneity - and thus avoid too much variation between countries that respond to the same poverty-income equation - we divided the sample in two groups that maintain low standard deviations on the key parameters and thus have on average less than 7% differences between what the equation delivers as living income estimate and what the field data effectively register. We identify two different categories of country dynamics (see Figure 2):
a) Higher performing countries : Living Income = 87 + 1.02*(Poverty Line) (N=8, R2 = 85%)
Countries with higher rates of economic development, better infrastructure facilities, higher enrolment in education and more coverage of mobile phone networks have more favourable resource endowments (reflected by the higher intercept), and are therefore better able to translate reductions in poverty with improvements in living incomes (illustrated by the higher coefficient and the steeper curve). Typical countries in this category are Nigeria, Ghana, Ethiopia and Rwanda.
b) Lower performing countries
Countries with lower levels of economic development, infrastructure limitations, less educational performance and lower mobile phone coverage start their development path at a lower income level (shown by the smaller intercept), and need more reduction in poverty to reach a subsequent improvement in living income (reflected in the lower coefficient of the flatter curve). Typical countries in this category are DR Congo, Burkina Faso, Cameroon and Mozambique.
These categories of countries are far more homogeneous with respect to the Poverty Line - Living Income relationship and therefore the estimated regression function can be used as a suitable approximation for identifying the living income benchmark. This may not only save time and money that is nowadays invested in living income measurement, but can also be used better to focus on pathways for reducing the income gap in practice. Given the structural differences between SSA countries, we would expect two specific strategic priorities:
- for higher performing countries where initial resource conditions are better guaranteed, reaching living wages will depend especially on the strategies for increasing the responsiveness to poverty reduction by improving the return to resources. This is mostly related to innovations in crop yields (i.e. yield gap reduction), improvements in crop mix (i.e. crop diversification) or higher wages in (off-farm) work, reflected in a steeper regression function.
- for lower performing countries that start with less physical and social infrastructure, opportunities for reaching and improving living income levels are likely to be based on strategies for enhancing access to land and/or opportunities for engagement in off-farm employment that lead to an upward shift (or rise of the intercept) of the regression function.
Better understanding of the relationship poverty line and living income can be considered as an attractive shortcut for identifying structural conditions behind living income gaps and to identify strategic opportunities to support poverty reduction in line with living income benchmarks.


