Subnational population estimates give the best available measure of the population, by age and sex, usually living in New Zealand's 16 regions, 67 territorial authority areas, 21 Auckland local board areas, and other areas.
On this page
Key facts
Canterbury population the fastest growing
1,700 more people move out of Wellington region than move into it
Seven cities have population decline or remain largely unchanged
Auckland's net migration falls below natural increase
Key drivers of population change
Growing number of TALBs have more deaths than births
Method of estimation
Updates to migration and population estimates
Definitions
More data
Key facts
In the year ended June 2025, provisional estimates of the population usually living in each area within Aotearoa New Zealand indicate:
- almost all areas had slower population growth than in 2024, with national population growth decreasing from 1.7 percent in the year ending June 2024, to 0.7 percent in 2025
- nationally, natural increase (21,000) contributed to population growth more than net migration (13,700) for the first time in over a decade, excluding when COVID-19 impacted net migration
- the South Island population grew faster than the North Island (increasing by 0.8 percent and 0.6 percent respectively).
Population growth in regions
- The population of 10 out of 16 regions increased in the year ending June 2025, although all regions had slower growth than in the June 2024 year.
- Nelson, Marlborough, Gisborne, and Hawke's Bay populations decreased, while Taranaki and Wellington had almost no population change (0.0 percent).
- Canterbury was the fastest-growing region (up 1.1 percent), followed by Auckland and Waikato (both up 1.0 percent).
Population growth in territorial authority and Auckland local board areas
Territorial authorities (TAs) and Auckland local board areas (ALBs) are collectively called TALBs.
- Three-quarters (64 out of 87) of TALBs experienced population increase.
- Papakura local board area was the fastest growing TALB (up 2.6 percent).
- Selwyn district (up 2.4 percent) was the fastest growing TA, and the second-fastest growing TALB.
- Other fast-growing TALBs were Henderson-Massey ALB (up 1.8 percent), and Howick ALB and Queenstown-Lakes district (each up 1.7 percent).
- All but one TALB had slower growth in the year ending June 2025 compared with the year ending June 2024 (Aotea/Great Barrier local board grew 0.5 percent in the year ending June 2025, compared with 0.1 percent in the year ending June 2024).
Canterbury population the fastest growing
Canterbury's population grew by around 7,600 people in the year ended June 2025, to 698,200, an increase of 1.1 percent over the year. This was the fastest population growth of all New Zealand's 16 regions.
Most of Canterbury's population growth in the June 2025 year was from population increase in:
- Christchurch city (accounting for 52 percent of Canterbury's growth, with its population growing by 1.0 percent)
- Selwyn district (27 percent, growing by 2.4 percent)
- Waimakariri district (10 percent, growing by 1.1 percent)
- Ashburton district (5 percent, growing by 1.1 percent).
Canterbury had a provisional net migration gain of 5,300, with gains in both net internal migration (3,700) and net international migration (1,600). Canterbury also had natural increase of 2,300.
Definitions explains net internal migration, net international migration, and natural increase.
1,700 more people move out of Wellington region than move into it
Wellington region had almost no population change in the June 2025 year (0.0 percent). Although the region had a small provisional net internal migration gain, this was not enough to offset the provisional net international migration loss of 1,700. Wellington region also gained 1,700 through natural increase.
Wellington region had four TAs where the population decreased in the June 2025 year:
- Porirua city (-0.4 percent)
- Wellington city (-0.3 percent)
- Upper Hutt city (-0.2 percent)
- Carterton district (-0.2 percent).
The majority of the net migration loss (internal and international) from Wellington region was from Wellington city, with a provisional loss of 1,500. Porirua city had the second largest net migration loss within Wellington region (-580).
Lower Hutt city and Masterton district had the largest population growth within the Wellington region, each growing by 0.7 percent in the June 2025 year, or 830 and 210 people respectively. Most of Lower Hutt's growth was from natural increase. However, both Lower Hutt and Masterton had provisional net migration gains of 140 and 180 respectively.
Seven cities have population decline or remain largely unchanged
Of New Zealand's 12 cities (territorial authority areas listed as city council areas) plus Auckland, five experienced population loss in the June 2025 year, and two remained largely unchanged. Auckland and a further five cities experienced population growth. In comparison, all cities experienced population growth in the June 2024 year.
Porirua city had the largest population decrease (down 0.4 percent) in the June 2025 year, followed by Wellington, Napier, and Nelson (down 0.3 percent), and Upper Hutt (down 0.2 percent). Cities that had population decrease all had net migration loss, ranging between -1,500 in Wellington and -110 in Nelson (from both internal and international migration).
Wellington city had the largest net migration loss in the June 2025 year across all TALBs. While Wellington had a net internal migration gain of 210, along with natural increase of 750, this was not enough to offset the net international migration loss of 1,700.
Dunedin and Palmerston North had almost no change in total population in the June 2025 year. Dunedin had a net migration gain of 50, but this was not enough to offset the natural decrease of 90 more deaths than births. Palmerston North had a net migration loss of 300, which was mostly offset by a natural increase of 290.
Hamilton city, growing by 1.4 percent in the June 2025 year, was the fastest growing city council area, reaching 192,100 people at 30 June 2025. While Hamilton had a net internal migration loss of around -800, it was balanced by a net international migration gain of 1,900, and natural increase of 1,500, resulting in Hamilton's population increasing by 2,600 people.
Auckland (1.8 million people) and Christchurch (419,200 people) were the next fastest growing cities, both increasing by 1.0 percent in the June 2025 year. Auckland had the largest net internal migration loss in the June 2025 year, with 3,200 more people moving out of Auckland to other parts of New Zealand. However, the loss was offset by international migration gains into Auckland (9,500) and natural increase (11,400).
Christchurch had the highest net internal migration gain out of all of the cities, with 1,700 more people moving there from other parts of New Zealand. Christchurch also had a net international migration gain of 980, and natural increase of 1,300.
| Area | Natural increase | Net internal migration | Net international migration |
| Christchurch | 1300 | 1700 | 980 |
| Hamilton | 1500 | -800 | 1900 |
| Lower Hutt | 690 | -150 | 290 |
| Tauranga | 460 | -120 | -170 |
| Invercargill | -40 | -270 | 450 |
| Palmerston North | 290 | -620 | 320 |
| Dunedin | -90 | 170 | -120 |
| Upper Hutt | 100 | -70 | -110 |
| Nelson | -50 | -230 | 110 |
| Napier | 30 | -450 | 230 |
| Porirua | 350 | -400 | -170 |
| Wellington | 750 | 210 | -1700 |
Nearly 2 in 3 people living in New Zealand live in Auckland or one of New Zealand's 12 cities (64 percent). This proportion has remained similar over the last three decades.
Of the people living in New Zealand's cities, just over half (53 percent) live in Auckland. A further 12 percent live in Christchurch, while Hamilton and Wellington are home to another 6 percent each. These proportions have remained relatively similar over the last decade.
Auckland's net migration falls below natural increase
Natural increase was the largest driver of population growth in 12 of the 21 Auckland local board areas (ALBs), along with Auckland as a whole, in the year ended June 2025. Papakura, the fastest growing ALB in 2025, and Henderson-Massey (second-fastest growing ALB), had the largest natural increase (1,200 each). Other ALBs with high natural increase included Ōtara-Papatoetoe (1,200), and Manurewa (1,100). Together, these four areas accounted for 42 percent of Auckland's total natural increase (11,400).
Auckland had a net international migration gain of 9,500 compared with 36,200 in the year ended June 2024. Within Auckland, Howick and Ōtara-Papatoetoe local boards had the largest net international migration gains of 1,800 and 1,500 respectively. The largest net international migration losses were in Ōrākei (-560), Rodney (-280), and Franklin (-130) ALBs.
Around 3,200 more people moved out of Auckland to other parts of the country than the reverse, in the June 2025 year. Within Auckland, 11 of the 21 ALBs had net internal migration loss, noting that this includes people moving to other ALBs as well as other TAs. Waitematā had the largest internal migration loss (-1,500), followed by Ōtara-Papatoetoe (-1,200).
| Area | Natural increase | Net internal migration | Net international migration |
| Howick | 910 | 190 | 1800 |
| Henderson-Massey | 1200 | 360 | 880 |
| Papakura | 1200 | 350 | 570 |
| Ōtara-Papatoetoe | 1200 | -1200 | 1500 |
| Maungakiekie-Tāmaki | 710 | 190 | 490 |
| Whau | 600 | -360 | 1100 |
| Manurewa | 1100 | -630 | 790 |
| Kaipātiki | 670 | -180 | 490 |
| Upper Harbour | 300 | 210 | 380 |
| Rodney | 380 | 710 | -280 |
| Puketāpapa | 350 | -300 | 700 |
| Hibiscus and Bays | 160 | 510 | -10 |
| Franklin | 400 | 330 | -130 |
| Māngere-Ōtāhuhu | 910 | -980 | 680 |
| Waitākere Ranges | 430 | -170 | -70 |
| Albert-Eden | 330 | -470 | 180 |
| Aotea/Great Barrier | 0 | 10 | 0 |
| Waiheke | 10 | -60 | -20 |
| Devonport-Takapuna | 110 | -330 | 100 |
| Waitematā | 270 | -1500 | 870 |
| Ōrākei | 120 | 90 | -560 |
| Area | Natural increase | Net internal migration | Net international migration |
| Hamilton | 1500 | -800 | 1900 |
| Selwyn | 690 | 1400 | -10 |
| Queenstown-Lakes | 450 | 400 | 50 |
| Waimakariri | 170 | 800 | -180 |
| Waipa | 170 | 480 | 0 |
| Taupō | 160 | 140 | 150 |
| Southland | 200 | -130 | 370 |
| Matamata-Piako | 120 | 110 | 190 |
| Central Otago | 0 | 360 | -20 |
| Mackenzie | 20 | 0 | 50 |
Growing number of TALBs have more deaths than births
There were 16 TALBs that had natural decreases in the year ended June 2025; that is, more deaths than births. The TALBs with the largest natural decreases were Kapiti Coast district (170 more deaths than births), Thames-Coromandel district (140 more deaths), Dunedin city (90 more deaths), and Whanganui and Timaru districts (each with 70 more deaths).
In the year ended June 2020, only seven TALBs experienced natural decrease: Kapiti Coast, Thames-Coromandel, Timaru, Buller, Horowhenua, Gore, and Waitaki districts.
Natural decrease reflects New Zealand's ageing population and is more likely to occur in areas with higher proportions of older people, and/or where internal migration is concentrated in certain ages. For example, areas that have net migration gains of older people and/or net migration losses of younger people are more likely to be areas with natural decrease or have only small gains through natural increase. As New Zealand's population ages, there will likely be an increasing number of areas with natural decreases.
Subnational population projections: 2023(base)-2053 has more information on future projected components of population change.
Method of estimation
TALB population estimates are derived using a cohort component method. The current starting point is population estimates at 30 June 2023 based on the 2023 Census of Population and Dwellings : At 30 June 2023). Estimates after 30 June 2023 are updated to account for births, deaths, and net migration after 30 June 2023.
Births, deaths, and net migration are estimates of the number of events that occurred during the current year ended 30 June. The contributions of net internal and net international migration to population change for TALB areas are estimated independently, and each type of net migration is calculated as the difference between in- and out-migration.
The subnational estimates are constrained to agree with the corresponding national estimated resident population at the time of publication.
DataInfo+ has more information on methodology used to calculate subnational population estimates.
Subnational migration estimates for territorial authority and Auckland local board areas at 30 June: Data sources and methods provides an indication of the data sources and methods used to produce internal and international migration.
Updates to migration and population estimates
New Zealand's net international migration in the years ended June 2024 and 2025 were provisionally estimated at 70,400 and 13,700 respectively (consistent with the National population estimates: At 30 June 2025 published on 19 August 2025). These international migration estimates differ slightly from the latest available international migration estimates, which are revised monthly. The monthly estimates are available in Infoshare > Tourism > International Travel and Migration > 'Estimated migration by direction, 12/16-month rule'.
These subnational population estimates may also differ slightly from subsequent national population estimates, which are revised quarterly (next release 17 November 2025).
Subnational population estimates are currently updated annually. Estimates for 2024 and 2025 will be updated when the 2026 estimates are published in October 2026. All population estimates after June 2023 will also be rebased when new information is available from a new census.
Definitions
Net internal migration: the number of people who have arrived to live in an area from other areas of New Zealand, minus those who have left that area to live in other areas of New Zealand.
Net international migration: the number of migrant arrivals into New Zealand, minus the number of migrant departures out of New Zealand.
Natural increase/decrease: the difference between (live) births and deaths. Natural increase refers to more births than deaths. Natural decrease refers to more deaths than births.
TALBs: Territorial authority areas and Auckland local board areas. Separately territorial authority areas are referred to as TAs, and Auckland local board areas as ALBs, but when combined, they are referred to as TALBs.
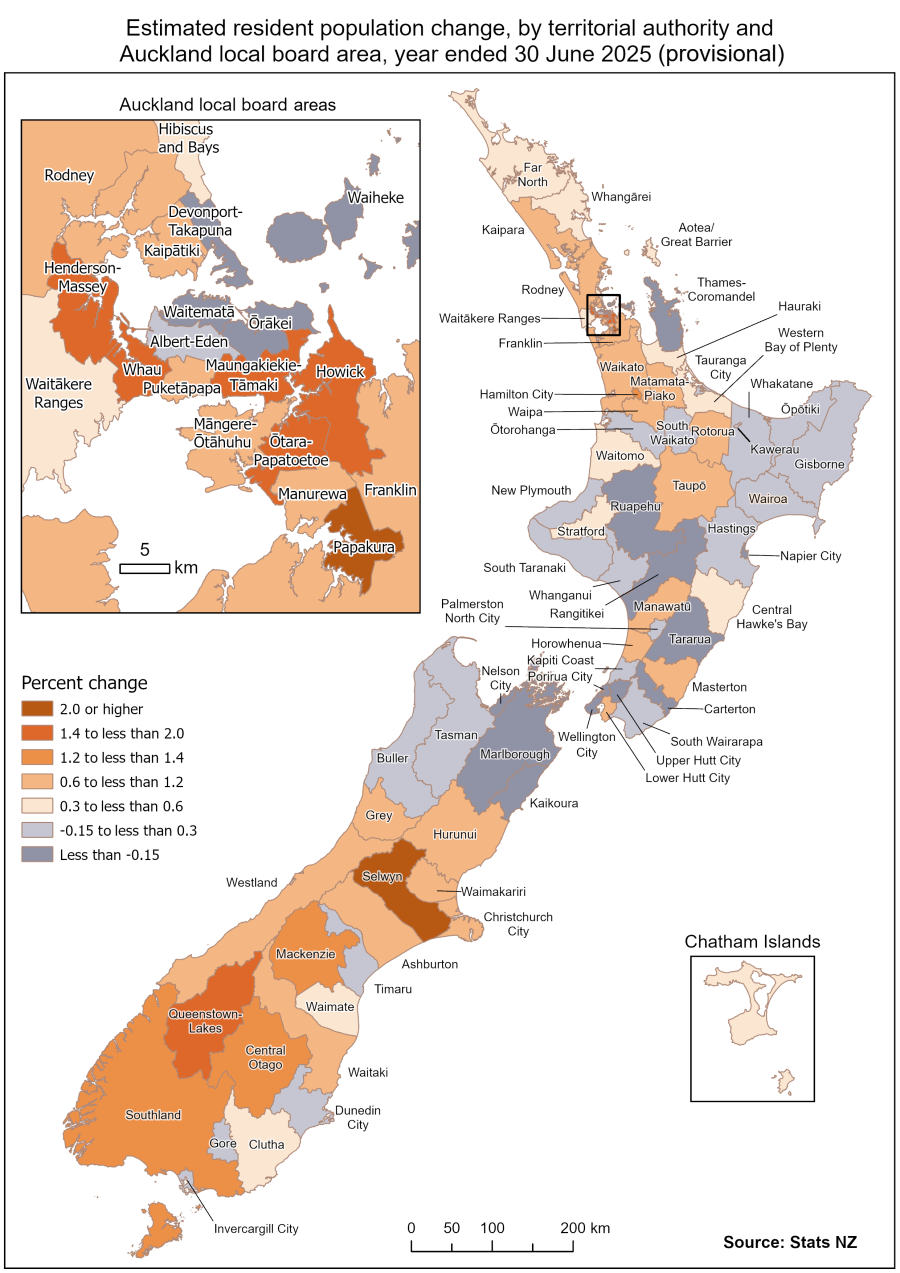
Text alternative for map, Estimated resident population change, by territorial authority and Auckland local board area, year ended 30 June 2025 (provisional)
The map shows the territorial authority and Auckland local board areas, each assigned a colour to show the range of change in the estimated resident population in the year ended 30 June 2025. The colours are grouped into annual percent change of: less than negative 0.15 percent; negative 0.15 to less than 0.3 percent; 0.3 percent to less than 0.6 percent; 0.6 percent to less than 1.2 percent; 1.2 percent to less than 1.4 percent; 1.4 percent to less than 2.0 percent; and 2.0 percent or higher. The annual change ranged from 2.6 percent growth in Papakura local board area to 0.9 percent decline in Waiheke local board area.
More data
Subnational population estimates tables are available in our free online tool Infoshare. Select the following categories:
Subject category: Population
Group: Population estimates - DPE
Access data in Aotearoa Data Explorer
Aotearoa Data Explorer - Subnational population estimates can be used to view and download tables with data for different subnational areas including regions, territorial authority and Auckland local board areas, statistical areas 2 and 3 (SA2 and SA3), health regions and districts, urban rural areas, and functional urban areas.
How to use Aotearoa Data Explorer contains video tutorials and a user guide.
Subnational population estimates by local government electoral boundaries will be released on 12 December 2025, following the latest boundary release on 10 December 2025. This includes community boards, wards, constituencies, and subdivisions.
Definitions and metadata
Subnational population estimates - DataInfo+ gives the general methodology used to produce subnational population estimates statistics.
Technical enquiries
Molly Jenkins
[email protected]
04 931 4600
ISSN 1178-0673
Next release
National population estimates: At 30 September 2025 will be released on 17 November 2025.


