Observed Oceanic Drivers for the Previous Season
During the April-June 2026 (AMJ 2026) season, the equatorial tropical Pacific shifted into El Niño conditions, recording a seasonal mean Niño 3.4 index value of 1.0°C. Within the AMJ season, the monthly Niño 3.4 index exhibited a rapid warming trajectory, rising sharply from 0.5°C in April to 1.6°C in June (Table 1).
Across other ocean basins, the Indian Ocean Dipole (IOD) remained in a neutral phase. In the tropical Atlantic, sea surface temperature (SST) anomalies in the North Tropical Atlantic (NTA) were near zero, whereas the South Tropical Atlantic (STA) remained slightly above average. Concurrently, widespread positive SST anomalies continued to dominate across the North Pacific.1
Outlook for Oceanic Drivers for the Next Season
For the August-October 2026 (ASO 2026) season, the multi-model ensemble (MME) indicates a rapid development toward strong El Niño conditions. The seasonal average SST anomaly is forecast to reach approximately 2.9°C during ASO 2026, with the intensification trajectory peaking in November. The spread among individual forecast systems remains narrow, reflecting high forecast confidence.
In the Indian Ocean, a positive IOD phase is also expected to develop, reaching an ASO 2026 seasonal mean value of 0.6°C. Meanwhile, the equatorial Atlantic basin is forecast to remain generally warm, with SSTs in both the North and South Tropical Atlantic remaining above normal.
Surface Temperature Outlook for the Next Season
For the ASO 2026 season, multi-model ensemble forecasts project a nearly universal global dominance for enhancement in probabilities for above-normal temperatures over landmasses. This warming trend is especially pronounced north of 60°S, where a large increase in probabilities for above-normal temperature is reinforced by high model consistency.
In the northern hemisphere, a large increase in probabilities for above-normal temperatures covers Africa, southern Europe, the Arabian Peninsula, the Indian Subcontinent, eastern Asia, western parts of North America below 60°N, Central America, and the Caribbean. Model consistency across these regions is moderate to strong. Conversely, a weaker enhancement in probabilities of above-normal temperatures is indicated over parts of northern Asia, as well as northwestern and eastern regions of North America.
In the southern hemisphere, a strong enhancement in probabilities for above-normal temperatures is centered over southern Africa, between the equator and 30°S over South America, and across New Zealand, supported by strong model consistency. Over Australia, a moderate increase in the probability for above-normal temperature is forecast across southern and central parts of the continent, with a noticeably weaker signal present over far northern regions.
In the tropics, a large increase in probabilities for above-normal temperatures covers equatorial Africa, South America, and the northern part of the Maritime Continent. Over the ocean basins, forecasts reflect a footprint of the rapidly intensifying El Niño event. Extreme probabilities (exceeding 80%) for above-normal SSTs dominate the equatorial Pacific east of the Date Line, where the core of the warm region displays maximum model consistency.
A widespread tendency for above-normal temperatures also covers the Indian Ocean and the tropical Atlantic. In contrast, a region of below- to near-normal temperature probabilities is predicted across the North Atlantic. Additionally, a zone of enhanced probabilities for below-normal temperatures is centered in the South Pacific subtropical region (between 10°S and 30°S), supported by strong model consistency.
Rainfall Outlook for the Next Season
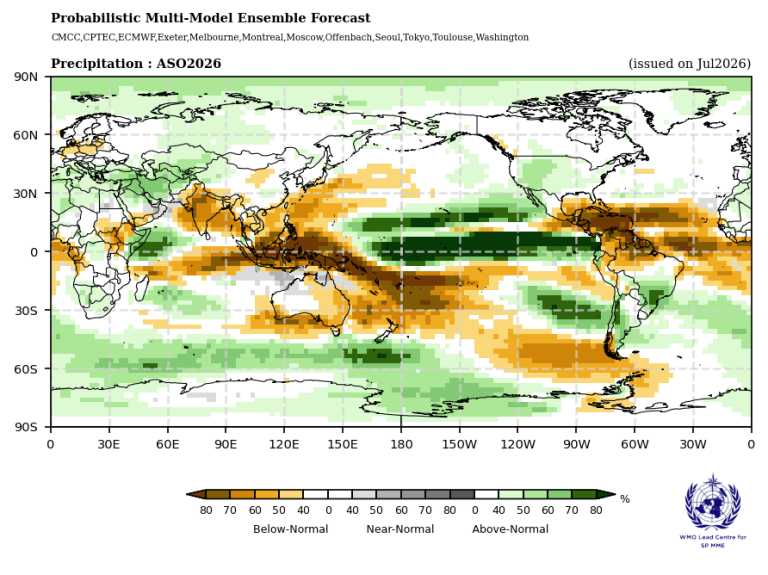
For the ASO 2026 season, MME forecasts project well-structured, large tilts in rainfall probabilities, exhibiting a classic, strong atmospheric response to Pacific El Niño. The most dominant feature of the ASO 2026 outlook is a strong enhancement in the probability for above-normal rainfall stretching across the central and eastern equatorial Pacific east of the Date Line, backed by strong model consistency. The core for this rainfall signal is flanked by an extensive region of below-normal rainfall probabilities. This broad dry signal encompasses widespread marine zones, manifesting as strong enhancements in the probability for below-normal rainfall over both the tropical Indian Ocean and the equatorial Atlantic Ocean, as well as a horseshoe pattern extending into the Northern and Southern Hemispheres starting at around 120°E.
The Indian Subcontinent features an enhancement in the probability for below-normal rainfall, exhibiting high model consistency across the region. To its northwest, there is an enhancement in probabilities for above-normal rainfall extending into parts of Central Asia and northern regions of the Arabian Peninsula. Across equatorial Africa, the Greater Horn of Africa shows an enhanced probability for above-normal rainfall, with an enhancement in probability for below-normal rainfall to its west. Flanking this equatorial belt, a weak enhancement in the probability for above-normal rainfall is indicated over both the far northern and southern parts of Africa. Over Australia, an enhancement in the probability for below-normal rainfall dominates over the southern and eastern regions, with strong model consistency.
Over North America, there is an enhancement in the probability for below-normal rainfall covering the southern parts of Central America and the Caribbean, supported by high model consistency. To its north, there is an enhancement in the probability for above-normal rainfall over the western parts of North America below 45°N. In South America, a robust enhancement in probability for below-normal rainfall is centered over the northwest, continuing steadily along the northern coastal areas to the east. Farther south, a branch of enhanced probability for above-normal rainfall extends across southeastern South America.
Across Europe, the MME forecasts reveal a notable latitudinal split. An enhancement in the probability for above-normal rainfall covers the southern parts of Europe, whereas an enhanced probability for below-normal rainfall is predicted across northern Europe. The consistency is low to moderate.
1 https://www.cpc.ncep.noaa.gov/products/attribution/images/Attribution202606.pdf