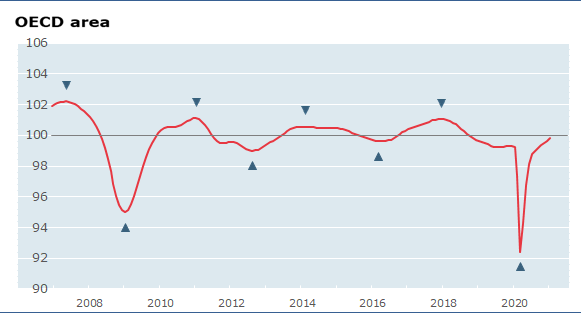
Composite leading indicators (CLIs) are designed to anticipate turning points in economic activity relative to trend six to nine months ahead. However, in the current circumstances, the CLIs should continue to be interpreted with care as fluctuations in the underlying components are likely influenced by the evolving measures to contain Covid-19 and the progress of vaccination campaigns.
As always, the magnitude of the CLI variation (decline/increase) should not be regarded as a measure of the degree of contraction/expansion in economic activity, but rather as an indication of the strength of the signal (see the note "Interpreting OECD Composite Leading Indicators").
|
Visit the interactive OECD Data Portal to explore this data further. The above graph show country specific composite leading indicators (CLIs solid line, left axis and the relative month-on-month growth rate, right axis). Turning points of CLIs tend to precede turning points in economic activity relative to trend by six to nine months. The horizontal line at 100 represents the trend of economic activity. Shaded triangles mark confirmed turning-points of the CLI. Blank triangles mark provisional turning-points that may be reversed |
> Access data:
- Composite Leading Indicators database
- Tables and graphs (PDF) of CLI and reference series for 33 OECD member countries and 6 major non-member economies.
Watch our video explaining howthe Composite Leading Indicators are compiled Please note that in the video "business cycle" should be understood as the growth cycle (deviation to trend), and that the term "recession" should be understood as an economic slowdown rather than a recession. |
|
Do you need help with our data? Please consult:
- FAQs
- Methodological information
- Glossary for Composite Leading Indicators and Business Tendency Surveys
- OECD Business Cycle Analysis Database


