Ever joined a volunteer group in your city, a rally to protest against a big polluter or a forest cleanup day? You might have noticed that each initiative brings in a huge amount of "behind the scenes" work, with many people helping out to make sure everything runs smoothly.
At Greenpeace, we call this "mobilisation", and everyday staff and volunteers give it all for this job, with the passion and enthusiasm that makes the climate justice movement so popular and unique. Along with banners, megaphones, polar bears' peluches and flags, we use a wide range of technologies to engage with people, from social media to custom-built platforms.

Hoping that it inspires other non-profits willing to embrace data, here's the story of how one of these platforms empowers the movement and how we, the "mobilisers", can use its data to continuously improve it.
Technology for the movement
Today, 10 Greenpeace National / Regional Organisations (NROs) use a customised version of Open Social to mobilise, engage and empower more than 50,000 volunteers across 17 countries. Conceptualised by our Dutch colleagues and built by our long-lasting partner, these websites exist outside of the "big-technologies", providing a safe, ads-free space for anyone to connect and interact without worrying about their data being used – or sold – for marketing purposes.
By connecting local groups and community leaders with each other and by allowing everyone to find users with the same interests and self-organise in chats, groups or events, Greenpeace staff and volunteers use these platforms to help people translate their online actions into real change for the planet.
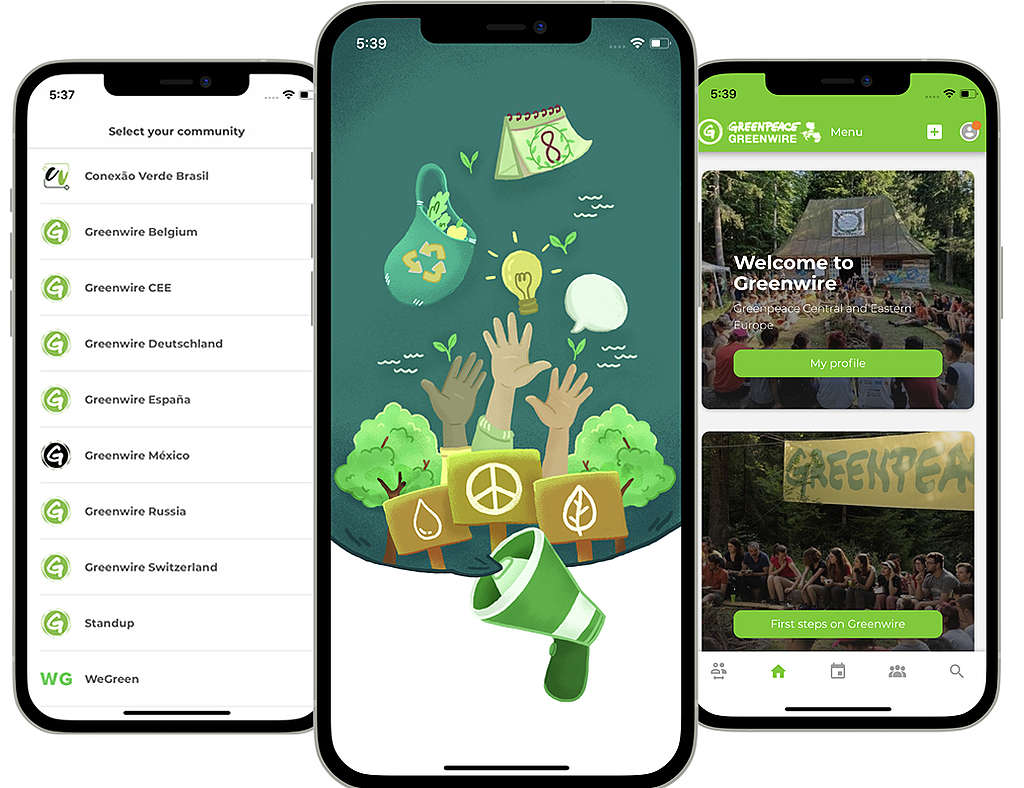
To further expand the scope of this tech, the GreenAct mobile application (coming soon!) will allow access to all these communities from one place, virtually connecting thousands of people willing to change the world. This is just one step of our technology vision, which aims to make great innovations easy to access, adopt and embrace by the whole movement.
Technologies, though, do not develop by themselves. Along with tech superheroes who work on the code, we need data to assess whether a feature is solving a problem for the users or not, if some content is trending or if one or more groups require support for offline activities. To better serve everyone with an account in a website of the Greenpeace Network, the International team has been working to extract and visualise advanced analytics, creating this publicly-available dashboard.
This straightforward way of visualising data now allows us to deeply understand who users are and what they create, consume, search and share on our Open Social instances. The use of data will make the difference in how we empower our communities, allowing mobilisers to improve journeys (e.g. profile creation) or promote content and events based on the most popular topics users search for.
This whole piece of work can also be used by other non-profit organisations willing to embrace data. We fully believe in open source and resource sharing for the greater good, and try to apply it to our tools (e.g. Planet 4, which powers this same website!) so feel free to get inspired and let us know what you think!
The problem: what do people do on our volunteer / activism websites?
Back in 2018, the community of practitioners delivered a list of requirements to the vendor and to the Greenpeace International Insights team. In a nutshell, admins wanted to track data related to the content of the sites (type, title, language), the type of users (signed In, account type, location) and the actions they performed (login, signups, group and event activities, creation of content, etc).
| Content information | Events data |
| – Website Language – Platform (Open Social) – Cookie StatusPage type: (Event, Group, Topic) – Page title: (Event name, Group name, Topic name) – Signed In: (true, false) – Visitor type: (GP staff, Volunteer) – Location: (location of event or group) – Country: (from user information) |
– Cookies Acceptance – Log In & Out – First signup & Complete signup – Group subscriptions – Event enrollment – Content creation – File downloads – Follow/Likes/Shares /Comments – Search |
The Solution: a technology to extract data
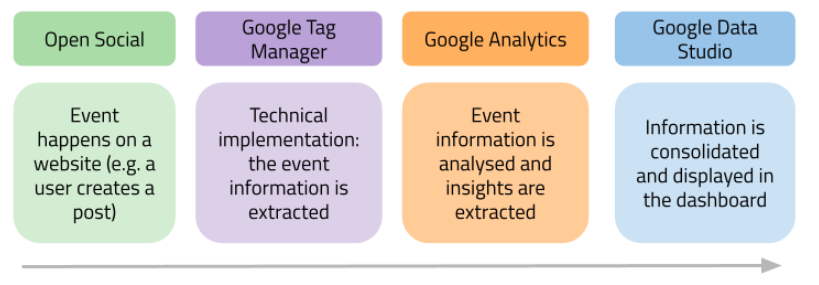
Following the recommendation of Open Social (the vendor), the community agreed to co-sponsor a "Webhook-based" technology, which would instantly generate all this information. Once the tech was made available, our team had to take care of the Google Tag Manager setup, to make sure all data are identified, captured, analysed and sent to Google Analytics, the Dashboard main source.
The Outcome: a Dashboard and some inspiration for everyone
With Greenpeace Brazil piloting this solution on conexaoverde.greenpeace.org.br, we can now finally see the tangible outcomes of this complex piece of work before rolling it out to all the other sites.
This is only the first version of the Dashboard, to make it useful to (and usable by) everyone we are now gathering feedback on what kind of data are missing and how they can be better displayed. Once the dashboard is iterated, it will be implemented across all websites.
As mentioned, everyone in the non-profit world can use all this! We fully support open source and resource sharing for the greater good, so feel free to get inspired, replicate or improve and let us know what you think!
Luca Tiralongo is a Community Manager for Greenpeace International based in Milan, Italy.


