
5 August 2026: We have corrected the values for the December 2025 quarter and March 2026 quarter releases for the following series:
- Household Labour Force Survey (HLFS): 'Persons employed by reason working fewer hours (main job) or absent (all jobs) - HLFQ.SVE'.
- Labour cost index (LCI): 'Public sector, All industries combined, All salary and wage rates - LCIQ.SG33Z9'.
We apologise for the inconvenience. The revised data is included in this release.
Labour market statistics provide a picture of the New Zealand labour market, including unemployment and employment rates, demand for labour, and changes in wages and salaries.
- Table 4 has key labour market measures by age group.
- Table 5 has key labour market measures by ethnic group.
- Table 6 has key labour market measures by regional council area.
- Table 7 has key labour market measures by disability status.
Key facts
In the June 2026 quarter, compared with the March 2026 quarter, the:
- unemployment rate was 5.6 percent, compared with 5.4 percent
- underutilisation rate was 13.8 percent, up from 12.9 percent
- employment rate was unchanged at 66.7 percent.
In the year ended June 2026:
- all salary and wage rates (including overtime) increased 2.0 percent
- average weekly earnings (including overtime) for full-time equivalent employees (FTEs) increased to $1,730 from $1,679
- average ordinary time hourly earnings increased to $44.62 from $43.39.
Labour market measures |
June 2026 quarter |
Quarterly change |
Annual change |
|
Employment at a glance (seasonally adjusted, HLFS) |
Percent |
Percentage points |
||
Unemployment rate |
5.6 |
0.2 |
0.4 |
|
Underutilisation rate |
13.8 |
0.8 |
1.0 |
|
Employment rate |
66.7 |
0.1 |
-0.1 |
|
Labour force participation rate |
70.7 |
0.2 |
0.2 |
|
(000) |
Percent |
|||
Unemployed |
171 |
4.6 |
8.6 |
|
Underutilised |
440 |
7.7 |
9.5 |
|
Employed |
2,905 |
0.5 |
1.2 |
|
Working-age population |
4,353 |
0.4 |
1.3 |
|
Wages at a glance (not seasonally adjusted) |
Index |
Percent |
||
Wage inflation (salary and wage rates, including overtime, LCI) |
All sectors |
1459 |
0.6 |
2.0 |
Private sector |
1458 |
0.7 |
2.0 |
|
Public sector |
1474 |
0.4 |
1.7 |
|
LCI analytical unadjusted |
1806 |
0.9 |
3.1 |
|
Dollars |
Percent |
|||
Average ordinary time hourly earnings (QES) |
44.62 |
1.1 |
2.8 |
|
Hours at a glance (seasonally adjusted) |
Hours |
Percent |
||
Average weekly paid hours for FTEs (QES) |
Ordinary time |
38.12 |
-0.1 |
0.1 |
Total |
38.71 |
-0.1 |
0.2 |
|
Hours (millions) |
Percent |
|||
Total weekly paid hours (QES) |
74.2 |
-0.3 |
0.6 |
|
Total actual weekly hours worked (HLFS) |
96.8 |
-0.1 |
2.8 |
|
Note: LCI - labour cost index QES - Quarterly Employment Survey HLFS - Household Labour Force Survey FTEs - full-time equivalent employees Due to rounding, changes do not always sum to the published totals. |
||||
Unemployment
The seasonally adjusted unemployment rate was 5.6 percent in the June 2026 quarter, compared with 5.4 percent in the March 2026 quarter (revised).
- For men, the unemployment rate was 5.7 percent, compared with 5.4 percent last quarter.
- For women, the unemployment rate was 5.5 percent, compared with 5.3 percent last quarter.
| Quarter | Men | Women | Total |
| Jun-12 | 6.2 | 6.7 | 6.4 |
| Sept-12 | 6.6 | 6.9 | 6.7 |
| Dec-12 | 6 | 6.7 | 6.3 |
| Mar-13 | 5.2 | 6.5 | 5.8 |
| Jun-13 | 5.5 | 6.5 | 6 |
| Sept-13 | 5.5 | 6.2 | 5.8 |
| Dec-13 | 5 | 6.4 | 5.7 |
| Mar-14 | 5.1 | 6.1 | 5.6 |
| Jun-14 | 4.6 | 6 | 5.3 |
| Sept-14 | 4.6 | 6.1 | 5.3 |
| Dec-14 | 4.8 | 6.3 | 5.5 |
| Mar-15 | 5.2 | 5.9 | 5.5 |
| Jun-15 | 4.8 | 6.3 | 5.5 |
| Sept-15 | 5.2 | 6.1 | 5.7 |
| Dec-15 | 4.7 | 5.3 | 5 |
| Mar-16 | 5 | 5.6 | 5.3 |
| Jun-16 | 4.7 | 5.5 | 5.1 |
| Sept-16 | 4.7 | 5.3 | 5 |
| Dec-16 | 4.8 | 5.8 | 5.3 |
| Mar-17 | 4.3 | 5.6 | 4.9 |
| Jun-17 | 4.8 | 5 | 4.9 |
| Sept-17 | 4.1 | 5.4 | 4.7 |
| Dec-17 | 4 | 5 | 4.5 |
| Mar-18 | 3.9 | 4.8 | 4.4 |
| Jun-18 | 4.4 | 4.9 | 4.6 |
| Sept-18 | 4 | 4 | 4 |
| Dec-18 | 4.4 | 4.2 | 4.3 |
| Mar-19 | 3.8 | 4.5 | 4.2 |
| Jun-19 | 3.7 | 4.4 | 4.1 |
| Sept-19 | 3.8 | 4.4 | 4.1 |
| Dec-19 | 3.9 | 4.3 | 4.1 |
| Mar-20 | 4 | 4.4 | 4.2 |
| Jun-20 | 3.6 | 4.6 | 4.1 |
| Sept-20 | 4.8 | 5.6 | 5.2 |
| Dec-20 | 4.5 | 5.4 | 4.9 |
| Mar-21 | 4.6 | 4.7 | 4.6 |
| Jun-21 | 3.8 | 4.2 | 4 |
| Sept-21 | 3.3 | 3.3 | 3.3 |
| Dec-21 | 3.1 | 3.4 | 3.2 |
| Mar-22 | 3.2 | 3.4 | 3.3 |
| Jun-22 | 3.1 | 3.6 | 3.3 |
| Sept-22 | 2.9 | 3.7 | 3.3 |
| Dec-22 | 3.3 | 3.5 | 3.4 |
| Mar-23 | 3.3 | 3.7 | 3.5 |
| Jun-23 | 3.4 | 3.9 | 3.7 |
| Sept-23 | 3.7 | 4.2 | 3.9 |
| Dec-23 | 3.8 | 4.3 | 4 |
| Mar-24 | 4.1 | 4.8 | 4.4 |
| Jun-24 | 4.6 | 4.7 | 4.7 |
| Sept-24 | 4.7 | 5.1 | 4.9 |
| Dec-24 | 5 | 5.3 | 5.1 |
| Mar-25 | 4.9 | 5.4 | 5.2 |
| Jun-25 | 5 | 5.5 | 5.2 |
| Sept-25 | 5.2 | 5.4 | 5.3 |
| Dec-25 | 5.3 | 5.5 | 5.4 |
| Mar-26 | 5.4 | 5.3 | 5.4 |
| Jun-26 | 5.7 | 5.5 | 5.6 |
The seasonally adjusted number of unemployed people was 171,000, compared with 164,000 in the March 2026 quarter.
The following data is not seasonally adjusted.
In the June 2026 quarter, the unemployment rate was:
- 11.6 percent for Pacific peoples
- 10.8 percent for Māori
- 5.0 percent for Asians
- 4.2 percent for Europeans.
There was a 19.5 percent increase in the number of unemployed people aged 15 to 24 years, up 12,200 in the year to June 2026.
Unemployment in the North Island increased to 6.0 percent, from 5.3 percent a year earlier. In the South Island, the unemployment rate was 3.7 percent in the June 2026 quarter.
| Quarter | North Island | South Island | Total |
| Jun-12 | 6.6 | 5.2 | 6.2 |
| Sept-12 | 7.3 | 4.7 | 6.7 |
| Dec-12 | 6.9 | 4.5 | 6.3 |
| Mar-13 | 6.8 | 4.1 | 6.1 |
| Jun-13 | 6.4 | 4.4 | 5.9 |
| Sept-13 | 6.3 | 4.2 | 5.8 |
| Dec-13 | 6.2 | 3.7 | 5.6 |
| Mar-14 | 6.6 | 3.8 | 5.9 |
| Jun-14 | 5.9 | 3 | 5.1 |
| Sept-14 | 5.9 | 3.2 | 5.2 |
| Dec-14 | 6 | 3.9 | 5.5 |
| Mar-15 | 6.6 | 3.2 | 5.8 |
| Jun-15 | 6 | 3.6 | 5.4 |
| Sept-15 | 6 | 4 | 5.5 |
| Dec-15 | 5.3 | 3.7 | 4.9 |
| Mar-16 | 6.2 | 3.6 | 5.5 |
| Jun-16 | 5.2 | 4.1 | 4.9 |
| Sept-16 | 5.2 | 3.8 | 4.9 |
| Dec-16 | 5.6 | 3.9 | 5.2 |
| Mar-17 | 5.6 | 3.9 | 5.2 |
| Jun-17 | 4.9 | 4 | 4.7 |
| Sept-17 | 4.9 | 3.6 | 4.6 |
| Dec-17 | 4.6 | 4 | 4.4 |
| Mar-18 | 4.9 | 3.7 | 4.6 |
| Jun-18 | 4.6 | 3.9 | 4.4 |
| Sept-18 | 3.9 | 3.7 | 3.9 |
| Dec-18 | 4.5 | 3.9 | 4.4 |
| Mar-19 | 4.7 | 3.7 | 4.4 |
| Jun-19 | 4.1 | 3.3 | 3.9 |
| Sept-19 | 4.2 | 3.6 | 4 |
| Dec-19 | 4.2 | 3.8 | 4.1 |
| Mar-20 | 4.8 | 3.6 | 4.5 |
| Jun-20 | 4 | 3.7 | 3.9 |
| Sept-20 | 5.3 | 4.4 | 5.1 |
| Dec-20 | 5.2 | 3.9 | 4.9 |
| Mar-21 | 5.1 | 4.2 | 4.9 |
| Jun-21 | 4 | 3.6 | 3.9 |
| Sept-21 | 3.2 | 3.3 | 3.2 |
| Dec-21 | 3.2 | 3.1 | 3.2 |
| Mar-22 | 3.5 | 3.2 | 3.5 |
| Jun-22 | 3.3 | 3.1 | 3.2 |
| Sept-22 | 3.4 | 2.8 | 3.2 |
| Dec-22 | 3.4 | 3.1 | 3.4 |
| Mar-23 | 3.8 | 3.2 | 3.7 |
| Jun-23 | 3.7 | 3 | 3.5 |
| Sept-23 | 4.1 | 3.3 | 3.9 |
| Dec-23 | 4.2 | 3.3 | 4 |
| Mar-24 | 4.8 | 4.3 | 4.7 |
| Jun-24 | 4.8 | 3.8 | 4.5 |
| Sept-24 | 4.9 | 4.4 | 4.8 |
| Dec-24 | 5.3 | 4.2 | 5 |
| Mar-25 | 5.9 | 4.2 | 5.5 |
| Jun-25 | 5.3 | 4.3 | 5.1 |
| Sept-25 | 5.6 | 4 | 5.2 |
| Dec-25 | 5.9 | 3.6 | 5.3 |
| Mar-26 | 6.1 | 4.3 | 5.7 |
| Jun-26 | 6 | 3.7 | 5.4 |
Underutilisation
The seasonally adjusted underutilisation rate was 13.8 percent in the June 2026 quarter, up from 12.9 percent in the March 2026 quarter.
- For men, the underutilisation rate was 12.4 percent, up from 11.6 percent last quarter.
- For women, the underutilisation rate was 15.3 percent, up from 14.4 percent last quarter.
| Quarter | Men | Women | Total |
| Jun-12 | 11.9 | 17.8 | 14.7 |
| Sept-12 | 13.5 | 17.7 | 15.6 |
| Dec-12 | 12.4 | 17.3 | 14.7 |
| Mar-13 | 10.4 | 15.9 | 13 |
| Jun-13 | 10.6 | 16.2 | 13.3 |
| Sept-13 | 11.1 | 17.3 | 14.1 |
| Dec-13 | 11.1 | 17.1 | 14 |
| Mar-14 | 10.9 | 15.8 | 13.2 |
| Jun-14 | 10.5 | 16.4 | 13.3 |
| Sept-14 | 10.2 | 15.6 | 12.8 |
| Dec-14 | 10.5 | 16.4 | 13.3 |
| Mar-15 | 10.8 | 16.6 | 13.6 |
| Jun-15 | 10.6 | 16.9 | 13.6 |
| Sept-15 | 11.2 | 16.5 | 13.7 |
| Dec-15 | 10.1 | 15 | 12.5 |
| Mar-16 | 11.2 | 16.3 | 13.7 |
| Jun-16 | 10.5 | 15.9 | 13.1 |
| Sept-16 | 10 | 15.6 | 12.7 |
| Dec-16 | 9.7 | 15.4 | 12.4 |
| Mar-17 | 9.3 | 15.5 | 12.3 |
| Jun-17 | 9.5 | 14.7 | 12 |
| Sept-17 | 9.3 | 15.2 | 12.1 |
| Dec-17 | 9.4 | 15.3 | 12.2 |
| Mar-18 | 9.5 | 14.6 | 11.9 |
| Jun-18 | 9.9 | 14.5 | 12.1 |
| Sept-18 | 9.3 | 13.6 | 11.3 |
| Dec-18 | 10 | 14.6 | 12.2 |
| Mar-19 | 9 | 13.9 | 11.3 |
| Jun-19 | 9.2 | 13.2 | 11.1 |
| Sept-19 | 8.4 | 12.5 | 10.3 |
| Dec-19 | 8.4 | 12 | 10.1 |
| Mar-20 | 8.3 | 12.8 | 10.4 |
| Jun-20 | 9.4 | 15 | 12.1 |
| Sept-20 | 10.6 | 15.9 | 13.1 |
| Dec-20 | 9.7 | 14.4 | 11.9 |
| Mar-21 | 9.9 | 14.6 | 12.2 |
| Jun-21 | 8.3 | 13 | 10.5 |
| Sept-21 | 7.7 | 10.8 | 9.2 |
| Dec-21 | 7.4 | 11.2 | 9.3 |
| Mar-22 | 7.8 | 11.2 | 9.4 |
| Jun-22 | 7.5 | 11.2 | 9.3 |
| Sept-22 | 7.3 | 10.9 | 9 |
| Dec-22 | 7.6 | 11.5 | 9.4 |
| Mar-23 | 7.5 | 10.9 | 9.1 |
| Jun-23 | 8.2 | 11.9 | 10 |
| Sept-23 | 8.7 | 12.4 | 10.5 |
| Dec-23 | 8.7 | 13.1 | 10.8 |
| Mar-24 | 9.4 | 13.4 | 11.3 |
| Jun-24 | 10 | 13.8 | 11.9 |
| Sept-24 | 10.3 | 13.2 | 11.7 |
| Dec-24 | 10.7 | 13.9 | 12.2 |
| Mar-25 | 10.5 | 14.5 | 12.4 |
| Jun-25 | 11 | 14.7 | 12.8 |
| Sept-25 | 11.2 | 14.9 | 12.9 |
| Dec-25 | 11.1 | 14.9 | 12.9 |
| Mar-26 | 11.6 | 14.4 | 12.9 |
| Jun-26 | 12.4 | 15.3 | 13.8 |
The number of underutilised people was 440,000, compared with 408,000 last quarter. The total for this quarter consisted of 234,000 women and 206,000 men.
Underutilisation is a broad measure of spare capacity in the labour market and is just as important as the unemployment rate, as it gives us a more detailed picture of the workforce.
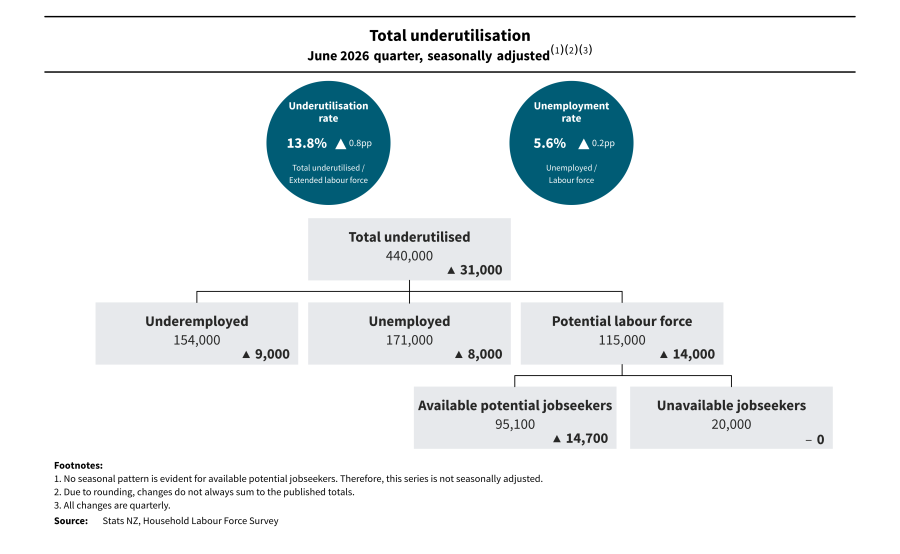
Text alternative for diagram Total underutilisation, June 2026 quarter, seasonally adjusted.
The following data is not seasonally adjusted.
In the June 2026 quarter, the underutilisation rate was:
- 22.8 percent for Māori
- 22.1 percent for Pacific peoples
- 12.5 percent for Asians
- 11.8 percent for Europeans.
The underutilisation rate for Māori increased to 22.8 percent, from 19.5 percent a year earlier.
In the June 2026 quarter, compared with the June 2025 quarter, there were:
- 180,200 underutilised people aged 15 to 24, up from 158,600 a year earlier
- 75,500 underutilised people aged 25 to 34, up from 63,600 a year earlier.
Underutilisation in the North Island increased to 13.9 percent in the June 2026 quarter, from 12.5 percent a year earlier. In the South Island, the underutilisation rate was 11.9 percent.
Employment
The seasonally adjusted employment rate was 66.7 percent in the June 2026 quarter, unchanged from the March 2026 quarter.
- For men, the employment rate was 70.5 percent, compared with 70.4 percent last quarter.
- For women, the employment rate was unchanged at 63.1 percent.
| Quarter | Men | Women | Total |
| Jun-12 | 69.2 | 58.4 | 63.6 |
| Sept-12 | 68.7 | 58.3 | 63.3 |
| Dec-12 | 68.7 | 58.1 | 63.3 |
| Mar-13 | 68.9 | 58.1 | 63.3 |
| Jun-13 | 69.1 | 58.1 | 63.4 |
| Sept-13 | 69.9 | 58.8 | 64.1 |
| Dec-13 | 70.4 | 58.8 | 64.4 |
| Mar-14 | 70.6 | 59.3 | 64.8 |
| Jun-14 | 70.8 | 58.9 | 64.7 |
| Sept-14 | 70.6 | 59.6 | 64.9 |
| Dec-14 | 71 | 60.2 | 65.5 |
| Mar-15 | 71.2 | 60.2 | 65.5 |
| Jun-15 | 71.1 | 59.7 | 65.3 |
| Sept-15 | 70.1 | 59.2 | 64.5 |
| Dec-15 | 70.5 | 59.6 | 64.9 |
| Mar-16 | 70.7 | 60.2 | 65.3 |
| Jun-16 | 71.9 | 61.2 | 66.5 |
| Sept-16 | 72.4 | 61.1 | 66.6 |
| Dec-16 | 72.5 | 61.7 | 67 |
| Mar-17 | 73.2 | 61.8 | 67.4 |
| Jun-17 | 72.7 | 61.5 | 67 |
| Sept-17 | 73.5 | 62.4 | 67.8 |
| Dec-17 | 73.5 | 62.6 | 68 |
| Mar-18 | 73.4 | 62.8 | 68 |
| Jun-18 | 73.2 | 62.9 | 67.9 |
| Sept-18 | 73.2 | 63.4 | 68.2 |
| Dec-18 | 72.7 | 63.2 | 67.8 |
| Mar-19 | 72.5 | 62.9 | 67.6 |
| Jun-19 | 72.6 | 63.1 | 67.8 |
| Sept-19 | 72.6 | 63 | 67.7 |
| Dec-19 | 72.5 | 62.6 | 67.5 |
| Mar-20 | 72.8 | 62.8 | 67.7 |
| Jun-20 | 72.4 | 62.1 | 67.2 |
| Sept-20 | 71.8 | 61.2 | 66.4 |
| Dec-20 | 72 | 61.6 | 66.7 |
| Mar-21 | 72.1 | 62.3 | 67.2 |
| Jun-21 | 72.7 | 62.9 | 67.8 |
| Sept-21 | 73.1 | 64.6 | 68.8 |
| Dec-21 | 73.2 | 64.4 | 68.7 |
| Mar-22 | 73.3 | 64.2 | 68.6 |
| Jun-22 | 73 | 64.2 | 68.5 |
| Sept-22 | 73.8 | 65 | 69.3 |
| Dec-22 | 74 | 64.8 | 69.4 |
| Mar-23 | 74.1 | 65.3 | 69.6 |
| Jun-23 | 74.3 | 65.3 | 69.7 |
| Sept-23 | 73.9 | 64.5 | 69.2 |
| Dec-23 | 73.6 | 64.4 | 68.9 |
| Mar-24 | 72.7 | 64 | 68.3 |
| Jun-24 | 72.5 | 64.1 | 68.3 |
| Sept-24 | 71.7 | 63.6 | 67.6 |
| Dec-24 | 71.4 | 63.2 | 67.2 |
| Mar-25 | 71.3 | 62.9 | 67.1 |
| Jun-25 | 70.9 | 62.8 | 66.8 |
| Sept-25 | 70.6 | 62.7 | 66.6 |
| Dec-25 | 70.4 | 63.2 | 66.7 |
| Mar-26 | 70.4 | 63.1 | 66.7 |
| Jun-26 | 70.5 | 63.1 | 66.7 |
In the June 2026 quarter, the seasonally adjusted number of employed people was 2,905,000, compared with 2,892,000 in the March 2026 quarter.
Labour force participation
The seasonally adjusted labour force participation rate was 70.7 percent in the June 2026 quarter, compared with 70.4 percent in the March 2026 quarter.
- For men, the labour force participation rate was 74.7 percent, compared with 74.4 percent last quarter.
- For women, the labour force participation rate was 66.7 percent, compared with 66.6 percent last quarter.
| Quarter | Men | Women | Total |
| Jun-12 | 73.7 | 62.6 | 68 |
| Sept-12 | 73.5 | 62.6 | 67.9 |
| Dec-12 | 73.1 | 62.3 | 67.5 |
| Mar-13 | 72.6 | 62.1 | 67.2 |
| Jun-13 | 73.1 | 62.2 | 67.5 |
| Sept-13 | 73.9 | 62.7 | 68.1 |
| Dec-13 | 74.1 | 62.8 | 68.3 |
| Mar-14 | 74.4 | 63.2 | 68.6 |
| Jun-14 | 74.3 | 62.7 | 68.3 |
| Sept-14 | 74 | 63.4 | 68.6 |
| Dec-14 | 74.7 | 64.2 | 69.3 |
| Mar-15 | 75.1 | 63.9 | 69.4 |
| Jun-15 | 74.7 | 63.7 | 69.1 |
| Sept-15 | 74 | 63 | 68.4 |
| Dec-15 | 74 | 63 | 68.3 |
| Mar-16 | 74.5 | 63.7 | 69 |
| Jun-16 | 75.5 | 64.8 | 70 |
| Sept-16 | 76 | 64.5 | 70.1 |
| Dec-16 | 76.2 | 65.4 | 70.7 |
| Mar-17 | 76.5 | 65.5 | 70.9 |
| Jun-17 | 76.3 | 64.7 | 70.4 |
| Sept-17 | 76.6 | 65.9 | 71.2 |
| Dec-17 | 76.6 | 66 | 71.2 |
| Mar-18 | 76.4 | 66 | 71.1 |
| Jun-18 | 76.5 | 66.1 | 71.2 |
| Sept-18 | 76.3 | 66 | 71.1 |
| Dec-18 | 76 | 65.9 | 70.9 |
| Mar-19 | 75.4 | 65.8 | 70.6 |
| Jun-19 | 75.4 | 66 | 70.6 |
| Sept-19 | 75.5 | 65.9 | 70.6 |
| Dec-19 | 75.4 | 65.5 | 70.4 |
| Mar-20 | 75.9 | 65.7 | 70.7 |
| Jun-20 | 75.1 | 65 | 70 |
| Sept-20 | 75.4 | 64.9 | 70.1 |
| Dec-20 | 75.4 | 65.1 | 70.2 |
| Mar-21 | 75.6 | 65.4 | 70.4 |
| Jun-21 | 75.6 | 65.7 | 70.6 |
| Sept-21 | 75.6 | 66.7 | 71.1 |
| Dec-21 | 75.5 | 66.6 | 71 |
| Mar-22 | 75.7 | 66.4 | 71 |
| Jun-22 | 75.3 | 66.6 | 70.9 |
| Sept-22 | 76 | 67.5 | 71.7 |
| Dec-22 | 76.5 | 67.2 | 71.8 |
| Mar-23 | 76.6 | 67.8 | 72.1 |
| Jun-23 | 76.9 | 68 | 72.4 |
| Sept-23 | 76.7 | 67.4 | 72 |
| Dec-23 | 76.5 | 67.3 | 71.8 |
| Mar-24 | 75.8 | 67.2 | 71.5 |
| Jun-24 | 75.9 | 67.3 | 71.6 |
| Sept-24 | 75.3 | 67 | 71.1 |
| Dec-24 | 75.1 | 66.7 | 70.8 |
| Mar-25 | 75 | 66.5 | 70.7 |
| Jun-25 | 74.6 | 66.4 | 70.5 |
| Sept-25 | 74.5 | 66.2 | 70.3 |
| Dec-25 | 74.3 | 66.9 | 70.5 |
| Mar-26 | 74.4 | 66.6 | 70.4 |
| Jun-26 | 74.7 | 66.7 | 70.7 |
A total of 1,277,000 people were not in the labour force (NILF) this quarter, compared with 1,283,000 last quarter.
Youth not in employment, education, or training (NEET)
In the June 2026 quarter, the seasonally adjusted proportion of people aged 15 to 24 who were not in employment, education, or training (NEET) was 13.8 percent, compared with 14.4 percent in the March 2026 quarter.
The seasonally adjusted NEET rate was:
- 12.5 percent for males aged 15 to 19, compared with 11.1 percent last quarter
- 15.2 percent for males aged 20 to 24, compared with 16.2 percent last quarter
- 9.7 percent for females aged 15 to 19, compared with 10.9 percent last quarter
- 18.5 percent for females aged 20 to 24, compared with 20.1 percent last quarter.
Disability
The following data is not seasonally adjusted.
In the June 2026 quarter, for people aged 15 to 64, the:
- labour force participation rate for disabled people was 41.7 percent, compared with 83.1 percent for non-disabled people
- employment rate for disabled people was 36.4 percent, compared with 78.4 percent for non-disabled people
- unemployment rate for disabled people was 12.8 percent, compared with 5.7 percent for non-disabled people
- underutilisation rate for disabled people was 30.0 percent, compared with 13.6 percent for non-disabled people.
Between the June 2025 and 2026 quarters, there were no statistically significant changes in the headline rates or levels for disabled people aged 15 to 64. The relatively small number of disabled people in the working-age population means changes over time for this group are rarely statistically significant.
Labour market statistics: June 2026 quarter - CSV, available under 'Download data' above, includes labour market data for disabled people by sex and age. We will continue to include this data in future June-quarter labour market and income releases.
Wages
The labour cost index (LCI) all salary and wage rates (including overtime) increased 2.0 percent in the year ended June 2026, while the unadjusted LCI increased 3.1 percent.
- Private sector wages increased 2.0 percent over the year.
- Public sector wages increased 1.7 percent over the year.
The LCI is often compared with the consumers price index (CPI) to see how wage inflation compares with consumer inflation (the change in prices of goods and services bought by households). Annual CPI inflation was 4.1 percent in the year ended June 2026.
| Quarter | CPI - all groups | LCI - all salary and wage rates |
| Jun-06 | 4 | 3.1 |
| Sept-06 | 3.5 | 3.2 |
| Dec-06 | 2.6 | 3.2 |
| Mar-07 | 2.5 | 3.2 |
| Jun-07 | 2 | 3.3 |
| Sept-07 | 1.8 | 3.1 |
| Dec-07 | 3.2 | 3.3 |
| Mar-08 | 3.4 | 3.4 |
| Jun-08 | 4 | 3.6 |
| Sept-08 | 5.1 | 4 |
| Dec-08 | 3.4 | 3.5 |
| Mar-09 | 3 | 3.3 |
| Jun-09 | 1.9 | 2.8 |
| Sept-09 | 1.7 | 2.1 |
| Dec-09 | 2 | 1.8 |
| Mar-10 | 2 | 1.5 |
| Jun-10 | 1.7 | 1.6 |
| Sept-10 | 1.5 | 1.6 |
| Dec-10 | 4 | 1.7 |
| Mar-11 | 4.5 | 1.9 |
| Jun-11 | 5.3 | 1.9 |
| Sept-11 | 4.6 | 2 |
| Dec-11 | 1.8 | 2 |
| Mar-12 | 1.6 | 2 |
| Jun-12 | 1 | 2 |
| Sept-12 | 0.8 | 1.9 |
| Dec-12 | 0.9 | 1.8 |
| Mar-13 | 0.9 | 1.7 |
| Jun-13 | 0.7 | 1.7 |
| Sept-13 | 1.4 | 1.7 |
| Dec-13 | 1.6 | 1.6 |
| Mar-14 | 1.5 | 1.6 |
| Jun-14 | 1.6 | 1.7 |
| Sept-14 | 1 | 1.6 |
| Dec-14 | 0.8 | 1.8 |
| Mar-15 | 0.3 | 1.7 |
| Jun-15 | 0.4 | 1.6 |
| Sept-15 | 0.4 | 1.6 |
| Dec-15 | 0.1 | 1.5 |
| Mar-16 | 0.4 | 1.6 |
| Jun-16 | 0.4 | 1.5 |
| Sept-16 | 0.4 | 1.6 |
| Dec-16 | 1.3 | 1.6 |
| Mar-17 | 2.2 | 1.6 |
| Jun-17 | 1.7 | 1.7 |
| Sept-17 | 1.9 | 1.9 |
| Dec-17 | 1.6 | 1.8 |
| Mar-18 | 1.1 | 1.8 |
| Jun-18 | 1.5 | 1.9 |
| Sept-18 | 1.9 | 1.8 |
| Dec-18 | 1.9 | 1.9 |
| Mar-19 | 1.5 | 2 |
| Jun-19 | 1.7 | 2.1 |
| Sept-19 | 1.5 | 2.4 |
| Dec-19 | 1.9 | 2.6 |
| Mar-20 | 2.5 | 2.5 |
| Jun-20 | 1.5 | 2.1 |
| Sept-20 | 1.4 | 1.9 |
| Dec-20 | 1.4 | 1.6 |
| Mar-21 | 1.5 | 1.6 |
| Jun-21 | 3.3 | 2.1 |
| Sept-21 | 4.9 | 2.4 |
| Dec-21 | 5.9 | 2.6 |
| Mar-22 | 6.9 | 3 |
| Jun-22 | 7.3 | 3.4 |
| Sept-22 | 7.2 | 3.7 |
| Dec-22 | 7.2 | 4.1 |
| Mar-23 | 6.7 | 4.3 |
| Jun-23 | 6 | 4.3 |
| Sept-23 | 5.6 | 4.3 |
| Dec-23 | 4.7 | 4.3 |
| Mar-24 | 4 | 4.1 |
| Jun-24 | 3.3 | 4.3 |
| Sept-24 | 2.2 | 3.8 |
| Dec-24 | 2.2 | 3.3 |
| Mar-25 | 2.5 | 2.9 |
| Jun-25 | 2.7 | 2.4 |
| Sept-25 | 3 | 2.1 |
| Dec-25 | 3.1 | 2 |
| Mar-26 | 3.1 | 2 |
| Jun-26 | 4.1 | 2 |
In the year ended June 2026, wages as measured by the Quarterly Employment Survey (QES) also grew. Average ordinary time hourly earnings increased to $44.62 (up 2.8 percent).
- Private sector ordinary time hourly earnings increased 3.0 percent, to $42.46.
- Public sector ordinary time hourly earnings increased 2.2 percent, to $52.59.
Average weekly earnings (including overtime) for full-time equivalent employees (FTEs) in the QES also increased over the year - up 3.0 percent to $1,730.
- Private sector average weekly earnings increased 3.1 percent, to $1,642.
- Public sector average weekly earnings increased 2.9 percent, to $2,062.
Data quality
Data series correction for the Household Labour Force Survey
We have discovered and corrected an error in our processing system for data relating to the reasons people worked fewer hours than usual in the reference week in the December 2025 and March 2026 quarters.
Some respondents who worked fewer hours than usual were incorrectly coded to the 'Other reasons' category. These respondents have been reassigned to the appropriate categories and the revised data is included in the June 2026 quarter release.
Infoshare series 'HLFQ.SVE - Persons employed by reason working fewer hours (main job) or absent (all jobs)' has been revised. We have removed this series from the downloadable CSV files in the affected quarters. We recommend instead accessing the most recent data from Infoshare or the June 2026 quarter downloadable CSV files.
Data series correction for Labour cost index
We have discovered and corrected an error for the 'Public sector, All industries combined, All salary and wage rates series - LCIQ.SG33Z9'. This affected the December 2025 and March 2026 quarters. The index numbers for this series have been revised and now match the 'Public Sector, All occupations combined, All Salary and wages rates' index numbers for these quarters. The quarterly and annual percentage changes were not impacted.
We recommend instead accessing the most recent data from Infoshare or the June 2026 quarter downloadable CSV files.
Sample rotation in the Quarterly Employment Survey
In the June 2026 quarter, the QES sample was rotated for the following industries:
- forestry
- electricity, gas, water, and waste services
- rental, hiring, and real estate services.
Due to the rotation, the sampling error for quarterly movements in these industries is higher than in previous quarters. Movements in these industries should be interpreted alongside the accompanying sampling error information.
Labour market statistics: June 2026 quarter - Period-specific information - DataInfo+ has more detail on the impact of sample rotation.
We recommend that customers use the Quarterly Employment Survey primarily for estimates of average hours and earnings. For job measures, customers should instead rely on monthly Employment indicators or Business employment data.
Text alternative for diagram Total underutilisation, June 2026 quarter, seasonally adjusted
The diagram shows data from the June 2026 quarter Household Labour Force Survey.
The underutilisation rate was up 0.8pp (percentage points), to 13.8 percent. This rate is derived from the number of total underutilised divided by the extended labour force. The unemployment rate was up 0.2pp, to 5.6 percent. This is derived from the number of unemployed divided by the labour force.
The number of total underutilised was up 31,000 to 440,000. The number of underemployed was up 9,000 to 154,000, while the number of unemployed was up 8,000 to 171,000. The potential labour force was up 14,000 to 115,000.
Within the potential labour force, available potential jobseekers were up 14,700 to 95,100, and unavailable jobseekers were unchanged at 20,000.
Notes:
- No seasonal pattern is evident for available potential jobseekers. Therefore, this series is not seasonally adjusted.
- Due to rounding, changes do not always sum to the published totals.
- All changes are quarterly.
Source: Stats NZ, Household Labour Force Survey
More data
Use Infoshare to access the labour market time series.
Subject category: Work income and spending
Group: Household labour force survey - HLF
Group: Quarterly employment survey - QEM
Group: Labour cost index - LCI
Definitions and metadata
Labour market statistics: June 2026 quarter - Period-specific information - DataInfo+ includes data-quality notes for the June 2026 quarter, including response and achieved sample rates.
Labour market statistics - DataInfo+ gives general methodology used to produce this release, and related metadata.
Household Labour Force Survey - DataInfo+ gives general methodology used to produce Household Labour Force Survey statistics, and related metadata.
Labour cost index - DataInfo+ gives general methodology used to produce labour cost index statistics, and related metadata.
Quarterly Employment Survey - DataInfo+ gives general methodology used to produce Quarterly Employment Survey statistics, and related metadata.
Infoshare is being replaced by Aotearoa Data Explorer
Infoshare is being replaced by Aotearoa Data Explorer. Stay informed and get support with this change by joining our customer group at [email protected].
Technical enquiries
Labour market statistics team
[email protected]
ISSN 2422-8699
Next releases
Labour market statistics (income): June 2026 quarter will be released on 26 August 2026.
Labour market statistics: September 2026 quarter will be released on 4 November 2026.


