New Zealand's net migration gain of 13,700 in the June 2025 year was down from a net gain of 70,400 in the June 2024 year, according to provisional estimates released by Stats NZ today.
"The main driver of the fall in net migration in the June 2025 year was fewer migrant arrivals of non-New Zealand citizens," international migration statistics spokesperson Bryan Downes said.
"Despite the fall in arrivals, there was still a net migration gain of 60,200 non-New Zealand citizens, which more than offset a net loss of 46,500 New Zealand citizens."
The net migration gain of 60,200 non-New Zealand citizens in the June 2025 year was down from a net gain of 115,800 in the June 2024 year.
The net loss of 46,500 New Zealand citizens in the June 2025 year was similar to the net loss in the June 2024 year, and just below the record loss of 46,800 in the February 2025 year.
Net migration is the difference between the number of migrant arrivals and migrant departures.
Text alternative for diagram International migration estimates (provisional), year ended June 2025
Migrant arrivals of non-New Zealand citizens slow
There were 113,600 migrant arrivals of non-New Zealand citizens in the June 2025 year. This was down from 159,000 in the June 2024 year, and well below the peak of 211,800 in the October 2023 year.
Relative to New Zealand's population, the rate of migrant arrivals of non-New Zealand citizens was 21 people per 1,000 population in the June 2025 year, compared with a peak of 41 people per 1,000 population in the October 2023 year.
| Year | Migrant arrivals (intentions measure) | Migrant departures (intentions measure) | Net migration (intentions measure) | Migrant arrivals (outcomes measure) | Migrant departures (outcomes measure) | Net migration (outcomes measure) |
| 1950 | 9.3 | 3.3 | 6 | |||
| 1951 | 9.1 | 3.4 | 5.7 | |||
| 1952 | 11.4 | 1.9 | 9.5 | |||
| 1953 | 12.2 | 1.5 | 10.7 | |||
| 1954 | 10 | 1.7 | 8.3 | |||
| 1955 | 7.4 | 2.1 | 5.3 | |||
| 1956 | 7.8 | 1.9 | 5.9 | |||
| 1957 | 8.2 | 1.8 | 6.4 | |||
| 1958 | 9.3 | 1.5 | 7.9 | |||
| 1959 | 8.6 | 2.1 | 6.5 | |||
| 1960 | 6.6 | 2.5 | 4 | |||
| 1961 | 6.7 | 2.5 | 4.1 | |||
| 1962 | 10.2 | 2.1 | 8.2 | |||
| 1963 | 9.8 | 2.6 | 7.1 | |||
| 1964 | 10.5 | 2.7 | 7.7 | |||
| 1965 | 10.7 | 3.2 | 7.5 | |||
| 1966 | 10.2 | 2.7 | 7.5 | |||
| 1967 | 11.2 | 3.1 | 8.1 | |||
| 1968 | 8.1 | 4.2 | 3.9 | |||
| 1969 | 5.2 | 3.8 | 1.4 | |||
| 1970 | 5.8 | 3.6 | 2.2 | |||
| 1971 | 9.6 | 4.4 | 5.3 | |||
| 1972 | 10.8 | 4.2 | 6.6 | |||
| 1973 | 13.1 | 4.1 | 9.1 | |||
| 1974 | 17.8 | 4.5 | 13.4 | |||
| 1975 | 16 | 5 | 11 | |||
| 1976 | 10 | 5.3 | 4.7 | |||
| 1977 | 6.8 | 6.2 | 0.6 | |||
| 1978 | 6.8 | 6.3 | 0.5 | |||
| 1979 | 6 | 6.7 | -0.6 | |||
| 1980 | 6.5 | 5.2 | 1.3 | |||
| 1981 | 6.4 | 4.8 | 1.6 | |||
| 1982 | 6.5 | 3.3 | 3.3 | |||
| 1983 | 6 | 2.8 | 3.2 | |||
| 1984 | 5.3 | 2.9 | 2.4 | |||
| 1985 | 5 | 3.2 | 1.8 | |||
| 1986 | 5.5 | 3.2 | 2.3 | |||
| 1987 | 6.8 | 3.1 | 3.7 | |||
| 1988 | 7.4 | 3.6 | 3.8 | |||
| 1989 | 7.4 | 3.8 | 3.6 | |||
| 1990 | 8.2 | 3.5 | 4.7 | |||
| 1991 | 8 | 3.6 | 4.5 | |||
| 1992 | 7.3 | 3.9 | 3.4 | |||
| 1993 | 8.1 | 3.3 | 4.9 | |||
| 1994 | 10.1 | 2.9 | 7.2 | |||
| 1995 | 12.8 | 2.9 | 9.9 | |||
| 1996 | 15.8 | 3.4 | 12.4 | |||
| 1997 | 13.8 | 3.9 | 9.9 | |||
| 1998 | 10.2 | 4.3 | 5.9 | |||
| 1999 | 9.5 | 4.1 | 5.3 | |||
| 2000 | 10.1 | 4.1 | 6 | |||
| 2001 | 12.4 | 4 | 8.4 | |||
| 2002 | 17.3 | 3.8 | 13.5 | 25 | 6.5 | 18.5 |
| 2003 | 24.3 | 7.5 | 16.9 | |||
| 2004 | 19 | 9 | 10 | |||
| 2005 | 17.7 | 9.5 | 8.2 | |||
| 2006 | 18.1 | 8.9 | 9.3 | |||
| 2007 | 20 | 8.8 | 11.2 | |||
| 2008 | 20.9 | 9 | 11.9 | |||
| 2009 | 19.7 | 9.5 | 10.3 | |||
| 2010 | 16.1 | 9.9 | 6.2 | |||
| 2011 | 16.4 | 10.3 | 6.1 | |||
| 2012 | 16.5 | 9.9 | 6.6 | |||
| 2013 | 16.3 | 8.9 | 7.4 | |||
| 2014 | 18.3 | 8.1 | 10.2 | |||
| 2015 | 20.9 | 8.1 | 12.8 | |||
| 2016 | 22.5 | 8 | 14.5 | |||
| 2017 | 21.8 | 8.7 | 13.1 | |||
| 2018 | 21.1 | 9.7 | 11.5 | |||
| 2019 | 21.5 | 9.9 | 11.7 | |||
| 2020 | 23.2 | 9.7 | 13.5 | |||
| 2021 | 4.7 | 8.7 | -4 | |||
| 2022 | 7.3 | 8.3 | -1 | |||
| 2023 | 35.7 | 7.5 | 28.2 | |||
| 2024 | 30.2 | 8.2 | 22 | |||
| 2025 | 21.4 | 10.1 | 11.4 |
Migrants aged 18 to 39 years made up 64,600 (57 percent) of the 113,600 migrant arrivals of non-New Zealand citizens in the June 2025 year.
Changes in migration are typically due to a combination of factors. These include relative economic and labour market conditions between New Zealand and the rest of the world, and immigration policy in New Zealand and other countries.
Departures of New Zealand citizens close to record
There were 71,800 migrant departures of New Zealand citizens in the June 2025 year. This was up from 67,500 in the June 2024 year, and just below the record of 72,400 in the February 2012 year.
Relative to New Zealand's population, the rate of migrant departures of New Zealand citizens was 14 people per 1,000 population in the June 2025 year, compared with a peak rate of 20 people per 1,000 population in the October 1979 year.
| Year | Migrant arrivals (intentions measure) | Migrant departures (intentions measure) | Net migration (intentions measure) | Migrant arrivals (outcomes measure) | Migrant departures (outcomes measure) | Net migration (outcomes measure) |
| 1950 | 0.1 | 0.4 | -0.3 | |||
| 1951 | 0.4 | 0.7 | -0.3 | |||
| 1952 | 1.3 | 1.8 | -0.5 | |||
| 1953 | 2.2 | 1.7 | 0.6 | |||
| 1954 | 2.1 | 1.7 | 0.4 | |||
| 1955 | 1.8 | 2.2 | -0.3 | |||
| 1956 | 1.9 | 2.5 | -0.6 | |||
| 1957 | 2.3 | 2.4 | -0.1 | |||
| 1958 | 2.3 | 2.1 | 0.2 | |||
| 1959 | 2.2 | 2.6 | -0.4 | |||
| 1960 | 2.1 | 3.2 | -1.1 | |||
| 1961 | 2.3 | 3.7 | -1.4 | |||
| 1962 | 3.2 | 3.1 | 0.1 | |||
| 1963 | 3.3 | 3.2 | 0.1 | |||
| 1964 | 3 | 3.1 | -0.2 | |||
| 1965 | 2.9 | 3.8 | -0.9 | |||
| 1966 | 3.2 | 4.3 | -1.2 | |||
| 1967 | 3.3 | 4.8 | -1.5 | |||
| 1968 | 3.1 | 6.2 | -3.1 | |||
| 1969 | 3.2 | 7 | -3.8 | |||
| 1970 | 3.8 | 7.1 | -3.3 | |||
| 1971 | 4.3 | 9.1 | -4.8 | |||
| 1972 | 4.9 | 8.8 | -3.9 | |||
| 1973 | 5.5 | 8 | -2.5 | |||
| 1974 | 5.5 | 9.7 | -4.2 | |||
| 1975 | 5.6 | 9.2 | -3.6 | |||
| 1976 | 5.6 | 8.6 | -3 | |||
| 1977 | 5 | 11.7 | -6.7 | |||
| 1978 | 5 | 14 | -9 | |||
| 1979 | 6.8 | 20 | -13.1 | |||
| 1980 | 7.3 | 17.5 | -10.2 | |||
| 1981 | 7.8 | 17.3 | -9.5 | |||
| 1982 | 8 | 12.9 | -4.9 | |||
| 1983 | 8 | 9.2 | -1.2 | |||
| 1984 | 6.9 | 8.2 | -1.3 | |||
| 1985 | 5.8 | 11.7 | -5.9 | |||
| 1986 | 5.8 | 14.8 | -9 | |||
| 1987 | 7.2 | 14.6 | -7.3 | |||
| 1988 | 7 | 16.3 | -9.4 | |||
| 1989 | 6.5 | 17.3 | -10.8 | |||
| 1990 | 8.1 | 12.1 | -3.9 | |||
| 1991 | 8.5 | 9.3 | -0.8 | |||
| 1992 | 6.4 | 8.8 | -2.4 | |||
| 1993 | 6.2 | 8.6 | -2.4 | |||
| 1994 | 6.4 | 9 | -2.5 | |||
| 1995 | 6.3 | 9.9 | -3.6 | |||
| 1996 | 6.3 | 10.8 | -4.5 | |||
| 1997 | 6 | 11.5 | -5.5 | |||
| 1998 | 5.9 | 11.7 | -5.8 | |||
| 1999 | 5.2 | 13.5 | -8.3 | |||
| 2000 | 5.8 | 14.4 | -8.6 | |||
| 2001 | 5.5 | 16.3 | -10.8 | |||
| 2002 | 6.4 | 11.5 | -5.1 | 7.6 | 12 | -4.4 |
| 2003 | 8.4 | 11 | -2.6 | |||
| 2004 | 8 | 11.9 | -3.9 | |||
| 2005 | 7.5 | 13 | -5.5 | |||
| 2006 | 7.2 | 13.2 | -6 | |||
| 2007 | 7 | 14.8 | -7.7 | |||
| 2008 | 6.8 | 15.9 | -9.1 | |||
| 2009 | 7.3 | 13.8 | -6.5 | |||
| 2010 | 7.4 | 11.6 | -4.2 | |||
| 2011 | 6.7 | 15 | -8.3 | |||
| 2012 | 6.4 | 16.4 | -10 | |||
| 2013 | 7.3 | 14.5 | -7.2 | |||
| 2014 | 8.1 | 10.8 | -2.7 | |||
| 2015 | 8.4 | 9.6 | -1.1 | |||
| 2016 | 8.4 | 9 | -0.7 | |||
| 2017 | 8 | 8.7 | -0.6 | |||
| 2018 | 7.3 | 8.7 | -1.4 | |||
| 2019 | 7.1 | 8.2 | -1.1 | |||
| 2020 | 8.6 | 5.2 | 3.4 | |||
| 2021 | 7.1 | 4.4 | 2.7 | |||
| 2022 | 4.7 | 7.2 | -2.5 | |||
| 2023 | 4.7 | 11.8 | -7.1 | |||
| 2024 | 4.2 | 12.8 | -8.6 | |||
| 2025 | 4.8 | 13.5 | -8.8 |
Migrants aged 18 to 30 years made up 27,200 (38 percent) of the 71,800 migrant departures of New Zealand citizens in the June 2025 year. This compared with a peak of 37,400 (60 percent) in 1979.
"The rate at which New Zealand citizens aged 18 to 30 years are departing long term is lower in 2025 than at the peak in 1979, relative to New Zealand's population in the same age group," Downes said.
The rate of migrant departures of New Zealand citizens aged 18 to 30 years old, relative to New Zealand's population in the same age group, was 31 per 1,000 people in 2025, compared with 56 per 1,000 people in 1979.
New Zealand's population has increased from 3.1 million people in 1979 to an estimated 5.3 million people in 2025.
Migrants are people changing their country of residence, regardless of their country of citizenship or visa status. A 12-month threshold is used to classify migrants from non-migrants, aligned with international guidelines on measuring migration.
Migration is a key contributor to population change in New Zealand. For provisional population estimates see:
- National population estimates: At 31 March 2025 (2023-base) (published 15 May 2025)
- Estimated resident population (2023-base): At 30 June 2023 (published 16 April 2025) for subnational population estimates up to 30 June 2024.
National population estimates: At 30 June 2025 will be published on 19 August 2025.
Subnational population estimates: At 30 June 2025 will be published on 29 October 2025.
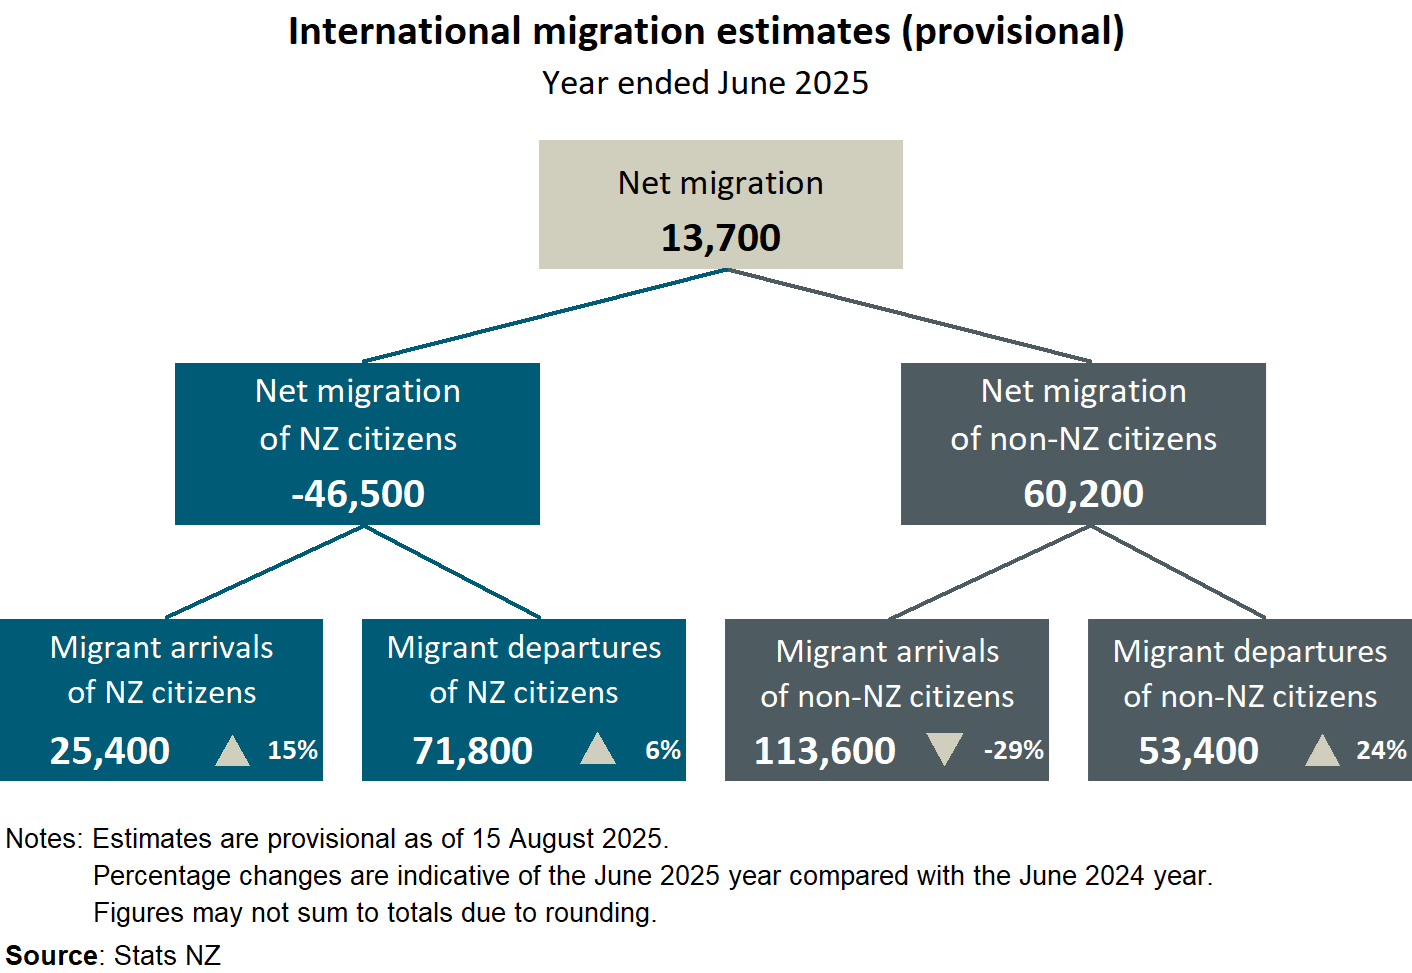
Text alternative for diagram International migration estimates (provisional), year ended June 2025
Diagram shows outcomes-based (provisional) estimates of migration, by citizenship (New Zealand or non-New Zealand) for the year ended June 2025. Overall, net migration is 13,700, made up of a net loss of 46,500 NZ citizens (based on 25,400 migrant arrivals, a 15 percent increase on the year ended June 2024, and 71,800 migrant departures, a 6 percent increase) and a net gain of 60,200 non-NZ citizens (based on 113,600 migrant arrivals, a 29 percent decrease on the year ended June 2024, and 53,400 migrant departures, a 24 percent increase). Estimates are provisional as of 15 August 2025. Source: Stats NZ.


