The tourism satellite account (TSA) provides an overview of tourism's role in the New Zealand economy, highlighting the changing levels and impact of tourism activity. It presents information on tourism's contribution to the economy in terms of expenditure and employment.
This release covers provisional figures for the year ended March 2025 and final detailed results for 2024.
Key provisional estimates
For the year ended March 2025 (expressed in nominal terms):
- total tourism expenditure was $46.6 billion, up 3.3 percent ($1.5 billion) from 2024
- international tourism expenditure was $18.1 billion, up 7.0 percent ($1.2 billion) from 2024
- as a percentage of total exports, international tourism expenditure was 17 percent, down 0.2 percentage points from 2024
- international student expenditure (studying less than 12 months) was $4 billion, up 4.8 percent ($184 million)
- domestic tourism expenditure was $28.5 billion, up 1.0 percent ($0.3 billion or $293 million)
- household tourism expenditure increased 0.1 percent ($31 million) to $21.2 billion
- business and government expenditure increased 3.7 percent ($262 million) to $7.3 billion
- total tourism value added as a proportion of GDP was 7.7 percent, the same as in 2024
- international tourism expenditure was $18.1 billion, up 7.0 percent ($1.2 billion) from 2024
- overseas visitor arrivals increased 4.3 percent to 3,320,687 people
- 38.8 million guest nights were spent in short-term commercial accommodation, a 2.7 percent decrease compared with the previous year
- the number of people visiting for education purposes (studying for less than 12 months) was 50,889, up 0.8 percent (420 students)
- total tourism employment increased 2.8 percent (8,874 people) to 327,888 people
- the number of people directly employed in tourism was 194,631, up 2.7 percent (5,205 people)
- direct tourism employment as a share of the total number of people employed in New Zealand was 6.8 percent.
Tourism expenditure reaches $46.6 billion
Total tourism expenditure increased 3.3 percent ($1.49 billion) to $46.6 billion in the March 2025 year. Total tourism value added, as a proportion of GDP, was 7.7 percent, the same percentage as in 2024.
| Year ended March | International | Domestic | Total |
| 1999 | 6028000000 | 9398000000 | 15426000000 |
| 2000 | 7156000000 | 10313000000 | 17469000000 |
| 2001 | 8218000000 | 10559000000 | 18777000000 |
| 2002 | 9054000000 | 11090000000 | 20144000000 |
| 2003 | 9593000000 | 12078000000 | 21671000000 |
| 2004 | 9691000000 | 12277000000 | 21968000000 |
| 2005 | 10071000000 | 12557000000 | 22627000000 |
| 2006 | 10147000000 | 13156000000 | 23304000000 |
| 2007 | 10676000000 | 13806000000 | 24483000000 |
| 2008 | 11010000000 | 14617000000 | 25627000000 |
| 2009 | 10927000000 | 15232000000 | 26159000000 |
| 2010 | 10316000000 | 14981000000 | 25297000000 |
| 2011 | 10090000000 | 15741000000 | 25831000000 |
| 2012 | 10151000000 | 16313000000 | 26464000000 |
| 2013 | 9958000000 | 16952000000 | 26909000000 |
| 2014 | 10444000000 | 17813000000 | 28256000000 |
| 2015 | 12426000000 | 19183000000 | 31608000000 |
| 2016 | 14864000000 | 20292000000 | 35156000000 |
| 2017 | 14796000000 | 21411000000 | 36208000000 |
| 2018 | 16320000000 | 22764000000 | 39084000000 |
| 2019 | 17164000000 | 23702000000 | 40866000000 |
| 2020 | 17687000000 | 23824000000 | 41512000000 |
| 2021 | 1485000000 | 24980000000 | 26465000000 |
| 2022 | 1943000000 | 25240000000 | 27183000000 |
| 2023 | 10601000000 | 27975000000 | 38576000000 |
| 2024 | 16953000000 | 28180000000 | 45133000000 |
| 2025 | 18147000000 | 28473000000 | 46621000000 |
This increase was driven by international spending, which increased 7.0 percent from 2024. Domestic spending increased 1.0 percent. International tourism expenditure is now higher than its pre-COVID level.
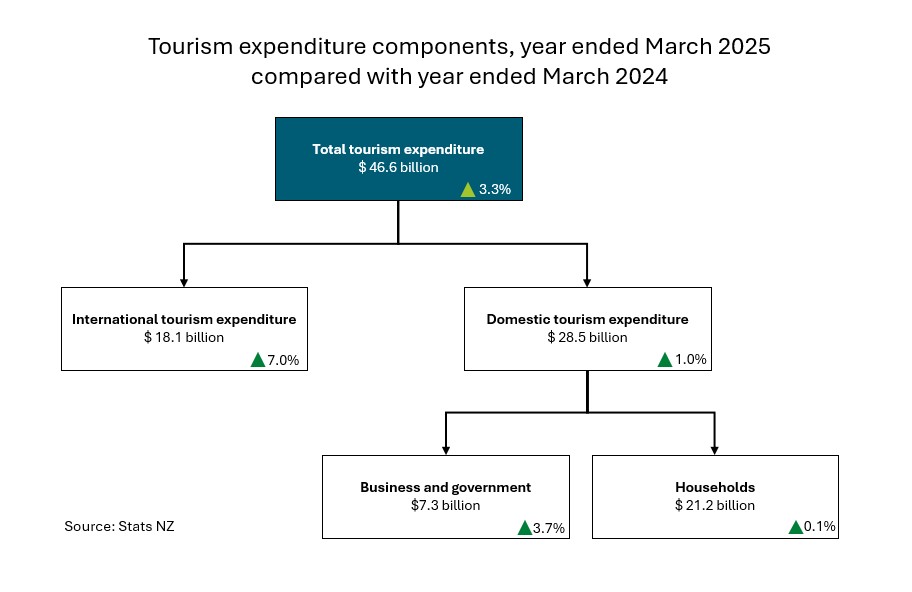
Text alternative for Tourism expenditure components, year ended March 2025 compared with year ended March 2024
The diagram shows total tourism expenditure and its components for the year ended March 2025 and the percentage increases since the year ended March 2024. The components contributing to total tourism expenditure are international tourism expenditure and domestic tourism expenditure. Domestic expenditure is divided into business and government expenditure and household expenditure. Total tourism expenditure is $46.6 billion, up 3.3 percent. International tourism expenditure is $18.1 billion, up 7.0 percent. Total domestic tourism expenditure is $28.5 billion, up 1.0 percent. Business and government expenditure is $7.3 billion, up 3.7 percent. Household expenditure is $21.2 billion, up 0.1 percent. Source: Stats NZ
International tourism accounted for over one-third (39 percent) of total tourism expenditure in 2025. International tourists spent $18.1 billion in 2025, which accounted for 17 percent of total exports from New Zealand.
Tourism expenditure generated $18.0 billion of direct value added. This represents a 4.6 percent contribution to GDP.
Direct value added is defined as total economic value produced by businesses that sell directly to tourists, minus the cost of the goods and services they used to create it.
Tourism employment up by 2.8 percent
The total number of people employed in the tourism industries rose by 8,874 people (2.8 percent) in 2025. The biggest contributor to the increase in direct tourism employment was the food and beverage services industry, which rose by 2,574 people or 4.4 percent.
| Year | Directly employed in tourism | Indirectly employed in tourism |
| 2021 | 145152 | 94950 |
| 2022 | 128586 | 85194 |
| 2023 | 160023 | 108891 |
| 2024 | 189426 | 129588 |
| 2025 | 194631 | 133257 |
In 2025, a total of 327,888 people were employed in tourism industries, which represents 11 percent of all people employed in New Zealand across all sectors.
Direct tourism employment refers to jobs such as travel agents, souvenir sellers, and hotel staff who interact directly with tourists.
Indirect tourism employment refers to jobs such as the manufacture of souvenirs and the provision of cleaning services that support tourism industries.
Data interpretation
The data included in the tourism satellite account contains provisional data, so will be subject to future updates.
In addition, some of the data may be subject to larger-than-usual updates in future, due to the effects of COVID-19 on the longer time series.
Update on COVID-19 and seasonal adjustment has more information.
Key summary tables, year ended March 2025 (provisional)
Tables 1-17 (available under Download data) provide detailed insights into the tourism satellite account for the year ended March 2025, the latest year that provisional data is available. They include information such as:
- tourism expenditure by component, by type of tourist, by type of product
- international tourism expenditure
- tourism employment - direct and indirect
- overseas visitor arrivals
- guest nights by origin
- derivation of tourism supply
- direct tourism value added
- tourism gross operating surplus and gross mixed income.
Detailed product and industry tables, year ended March 2024 (final)
Tables 18-25 (available under Download data) provide detailed insights into the tourism satellite account for the year ended March 2024, the latest year that finalised balanced supply and use data is available. They include information such as:
- tourism expenditure by type of detailed product and type of tourist
- New Zealand System of National Accounts production accounts by industry
- sales by type of detailed product and industry
- derivation of tourism product and industry ratios, direct tourism value added
- direct tourism employment by industry
- gross fixed capital formation and net capital stock by industry.
Data updates
Period-specific information: TSA 2025 - DataInfo+ provides information on data updates.
Results by topic
Download data provides tables with detailed breakdowns of the results in this report.
More data
Use Infoshare for the tourism satellite account time series:
Subject category: Tourism
Group: Tourism satellite account - TSA
Definitions and metadata
Tourism satellite account - DataInfo+ outlines the methodology used to produce the tourism satellite account.
Technical enquiries
Kathy Jackson
[email protected]
04 931 4600
ISSN 1177-6226
Next release
Tourism satellite account: Year ended March 2026 will be released in 2027.