Observed Oceanic Drivers for the Previous Season
From October to December (OND) 2026, global sea‑surface temperatures (SSTs) were generally above average, except in the central and eastern equatorial Pacific.1 The extratropical North Pacific was particularly warm. In the equatorial Pacific, SSTs cooled slightly, with seasonal mean values consistent with a weak La Niña; however, an enhanced east-west SST gradient sustained coupled ocean-atmosphere signals more typical of a stronger La Niña, most clearly reflected in rainfall anomalies.
The Indian Ocean Dipole (IOD) remained in its negative phase, driven primarily by persistent above‑normal SSTs in the eastern Indian Ocean. In the Atlantic basin, SST anomalies were slightly above average in the North Tropical Atlantic (NTA), while the South Tropical Atlantic (STA) remained near zero. Above‑normal SSTs also persisted across the extratropical North Atlantic.
Outlook for Oceanic Drivers for the Next Season
For February-April (FMA) 2026, below‑average SST anomalies in the central and eastern equatorial Pacific are forecast to weaken, indicating a gradual transition toward ENSO‑neutral conditions. Persistently above‑average SSTs in the western Pacific are expected to maintain a pronounced east-west gradient, continuing to reinforce La Niña‑like atmospheric patterns across the equatorial Pacific.
The IOD index is also projected to weaken, moving toward near‑average conditions. In the equatorial Atlantic, SSTs in both the northern and southern tropical latitudes are predicted to be slightly above normal.
Surface Temperature Outlook for the Next Season
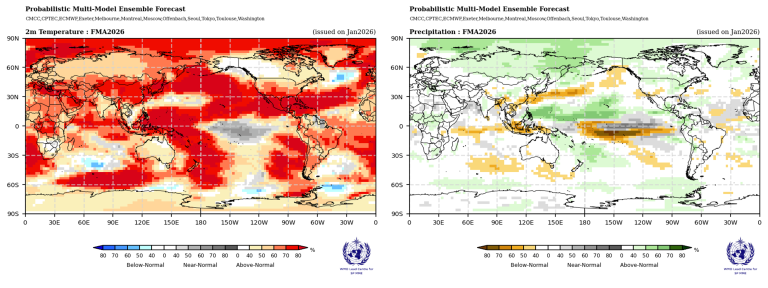
For FMA 2026, the multi‑model ensemble indicates a strong global signal for enhanced probabilities of above‑normal land surface temperatures, with high model agreement across much of the Northern Hemisphere north of 30°N. Southern and extreme northeastern North America, Central America, the Caribbean, and the Arctic all show elevated probabilities for above‑normal conditions, supported by robust model consistency. In contrast, northwestern North America lacks a consistent signal in the ensemble spread.
In the Southern Hemisphere, enhanced probabilities for above‑normal temperatures are predicted over northern New Zealand, while a weaker tilt toward above‑normal conditions is indicated over South America. Most of Australia shows only a modest warm signal, and southern Africa south of 10°S exhibits no clear temperature preference.
Across the tropics, strong enhancement in the probability of above‑normal temperatures is forecast over equatorial Africa and the Maritime Continent, with moderate to strong model agreement reinforcing this signal across multiple systems.
Over the oceans, widespread above‑normal temperatures are projected across the North Pacific, the Atlantic north of the equator between 10°-30°N, and the eastern Indian Ocean, supported by strong model agreement. Elsewhere in the extratropical oceans, below‑normal conditions are limited to isolated regions of the Southern Ocean near 60°S. In the equatorial Pacific east of the Date Line, enhanced probabilities for near‑normal temperatures indicate a tendency for the coupled system to evolve toward ENSO‑neutral conditions.
Rainfall Outlook for the Next Season
For FMA 2026, rainfall predictions in the equatorial Pacific-amplified by an enhanced positive east-west sea‑surface temperature gradient-remain broadly consistent with La Niña‑like conditions, even as SSTs are forecast to evolve toward ENSO‑neutral. Enhanced probabilities for below‑normal rainfall extend eastward from 170°E to near 170°W, continuing just south of the equator toward the western coast of South America. This below‑normal signal also arcs southeastward, terminating near 90°W. Along the equator, probabilities for near‑normal rainfall are forecast from 160°W to the western coast of South America.
Overall, the FMA 2026 rainfall outlook reflects a La Niña‑influenced pattern, with suppressed rainfall across the central and eastern Pacific. Beyond the Pacific, enhanced probabilities for below‑normal rainfall are predicted over southwestern North America, parts of eastern Asia, the Maritime Continent, and the equatorial Indian Ocean. In contrast, probabilities for above‑normal rainfall increase over the Philippine Sea and extend eastward along 15°N, as well as over northern North America, southern Central America extending into northwestern South America, the Caribbean, and northern Asia north of 50°N.
1 https://www.cpc.ncep.noaa.gov/products/attribution/images/Attribution20…