The population living in the North Island now exceeds 4 million, according to estimates released by Stats NZ today.
The North Island's population has grown by an average of 1.3 percent a year since 2018, reaching 4.04 million at 30 June 2024. The South Island's population has grown at a slightly faster rate of 1.4 percent a year, reaching 1.24 million at 30 June 2024.
"It took just over two decades for the North Island's population to increase from 3 million in late 2002 to 4 million in late 2023," population estimates and projections spokesperson Victoria Treliving said.
"Over the same time, the South Island population increased by almost 300,000 people."
These are the first subnational population estimates to fully incorporate the 2023 Census and 2023 Post-enumeration Survey (PES) results. Estimates back to 2018 have been revised, and estimates after 30 June 2023 will use the 2023-base estimated resident population as a starting point.
"Census data and the coverage results from the PES are used to recalibrate national and subnational population estimates," Treliving said.
"This recalibration ensures the population estimates are the best-possible measure of how many people live in communities across the country."
Since 2018, the population of Aotearoa New Zealand has grown by an average of 1.3 percent a year to 5.29 million at 30 June 2024. The latest estimate is 5.31 million at 31 December 2024.
Just over half of New Zealand's population (54 percent) live in the northern four regions of the North Island (Northland, Auckland, Waikato, and Bay of Plenty). These areas accounted for 62 percent of the country's growth since 2018. These regions, along with Tasman and Canterbury, were the only regions that grew faster than the country as a whole.
Selwyn is the fastest-growing area across cities, districts, and Auckland local board areas
New Zealand's population growth over the last decade has been high by historical standards. All but four of the 88 territorial authority and Auckland local board areas grew between 2018 and 2024. Rates of population change over this time ranged between an average of 5.1 percent and -1.9 percent a year.
Across territorial authority areas, Selwyn district was the fastest growing, increasing by 5.1 percent a year between 2018 and 2024. Queenstown-Lakes district was the second-fastest growing, at 3.7 percent a year.
Across the Auckland local board areas, Papakura was the fastest growing, at 5.0 percent a year between 2018 and 2024.
Natural increase (births minus deaths) and net migration (arrivals minus departures) contribute to subnational population change. Net migration for subnational areas includes internal migration (people migrating within New Zealand) and international migration (people migrating between New Zealand and other countries).
"Areas with higher population growth are likely to have high internal and/or international migration gains, with natural increase now generally a lower contributor to growth than in the 20th century," Treliving said.
Eight areas have very low growth or decreases in population
Three territorial authority areas and five Auckland local board areas had growth of less than 0.2 percent a year, or population loss, between June 2018 and June 2024.
Across the cities, Dunedin city grew by an average of 0.1 percent a year between 2018 and 2024. Wellington city had a small population decrease, dropping by 0.1 percent a year.
"In the last two years, Dunedin city has had more deaths than births, resulting in a natural decrease," Treliving said.
"In every year since 2018, more people moved out of Wellington city to other areas of New Zealand, than moved from those areas to Wellington. Dunedin also experienced net losses through internal migration in 2 of the last 6 years. However, both Dunedin and Wellington gained people though international migration."
The population of the Chatham Islands decreased by an average of 1.9 percent a year since 2018, or an estimated 80 people over the six years to a total population of 610 in 2024.
Across the Auckland local board areas, Waitematā, Devonport-Takapuna, and Waiheke each grew by an average of 0.1 percent a year between 2018 and 2024. Meanwhile, Ōrākei, and Albert-Eden had average decreases of 0.1 and 0.2 percent a year, respectively.
"A key driver for the small population growth or decline in Auckland areas was net migration from these areas to other parts of Auckland or elsewhere in New Zealand," Treliving said.
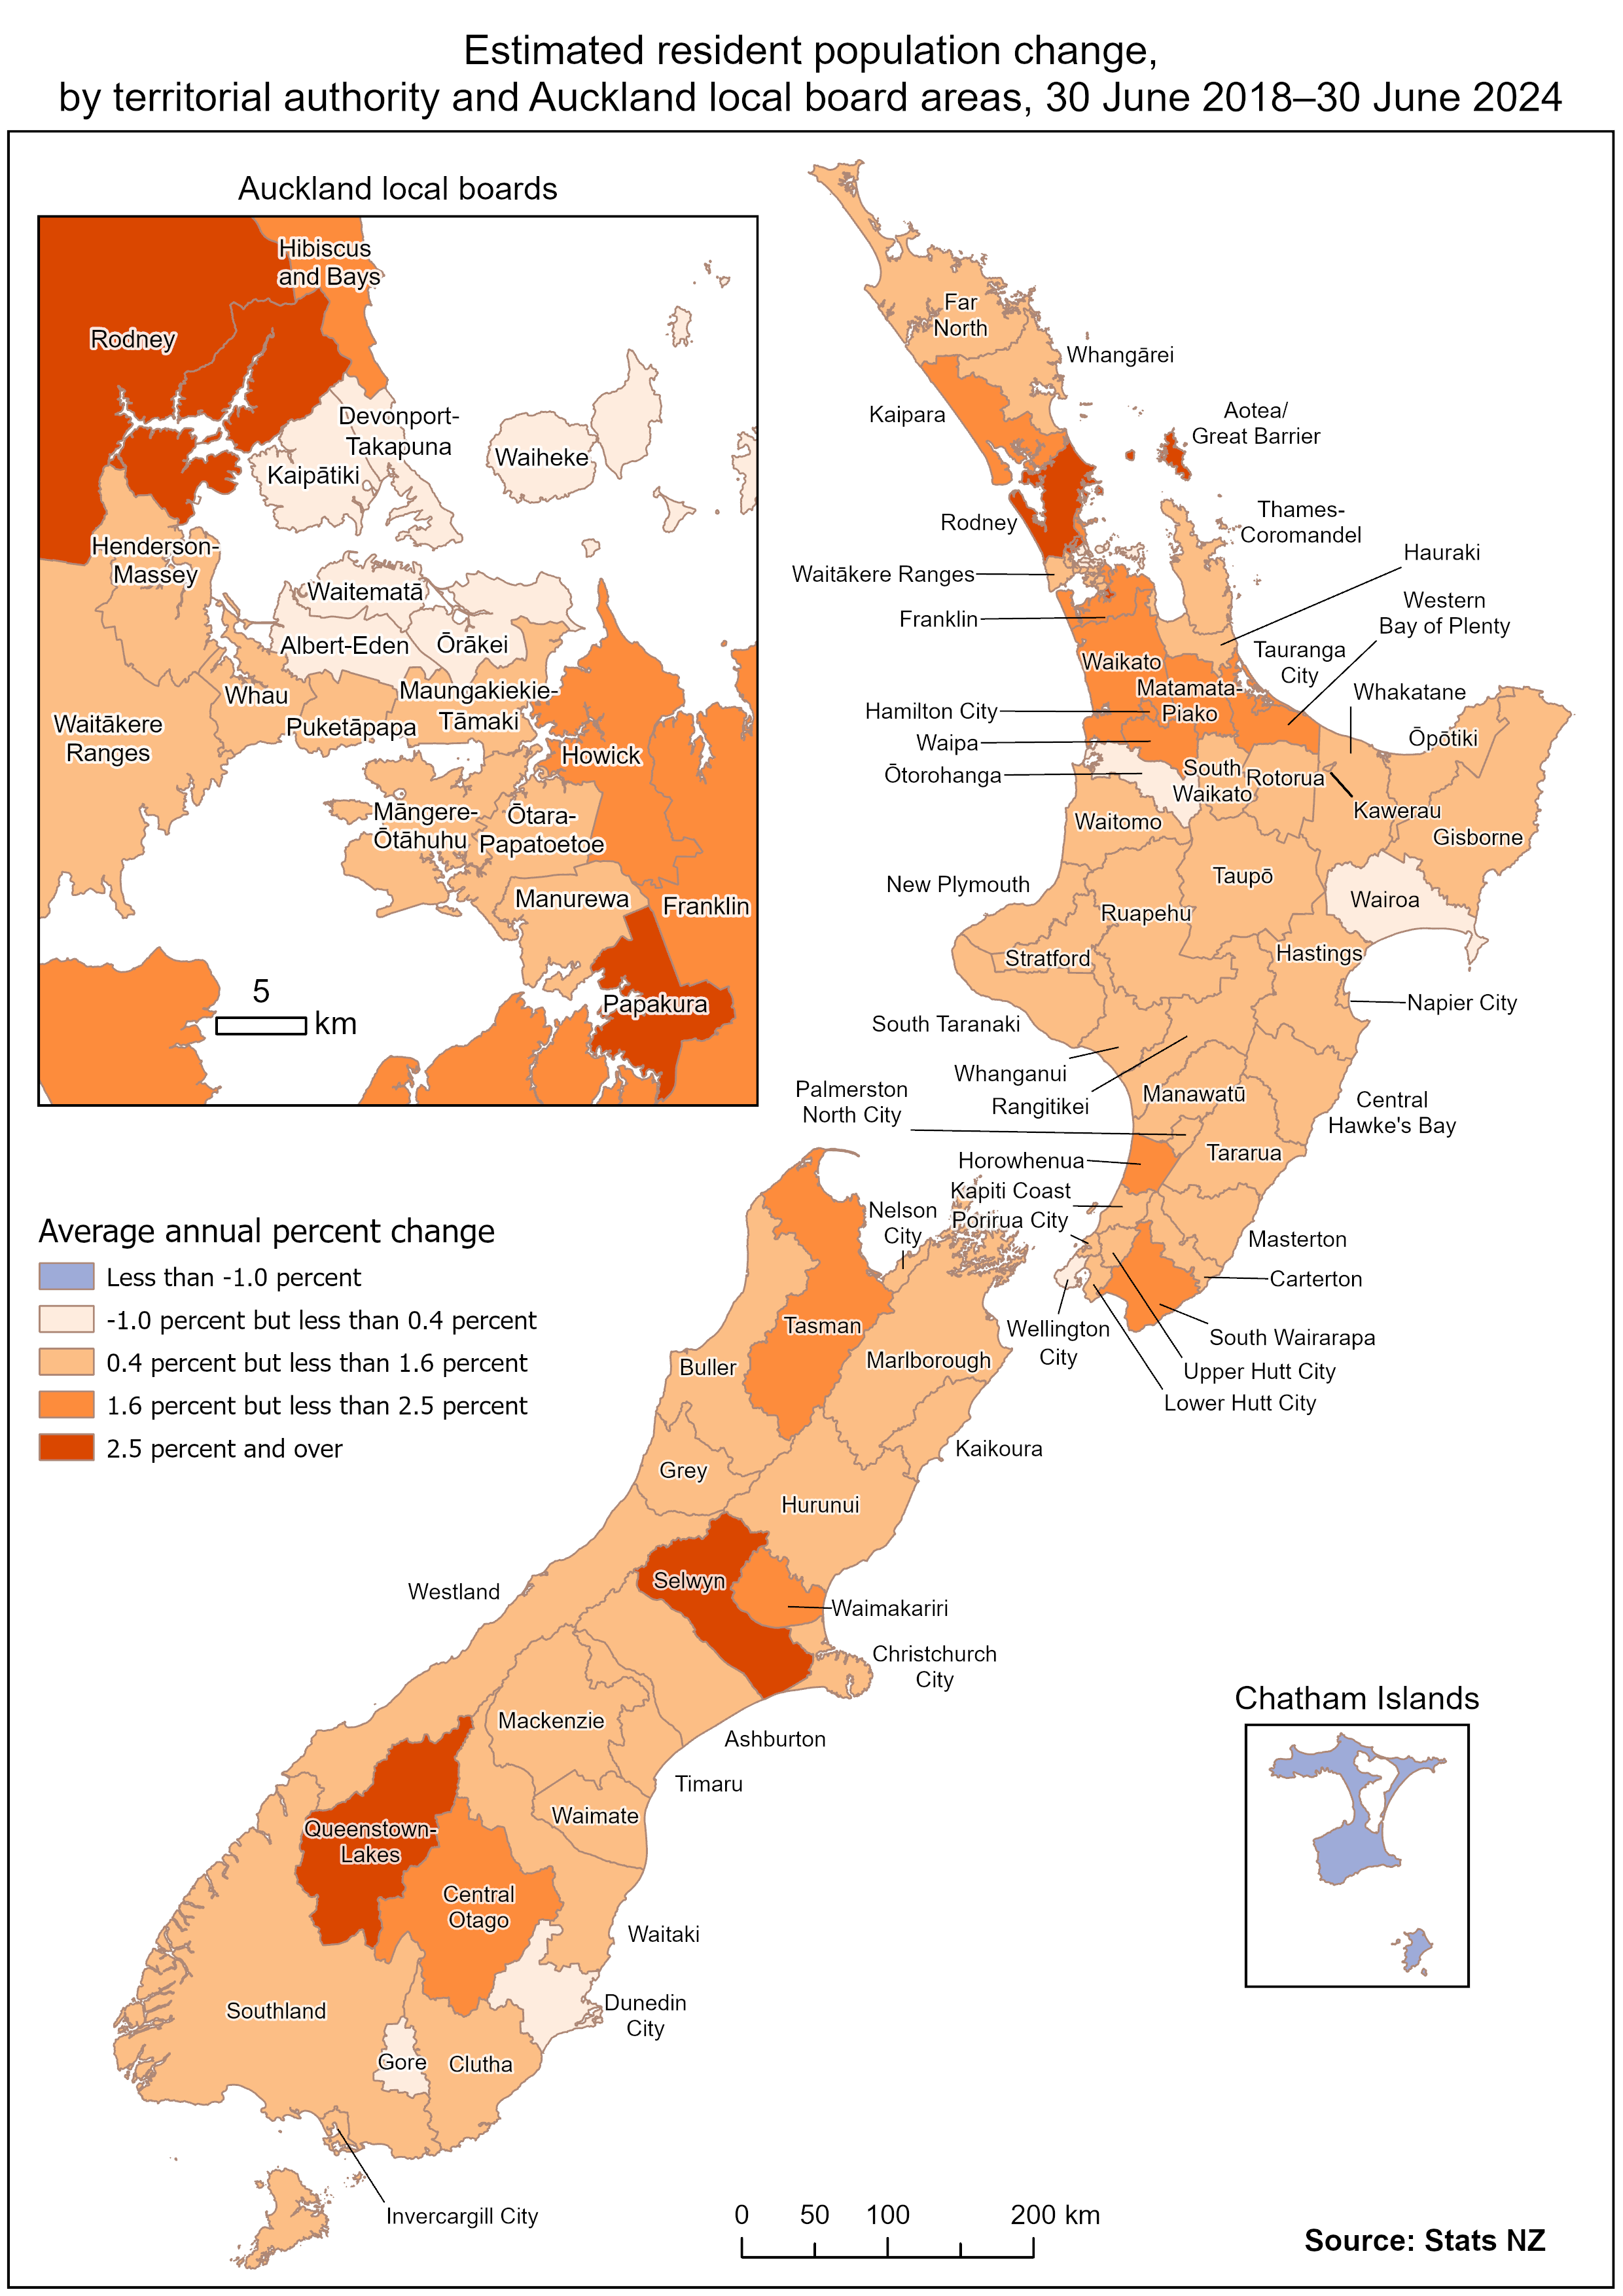
Text alternative for Estimated resident population change, by territorial authority and Auckland local board areas, 30 June 2018-30 June 2024
The map shows the territorial authority and Auckland local board areas, each of which is assigned a colour to show the range of change in estimated resident population from 30 June 2018 to 30 June 2024. The colours are grouped into average annual percent change 2018-2042 of: less than -1 percent; -1 percent but less than 0.4 percent; 0.4 percent but less than 1.6 percent; 1.6 percent but less than 2.5 percent; and 2.5 percent and over. The average annual change ranged from 5.1 percent growth in Selwyn district to 1.9 percent decline in Chatham Islands territory. Data is available from Subnational population estimates (TA, SA2), by age and sex, at 30 June 1996-2024 (2025 boundaries).


