NIST's Testbeds offer real-world environments for conducting rigorous and replicable research. Reliability of the testbed environment is imperative. Thanks to a new technology created by NIST researchers the ability to convert testbed variations into a visual representation to help scientists and engineers analyze their progress is now available.
Testbed stability should be monitored or assessed as part of the execution and analysis of any experiment. Researchers at the National Institute of Standards and Technology have devised a simple graphical device, called a stabilogram, to provide an easy visual check for potential instability in a testbed's operation.
These testbeds often involve a multitude of measurement equipment and devices, running very complex execution protocols over long periods. Changes in the testbed environment, changes in a protocol during an experiment, or "drift" in the measurement devices can all introduce testbed instabilities that may interfere with the experiment's goals. Characterizing the stability of an experimental testbed and its operation is vital in assessing a researcher's hypothesis.
This novel Stabilogram tool converts testbed variations into a visual representation to help scientists and engineers analyze their progress in achieving an experiment's goals. In addition, this tool is intrinsic to understanding enabling a method to illustrate challenges to a greater diverse audience (i.e., we want the black box to be bigger than the red box). Understanding why portions of the testbed weren't repeatable or the cause of systematic variations is critical for producing high-quality scientific research interpretations and conclusions.
The squares in a Stabilogram represent the different sources of variability in the experiment response: a black square for natural random measurement variation, a blue square for the signal of interest, and red squares for interfering proxy variables in the testbed that contribute to instability. The squares' areas represent the statistical variance of the three sources of variability (signal, noise, or interference power) and the squares' edges are standard deviations of those three sources.
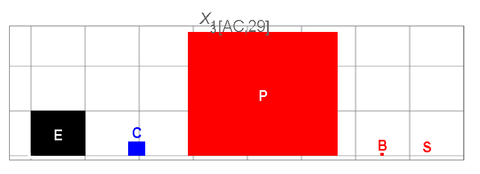
This Stabilogram's interpretation is quick and intuitive. If any of the Stabilogram's red squares are of the same order or larger than the black square, instability is said to be present for purposes of testbed investigation. The greater the size of a red square relative to the black square, the greater the testbed instability. If a red square is large relative to the blue signal effect, this renders the signal difficult to detect with the response under consideration. In the absence of any large red instability square, the problem of detecting the signal represented by the blue square comes down to comparing the blue square's size to that of the black random variation (noise) square.
Stabilograms are based on a statistical analysis of variance (ANOVA) and readily apply to experiments as simple as detecting the presence of a single experimental factor effect. By simple modification of the ANOVA model, Stabilograms can be prepared equally well for experiments with more than one experiment factor and/or two factors with more than two levels and, in particular, for factor screening experiments with many factors. For a stabilogram to be applicable, though, many identical measurements (i.e., replicate runs) are needed, a requirement that can usually be satisfied. An in-depth derivation of the stabilograms can be found here.
NIST's Michael Frey, Mary Gregg, Jacob D. Rezac, Jason B. Coder, and Jeanne Quimby use this tool in their Device-level Anomaly fRamEwork (DARE) project to determine how well they translated instability into real-world applications. Anomalies hide within the temporal instability (i.e., patterns & variations) of the communication infrastructure. The stabilogram provides a visual way to understand the impact of variability that exists in a measurement. The Stabilogram tool is available for industry or other government agencies to implement on their testbed or measurement system. Measurements could be from the communications system as shown above, or any other field of science.
The DARE team is finishing a technical report named Stabilograms: Testbed Stability in a Pilot Experiment for Cellular Communications Anomaly Detection that is due this summer.


