Download the entire news release (graphs and tables included PDF)
15/10/2020 - The OECD area employment rate - the share of the working-age population with jobs - fell by 4.0 percentage points, to 64.6%, in the second quarter of 2020, its lowest level since the fourth quarter of 2010. Across the OECD area, 560 million persons were in employment in the second quarter of 2020, 34 million less than in the previous quarter.
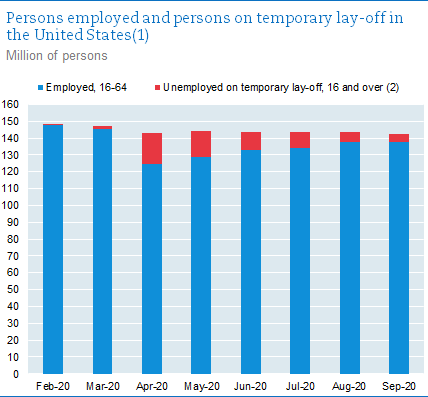
Care is needed in interpreting the latest data however, as a large part of the fall in the second quarter reflects a significant increase in furloughed workers in the United States and Canada, where this category of worker is recorded as unemployed whereas they are recorded as employed in most other countries. In Canada and the United States employment rates dropped by 8.5 percentage points (to 64.7%) and 8.9 percentage points (to 62.5%) respectively in the second quarter. With many furloughed workers now returning to work, more recent data for the third quarter of 2020 show employment rates increasing in Canada (up 5.7 percentage points, to 70.4%) and the United States (up 3.8 percentage points, to 66.3%), but still remaining 2.8 and 5.1 percentage points below the level of the first quarter of 2020.
In the euro area the employment rate decreased by 1.9 percentage points, to 66.2% in the second quarter of 2020, with decreases of 3.0 percentage points or more in Estonia, Ireland and Spain. Among other countries, it fell by 1.0 percentage point in Japan (to 77.0%), by 0.2 percentage point in the United Kingdom (to 75.4%), and by more than 3.0 percentage points in Australia, Chile, Colombia, Iceland and Turkey.
Employment rates fell across all population groups. While male and female employment rates both fell by around 4.0 percentage points (to 72.0% and 57.3% respectively), the youth employment rate dropped more sharply (down 5.6 percentage points, to 36.3%) than for people aged 25-54 (down 4.0 percentage points, to 74.7%) and for those aged 55-64 (down 2.8 percentage points, to 59.3%).
|
|
Link to underlying data - Source: Quarterly Labour Market Statistics, OECD |
(1) The chart provides a more comparable view of movements in US employment statistics with movements in most other OECD countries, where furloughed workers are included in official employment statistics. It should however not be interpreted as alternative official statistics for the United States. In this chart, the number of employed covers age group from 16 to 64, while the number of unemployed on temporary lay-off covers age group 16 and over. (2) US Current Population Survey data |


