This is our experimental section. The administrative population census is an experimental output using a different methodology than what is currently used to produce the census or the official estimated resident population. These are not official statistics, and we advise caution when using the data.
25 January 2024: We have updated this page to include information about the third iteration of the administrative population census (APC), released in October 2023.
Information for Māori about the experimental administrative population census (APC) brings together information that is most directly relevant to iwi-Māori to support their use of the data and involvement in the development of the APC.
We provide background information about the APC and the importance of census to Māori and explain how to provide feedback. We then describe the quality of the two variables available in the APC that identify Māori: Māori descent and Māori ethnicity. We summarise how the quality of all other APC individual information variables for individuals with Māori ethnicity compares with the quality of variables for the total New Zealand population. We finish with an overview of the household information now available in the third iteration of APC.
Contents
Introduction to the experimental administrative population census (APC)
Māori descent and Māori ethnicity in the APC
Quality of individual attribute information for Māori
Household information
Next steps
More information
References
Introduction to the experimental administrative population census (APC)
Developing the APC
The APC is a different way of producing census information because it uses administrative data as the main data source, rather than asking everyone to fill out a questionnaire. Administrative data includes data such as birth registrations and tax records, which are already collected by government agencies. The APC uses de-identified data in the Integrated Data Infrastructure (IDI) and has been approved as an IDI research project under the Ngā Tikanga Paihere framework.
We want to test how good this new way of producing census-type information is, to hear from Māori about what they see as the benefits, and what improvements they would like.
The APC is part of Stats NZ's census transformation programme, which explores the use of administrative data to produce census information. Administrative data is already used in the five-yearly census: in 2018 and 2023, the census used administrative data (where possible) to fill in missing data gaps when people did not complete the census questionnaire.
The APC is being developed in stages, with changes guided by feedback we have received. The first release of the APC was in September 2021, followed by a second iteration in October 2022, and a third in October 2023. The APC (third iteration) currently has the following data about individual people and households for each year from 2006 to 2022.
Individual variables
- Age and sex
- Usual residence
- Usual residence 1 and 5 years ago
- Years at usual residence
- Number of children born alive
- Ethnicity
- Māori descent
- Birthplace
- Years since arrival in NZ
- Highest qualifications and field of study
- Study participation
- Personal income: total personal income and income sources
- Employed indicator and status in employment
- Industry and sector of ownership
Household variables
- Household membership
- Household size: number of usual residents in household, and age of youngest resident
- Household income: total household income and household income sources
- Familial relationship
- Usual residence address for households
Feedback will help guide further development. We acknowledge that iwi affiliation is of high interest and is not yet available in the APC. Work at Stats NZ is ongoing to explore the feasibility to derive iwi affiliation mainly from admin data. This work is not yet mature enough to be included in the APC but may be in future iterations.
For some census topics, such as language spoken, religion, and activity limitations, administrative data is very limited. Information for these types of variables can currently only be sourced through a survey questionnaire.
Stats NZ's commitment to, with, and for Māori, iwi, and hapū
We are releasing iterations of the experimental APC to show what can be achieved now with administrative data, and to provide Māori with the opportunity to be involved in further development. We want to understand what Māori and iwi see as the benefits of sourcing census-type information from administrative data, what the limitations are of the APC as it is now, and how it could be improved from an iwi-Māori perspective.
Stats NZ's statement of strategic intentions 2021-2025 includes a goal to produce more and better data for, with, and about Māori. Stats NZ aims to improve the quality and quantity of data about Māori to better inform their decisions about their social, economic, and cultural wellbeing.
Census data is the main source of information about the counts of Māori and iwi populations and provides detailed social and economic characteristics for local communities. Kukutai and Cormack (2018) describe the importance of the census for Māori. They state that "[c]ensus data are crucial for the distribution of resources and for monitoring the impact of Crown policies and (in-)actions in relation to its obligations under Te Tiriti o Waitangi and international conventions". Census data on ethnicity is important for communities to plan and monitor outcomes and inequities by ethnicity, and to monitor changes over time. The census provides authoritative information on the number of people of Māori descent that are used in the electoral system to determine the number of Māori seats in Parliament. Census data is crucial for informing decisions about government spending, for example, for schools, housing, hospitals, GP services, superannuation, and roads. Value of the census for Māori (2019) found that the census delivers considerable financial value for Māori, primarily from using ethnicity data in allocating government funding and services that help improve Māori wellbeing.
More accurate and frequent measurement of the population was stated as a priority for iwi-Māori in the government's data investment plan (2021). The APC is a step towards providing more frequent information about Māori populations at the same (or more detailed) levels as the five-yearly census does now.
Iwi data needs (Te Kāhui Raraunga) says that iwi require more timely data beyond the five-yearly census, and includes the dimensions of population, education, and employment as examples (among others) of the types of information important for iwi to assess their state of wellbeing. These same variables are included in iwi reports for Te Rūnanga o Ngāi Tahu's State of the nation and Te Whata. APC data can describe the basic demographics of populations - age and sex distributions, and where people live. The APC also includes variables derived from the IDI data that are presented in Te Rūnanga o Ngāi Tahu's State of the nation report and Te Whata, such as achievement in education, income and income sources, and benefits received. The APC also has information such as the industry people work in, and the movement of people between areas. Using administrative data allows us to provide this census-type information and do so more frequently.
Iwi data needs explicitly mentions the IDI as providing opportunities to generate more timely and relevant datasets. The APC is an example of what can be achieved with IDI data, with a focus on topics currently collected through the census, and makes many of these insights derived from IDI data available to everybody. At present, the APC identifies Māori populations by ethnicity and Māori descent. If iwi affiliation can be included in future, information in the APC would be readily available to iwi without the need for expertise to derive it from the IDI.
What we've learnt so far
The first and second iterations of the APC were publicised mainly through newsletters and emails aimed at those who regularly use census data. Dedicated workshops in late 2022 and early 2023 were aimed at researchers and at analysts from government agencies. Two of these workshops were expressly for researchers with interest in Māori and Pacific topics. Engagement also included presentations in the Te Ngira: Institute for Population Research seminar series at the University of Waikato in May 2023 and the Population Association of New Zealand's 2023 conference. Direct contact with a representative from Waikato Tainui provided a very valuable perspective.
The feedback from the workshops and conversations was generally positive, although there were some concerns expressed related to our level of engagement with iwi-Māori. We were not as successful in engaging with as many Māori researchers as hoped through the workshops.
Everyone agreed about the importance of getting the population count right. Ethnicity is a variable that many people care deeply about, and the importance of understanding data quality was often raised. Some workshop attendees stated that they would like more information on quality, or that information on quality was more accessible.
A common theme from our engagement was the demand for more detailed published outputs. People said they valued having data for every year, and the inclusion of small geographies and ethnicity. Work, income, and education variables were requested after the first iteration and included in the second iteration. Household data was another common request and has been included in the third iteration. The data visualisation tool was welcomed as a way to make data easier to use for all communities. We have continued its development, trying to make it easier to use with every iteration. Another suggestion was to include more options for cross-tabulation between variables in the tables on the website, especially between ethnicity and other variables. In the 2023 release of the APC, individual information has been made available for many ethnicities including Māori. For example, it is now possible to see how the formal highest qualification level for 15 to 29-year-old people of Māori ethnicity in the Waikato region has changed over the last decade. Given the high level of missing information, breakdowns are not provided for the Māori descent population, but we hope to be able to do so in the future.
An area of concern was the quality of Māori descent information, given the importance of this variable and the relatively high level of missing data. The second iteration of the APC included death registrations and the Household Labour Force Survey as additional data sources for Māori descent, which slightly reduced the level of missing data. Future research will include investigation of the electoral roll as another source of Māori descent data that could help fill the gaps. The quality of ethnicity data has improved since the first iteration through the inclusion of ethnicity that parents report for themselves for birth registrations, which is a high-quality administrative data source.
Feedback emphasised the need for deeper consultation and agreement throughout the planning and engagement periods to be included in Stats NZ's wider conversations about the value of administrative data for Māori, within a te ao Māori context.
Interest was expressed in the potential for inclusion of iwi affiliation in the future. The Data Iwi Leaders Group (DILG) has expressed support for Stats NZ to explore Māori descent and iwi affiliation information in administrative data and to discuss possible administrative data sources, methods, and limitations. Stats NZ is looking at the potential for combining recent census iwi affiliation data with some administrative sources.
Kōrero with Stats NZ
Stats NZ is planning engagement following the release of 2023 Census data , as well as starting engagement on the approach for the 2028 Census. The 2023 Census combined model will use administrative data from previous censuses and statistical imputation to fill gaps in census variables and add records to the census file. The APC, and the insight it allows, will be a valuable tool that will provide a practical demonstration to help explain and understand the quality and potential of the use of 'administrative data first' in the census context.
As in previous years the APC team plans to organise several workshops with a technical focus on the third iteration of the APC, but we are also available for less formal hui organised around the interests of participants. We will contact individuals and groups directly where we can. If you would like to participate in a workshop, get more information about APC, or give feedback, please email [email protected].
How to use the APC data
Experimental administrative population census has downloadable data tables, and an easy-to-use 'point and click' tool that shows data on a map of New Zealand.
Use the mapping visualisation tool to explore APC counts in areas that you choose. This includes counts of people of Māori ethnicity, and Māori descent for standard geographies: regional councils, territorial authority and Auckland local boards, and the smaller statistical geographies (SA3 and SA2). You can select multiple areas at the same time, so you could approximate other areas like rohe by combining SA3s and SA2s. You can select data to create simple graphs for any variable and to construct customised tables that you can download.
You can also choose most level 1 and 2 ethnicities as the base population, including Māori ethnicity. All data is then presented only for that chosen population. The data is also available as downloadable tables. Simpler tables are provided in an easy-to-use Excel format. More detail is provided in a range of CSV tables, suitable for those who prefer machine-readable data. Information is available for each variable by age group, sex, and geography, with as much detail as confidentiality requirements allow.
The underlying data has many more possibilities for analysis. For example, using Māori ethnicity as the base population, you could compare income between those who have recently moved to an area with those who have lived there for longer. However, this sort of analysis introduces greater complexity, and it is important that analyses are done with an appropriate understanding of the concepts. De-identified APC unit record data is available to all researchers in the IDI. Tables can be requested free of charge from Te Ara Takatū: Census data for iwi and iwi-related groups or through Stats NZ's customised data services for a fee. These Stats NZ services can also assist in working through more complex analyses.
Māori descent and Māori ethnicity in the APC
Here we describe the two variables in the APC that identify Māori: Māori descent and Māori ethnicity.
Definitions
Māori descent and Māori ethnicity are two main ways of identifying who is Māori in New Zealand. The two concepts are closely related but are not the same. Kukutai (2004) argued that both are important and "any definition of Māori ought to include both ancestry and ethnicity".
Māori descent is based on whakapapa, and is defined formally in the statistical standard for Māori descent as:
"A person has Māori descent if they are of the Māori race of New Zealand: this includes any descendant of such a person."
The classification has three response options: 'Yes', 'No', and 'Don't know'. There is an important relationship between Māori descent and iwi affiliation: iwi is also based on whakapapa and is defined for people who have Māori descent.
Ethnicity is about cultural belonging, and is defined formally in the statistical standard for ethnicity as:
"Ethnicity is the ethnic group or groups that people identify with or feel they belong to. Ethnicity is a measure of cultural affiliation as opposed to race, ancestry, nationality, or citizenship. Ethnicity is self-perceived and people can belong to more than one ethnic group."
There are nearly 200 ethnicities and the classification groups these at different levels of detail. Māori ethnicity is one of six ethnic groups at level 1 of the ethnicity classification together with European, Pacific Peoples, Asian, 'Middle Eastern, Latin American and African', and Other.
Measuring quality in the APC
We have measured quality of data for Māori ethnicity and Māori descent by looking at how closely the derived administrative values agree with the responses people gave in the 2018 Census and how consistent all the administrative data sources are with each other. The level of missing data is another important factor in overall quality. We also compared the numbers derived from the APC with the 2018 Census and the official estimated resident population (ERP).
Experimental administrative population census (third iteration): Information by variable provides more information about the methods used to derive the quality measures.
Māori descent
Sources of APC data for Māori descent
Māori descent data in the APC comes from several sources, which are used in the following order:
- Department of Internal Affairs birth registrations: Māori descent is a question on the birth registration form, for the new baby and for the parents. The question in its current form has been asked since 1995.
- 2013 Census: used for people who are not in the birth registrations data.
- Department of Internal Affairs death registrations: Māori descent is a question on the death registration form for the deceased. It provides a small amount of information for earlier iterations of the APC.
- Household Labour Force Survey: provides information for a very small number of people who do not have Māori descent recorded in the other sources.
Quality of Māori descent data in the APC
The quality of Māori descent data in the APC is very good for people that we have a value for, but there are too many people who do not have any Māori descent information (14 percent were missing a value for Māori descent in 2018). There are two main reasons for this gap. The first is older people who were born in New Zealand and have not been listed on birth certificates as children or as parents after 1995 and who also do not have Māori descent information in the 2013 Census. The second gap is new migrants to New Zealand who have not had children born in New Zealand.
Table 1 shows the quality rating score for non-missing data is 0.95. This means that we are at least 95 percent sure on average that the information is correct. With 14 percent of data missing in 2018, the overall output quality rating is 0.82. Table 1 also shows how quality measures vary by birthplace. Again, we see that where we do have data, the quality is very good both for people born in New Zealand or born overseas. The differences are mainly due to the level of missing data, which is much higher for those born overseas (31 percent missing) than those born in New Zealand (7 percent missing) rather than any differences in the quality of the administrative sources.
Table 1
Birthplace |
Missing (percent) |
Non-missing quality rating |
Output quality rating |
New Zealand |
7 |
0.95 |
0.88 |
Overseas |
31 |
0.97 |
0.68 |
All |
14 |
0.95 |
0.82 |
Source: Stats NZ |
The electoral roll also collects Māori descent and the combination of birth registrations and electoral roll data (those 18 years and older who enrol to vote) would help to fill the missing data gap and provide ongoing information for much of the population. The recent passing of the Data and Statistics Act 2022 allows Stats NZ to have access to electoral data for statistical purposes, and research will be a priority once data is available.
Table 2 shows the counts for Māori descent in the APC and the 2018 Census and the percent distribution of Māori descent calculated from the stated values. The relatively large number of people with missing data in the APC (about 680,000) means that the total number of people with Māori descent is too low. The distributions of the total with stated responses are similar to the census, with the APC 'Māori descent = Yes' proportion slightly higher at 19.3 percent compared with the 2018 Census value of 18.5 percent. However, given the large number of missing responses, the APC proportional distribution may simply be coincidence.
Table 2
Māori descent |
Count |
Percent of total stated |
||
2018 APC (30 June) |
2018 Census (6 March) |
2018 APC (30 June) |
2018 Census (6 March) |
|
Yes |
802,419 |
869,850 |
19.3 |
18.5 |
No |
3,255,726 |
3,715,050 |
78.4 |
79.0 |
Don't know |
95,685 |
114,855 |
2.3 |
2.4 |
Total people |
4,153,830 |
4,699,755 |
100.0 |
100.0 |
Missing |
672,543 |
… |
… |
… |
Total people |
4,826,373 |
4,699,755 |
… |
… |
Note: This data has been randomly rounded to protect confidentiality. Symbol: … not applicable Source: Stats NZ |
Figure 1, the age distribution of the APC for those of Māori descent, shows the undercount compared with the census and the official estimated resident population (ERP). The ERP is based on census counts, but is adjusted for net census undercount, residents temporarily overseas on census night, and changes due to births, deaths, and migration, between census night and the reference date. The undercount is fairly even across all ages.
Figure 1
| Age (five-year age groups) | APC | ERP | 2018 Census |
| 0-4 | 86739 | 94080 | 88266 |
| 5-9 | 91944 | 100940 | 96432 |
| 10-14 | 83964 | 93680 | 87654 |
| 15-19 | 73269 | 86370 | 78069 |
| 20-24 | 67440 | 80210 | 70995 |
| 25-29 | 61695 | 74740 | 65976 |
| 30-34 | 50502 | 59090 | 53235 |
| 35-39 | 45312 | 52020 | 48138 |
| 40-44 | 44220 | 51930 | 48576 |
| 45-49 | 45261 | 55270 | 51522 |
| 50-54 | 39414 | 49990 | 46866 |
| 55-59 | 36501 | 46830 | 43389 |
| 60-64 | 26631 | 34210 | 32241 |
| 65-69 | 20118 | 25520 | 24249 |
| 70-74 | 13251 | 16420 | 15366 |
| 75-79 | 8505 | 10520 | 10053 |
| 80-84 | 4638 | 5690 | 5355 |
| 85-89 | 2229 | 2650 | 2505 |
| 90+ | 786 | 1020 | 969 |
Ethnicity
Sources of APC data on Māori ethnicity
Ethnicity data in the APC comes from these government agencies:
- Department of Internal Affairs: ethnicity is a question on birth registration forms, for the new baby and for the parents.
- Ministry of Education: ethnicity is asked when children are enrolled at school and when students enrol at tertiary institutions like polytechnics and universities.
- Ministry of Health: people can be asked for their ethnicity when they go to the doctor or are treated in hospital.
- Ministry of Social Development: people are asked for their ethnicity when they apply for working age benefits.
- 2013 Census responses are used in a small number of cases to fill administrative data gaps.
People's view of the ethnic group they belong to can change over time, and people do not always give the same answers about their ethnicity in different situations. Stats NZ has compared the ethnicity people report to different agencies with the answers they give in the census. When we derive ethnicity for the APC, we use the source that is most similar to the census first (this is birth registrations). Birth registrations give us ethnicity for about half the population. If there is no ethnicity from birth registrations, we use the next best source, if it is available. We get an ethnicity for nearly everyone (99 percent) from the top four sources, in this order: birth registrations parents, birth registrations child, tertiary education enrolments, and Ministry of Health. For a very small number of people, we need to use ethnicity data from school enrolments and the Ministry of Social Development. Finally, if there is no information in any of these administrative sources, we use ethnicity response in the 2013 Census. Almost everyone in the APC then has an ethnicity.
Combining information from several sources in this way means the ethnicity data derived for the APC is better quality than from any of the sources on their own.
Quality of Māori ethnicity data in the APC
Looking at quality measures derived for the APC and comparing populations between the APC, the census, and the official ERP, indicates that the overall quality of Māori ethnicity data in the APC is very good.
The quality rating score for non-missing data is 0.94. This means that we are at least 94 percent sure on average that Māori ethnicity responses have been recorded correctly. Since ethnicity information is available for nearly everyone (table 3), the overall output quality is 0.94. These results compare well with the other level 1 ethnic groups.
Table 3
Level 1 ethnic group |
Missing |
Non-missing |
Output quality |
European |
0.97 |
0.97 |
|
Māori |
0.94 |
0.94 |
|
Pacific Peoples |
0.92 |
0.92 |
|
Asian |
0.97 |
0.97 |
|
MELAA |
0.67 |
0.67 |
|
MELAA = Middle Eastern/Latin American/African Source: Stats NZ |
|||
In table 4, we compare the APC data for 2018 with the 2018 Census and the official estimated resident population (ERP) in 2018. The ERP is based on census counts, but is adjusted for net census undercount, residents temporarily overseas on census night, and changes due to births, deaths, and migration, between census night and the reference date.
There are small differences in the total counts for Māori ethnicity between APC, the census, and ERP. The APC count of Māori ethnicity for 2018 is slightly higher than the 2018 Census and 3.7 percent lower than the ERP. In contrast, the APC count for the total population is 2.1 percent lower than the ERP. Māori ethnicity as a proportion of the total population is similar (all are between 16.3 and 16.7 percent).
Table 4
Level 1 ethnic group |
Count |
Percent, relative to respective |
||||
2018 |
APC |
Official ERP |
2018 |
APC |
Official ERP |
|
European or Other |
3,355,917 |
3,369,807 |
3,441,750 |
71.4 |
70.0 |
70.2 |
Māori |
775,836 |
787,317 |
816,470 |
16.5 |
16.3 |
16.7 |
Pacific |
381,642 |
408,105 |
407,670 |
8.1 |
8.5 |
8.3 |
Asian |
707,598 |
727,917 |
770,550 |
15.1 |
15.1 |
15.7 |
MELAA |
70,332 |
76,578 |
76,960 |
1.5 |
1.6 |
1.6 |
Total people |
4,699,755 |
4,815,516 |
4,900,600 |
100.0 |
100.0 |
100.0 |
Note: This data has been randomly rounded to protect confidentiality. |
||||||
MELAA = Middle Eastern/Latin American/African |
||||||
Source: Stats NZ |
||||||
Figure 2 shows the age distribution of the APC closely follows the patterns of the ERP distribution, but is slightly lower with some discrepancies in the late teen years. APC counts are similar to, or higher than, the 2018 Census.
Figure 2
| Age (years) | APC | ERP | 2018 Census |
| 0 | 16998 | 16910 | 16248 |
| 1 | 16767 | 16670 | 16128 |
| 2 | 16629 | 16890 | 16272 |
| 3 | 16569 | 16760 | 16224 |
| 4 | 16791 | 16880 | 16332 |
| 5 | 17130 | 17340 | 17385 |
| 6 | 17550 | 17570 | 17136 |
| 7 | 17820 | 17910 | 17796 |
| 8 | 18018 | 18330 | 17847 |
| 9 | 17682 | 17890 | 17655 |
| 10 | 17640 | 18010 | 17523 |
| 11 | 16866 | 17110 | 16431 |
| 12 | 15876 | 16360 | 15654 |
| 13 | 15141 | 15630 | 15387 |
| 14 | 15012 | 15420 | 14760 |
| 15 | 14385 | 15260 | 14451 |
| 16 | 14259 | 15340 | 14610 |
| 17 | 14661 | 15710 | 15036 |
| 18 | 14493 | 15210 | 13917 |
| 19 | 13857 | 14170 | 13059 |
| 20 | 14010 | 14210 | 13092 |
| 21 | 13752 | 13840 | 12807 |
| 22 | 13791 | 13870 | 12693 |
| 23 | 13533 | 13540 | 12393 |
| 24 | 13095 | 13360 | 12180 |
| 25 | 13047 | 13420 | 12297 |
| 26 | 13188 | 13430 | 12255 |
| 27 | 12900 | 13060 | 12024 |
| 28 | 12342 | 12720 | 11442 |
| 29 | 11970 | 11980 | 10887 |
| 30 | 11373 | 11520 | 10626 |
| 31 | 10677 | 10700 | 9747 |
| 32 | 10029 | 10120 | 9369 |
| 33 | 9732 | 9690 | 9033 |
| 34 | 9279 | 9340 | 8739 |
| 35 | 9117 | 9160 | 8613 |
| 36 | 8994 | 8990 | 8616 |
| 37 | 9249 | 9220 | 8631 |
| 38 | 8787 | 8910 | 8538 |
| 39 | 8997 | 9080 | 8568 |
| 40 | 8709 | 8930 | 8610 |
| 41 | 8583 | 8810 | 8238 |
| 42 | 8652 | 8870 | 8538 |
| 43 | 8814 | 9070 | 8661 |
| 44 | 9075 | 9310 | 9000 |
| 45 | 9249 | 9680 | 9306 |
| 46 | 9342 | 9840 | 9378 |
| 47 | 9261 | 9690 | 9096 |
| 48 | 8775 | 9320 | 8958 |
| 49 | 8703 | 9280 | 8790 |
| 50 | 8520 | 9050 | 8556 |
| 51 | 8451 | 8830 | 8214 |
| 52 | 7920 | 8320 | 8118 |
| 53 | 7980 | 8550 | 8049 |
| 54 | 7956 | 8430 | 8289 |
| 55 | 8370 | 8870 | 8403 |
| 56 | 8121 | 8500 | 8016 |
| 57 | 7485 | 7990 | 7500 |
| 58 | 7038 | 7490 | 7092 |
| 59 | 6993 | 7240 | 6744 |
| 60 | 5997 | 6460 | 6279 |
| 61 | 5919 | 6190 | 5907 |
| 62 | 5445 | 5790 | 5541 |
| 63 | 5022 | 5350 | 5103 |
| 64 | 4686 | 4980 | 4788 |
| 65 | 4455 | 4800 | 4782 |
| 66 | 4221 | 4510 | 4233 |
| 67 | 3960 | 4260 | 4173 |
| 68 | 3675 | 3970 | 3780 |
| 69 | 3285 | 3580 | 3408 |
| 70 | 3111 | 3300 | 3153 |
| 71 | 2700 | 2980 | 2820 |
| 72 | 2229 | 2500 | 2469 |
| 73 | 2178 | 2390 | 2253 |
| 74 | 1896 | 2110 | 1974 |
| 75 | 1734 | 1890 | 1926 |
| 76 | 1608 | 1830 | 1731 |
| 77 | 1503 | 1780 | 1746 |
| 78 | 1470 | 1630 | 1521 |
| 79 | 1215 | 1320 | 1299 |
| 80 | 1005 | 1150 | 1053 |
| 81 | 963 | 1030 | 996 |
| 82 | 777 | 900 | 894 |
| 83 | 627 | 750 | 738 |
| 84 | 582 | 660 | 612 |
| 85 | 498 | 570 | 552 |
| 86 | 378 | 470 | 432 |
| 87 | 354 | 410 | 417 |
| 88 | 255 | 330 | 330 |
| 89 | 225 | 260 | 237 |
| 90 | 537 | 730 | 723 |
Quality of individual attribute information for Māori
As above for Māori descent and Māori ethnicity, we measure the quality of each of the APC's variables in two ways:
- by the proportion of people we have data for; and
- by a score for the non-missing data.
We then combine both these numbers into a quality score. For example, for highest qualification we have data for 88 percent of the 2018 New Zealand resident population aged 15 years and over. The level of highest qualification for these 88 percent agrees with the 2018 Census 85 percent of the time. Combining these two numbers means we have an 'output' quality score of 0.75 (=0.88*0.85). So, a low quality score can be the result of data missing or indicates that the data we have is wrong. We know there are major drivers for both aspects. The biggest ones are:
- There is less administrative data available for recent migrants, so missingness is higher for topics such as education or family relationship.
- Younger people between 15 and 29 years are generally more mobile, which means it is harder to find the right address for them in administrative data.
- There is less lifetime administrative data available in digitised form for older people. For example, parent-child relationships are not in DIA data before 1985.
We also compute the quality scores only for the people who have Māori ethnicity (we could also do this for Māori descent, but these scores would be less meaningful for the current data given the missingness problems for descent itself). Figure 3 compares these with the overall New Zealand scores and shows a mixed picture, with higher numbers for some variables and lower ones for others. Overall, the numbers are very close to the New Zealand average.
With the Māori population being younger than the total New Zealand population but also being less likely to be born overseas, the three drivers above explain most of the differences we see. For example, for number of children born (for which we mainly rely on New Zealand birth records) we are less likely to fail to include births that happened overseas. These differences will not be same when looking at the same comparison for specific areas, age groups, or responses.
Figure 3
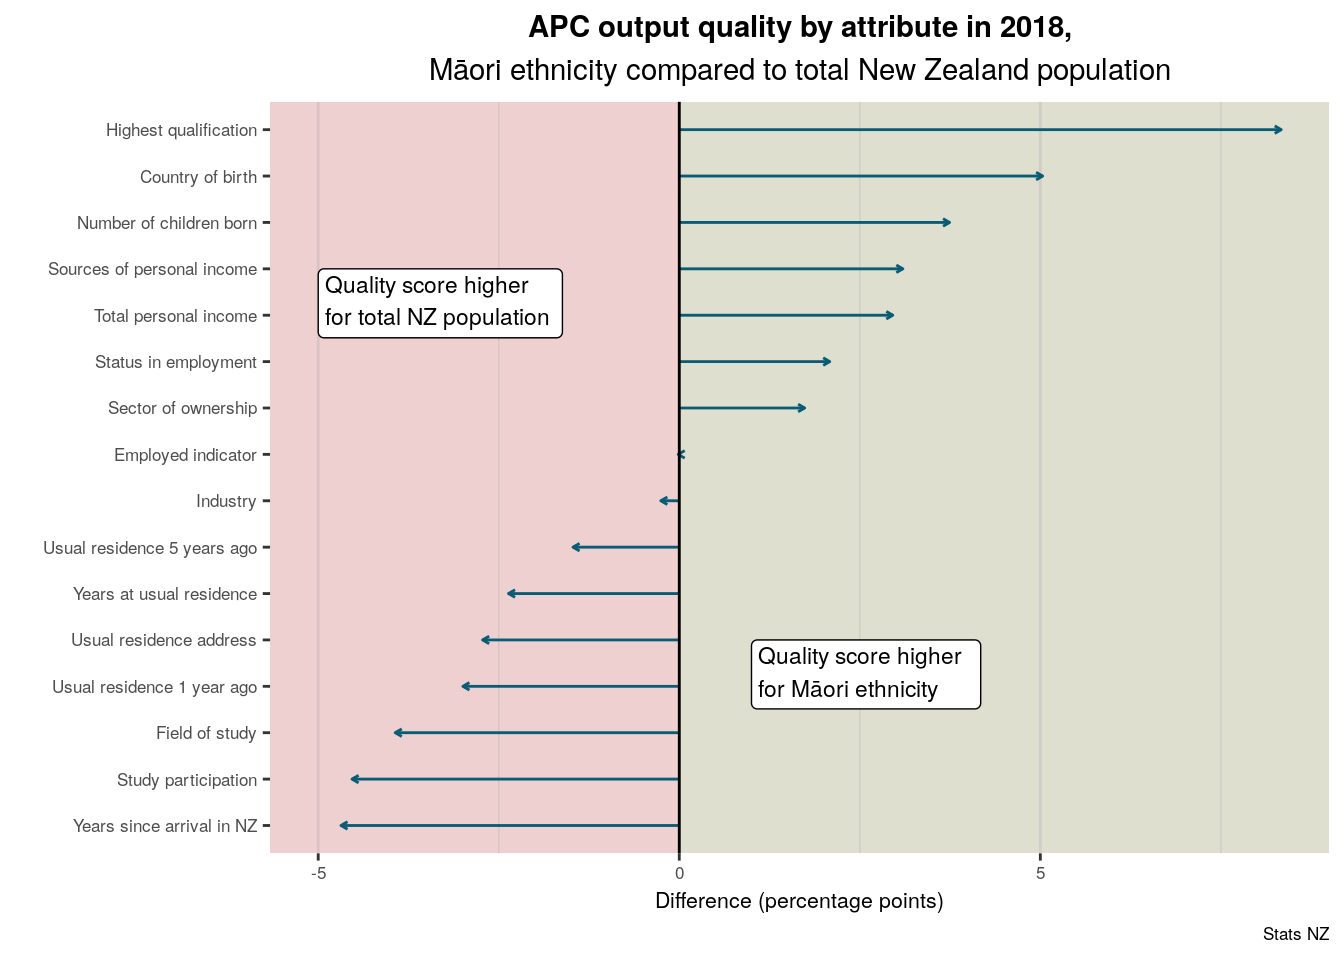
Text alternative for APC output quality by attribute in 2018, Māori ethnicity compared to total New Zealand population
This graph lists most individual information attributes in the APC on the y (vertical) axis. The graph is in two adjoining sections that compare attribute quality for those with Māori ethnicity with the total NZ population The zero point on the x axis is shown as a solid line that vertically divides the graph into two areas with different background shading. Horizontal lines with arrowheads show the attribute quality scores. Scores that are higher for the overall NZ population are on the left of the zero line (pink background, scale from -5 to 0) and attribute quality scores that are higher for people with Māori ethnicity are on the right of the zero line (green background, scale of 0 to 10). The output quality scores for people who have Māori ethnicity are close to those for the overall NZ population. The difference in percentage points ranges from being higher by 5 to 7.5 percent for highest qualification and country of birth to lower by about 5 percentage points for years since arrival in NZ and study participation.
More detailed information about the methods used to derive these attributes and their quality can be found in Experimental administrative population census (third iteration): Information by variable.
Household information
In November 2023, administrative household information was added to the APC. Experimental administrative population census (third iteration): Data sources, methods, and quality for household information contains details on this topic.
Definitions
For the APC we define an administrative household as a group of people who live at the same address. In most cases this is the same as people who live in the same dwelling, which is the definition used in the census. Both APC and census households do not capture the idea of whānau, because, for example, whānau members may not all live in the same place. There is currently no statistical definition for whānau.
Because household data is linked to individual information, we can count households where one or more members have Māori ethnicity and/or Māori descent. This is a fairly broad approach to defining what a 'Māori household' might be, and other definitions are possible.
Sources of APC household data
Addresses are collected from nine government agencies. For identifying households, the APC uses a mixture of machine learning and rules-based methods to identify a person's address. Ninety-eight percent of the time, the more advanced machine-learning method used in the APC for households chooses the same address as the one recorded in the 2018 Census.
What household data shows us
The APC household data is available for every year 2006 to 2021. This means that household variables for these households (for example, household income, or number of household members) can be measured over time. Having annual data is an improvement when compared with the census, which only gives five-yearly snapshots.
Figure 4 counts households where at least one member has Māori descent or ethnicity between 2006 and 2021. In any year:
- about half of these households have three or less members and half have four or more members
- about 7 to 8 percent of households have seven or more household members (the bottom band in the figure)
- about 12 to 13 percent of households consist of people living alone (the top band in the figure).
Even though the total number of households grew between 2006 and 2021, the percentage of households in each band in any given year is very stable.
Figure 4
| Year (at 30 June) | One household member | Two household members | Three household members | Four to six household members | Seven or more household members |
| 2006 | 47565 | 81870 | 74172 | 123372 | 28167 |
| 2007 | 47094 | 82725 | 73854 | 124983 | 27888 |
| 2008 | 47037 | 83694 | 74223 | 125295 | 27477 |
| 2009 | 47421 | 85464 | 75255 | 126366 | 26595 |
| 2010 | 47736 | 87123 | 75636 | 127032 | 27105 |
| 2011 | 47841 | 87774 | 75444 | 127449 | 27108 |
| 2012 | 47679 | 89286 | 75279 | 127080 | 25863 |
| 2013 | 47016 | 90045 | 75450 | 126600 | 24885 |
| 2014 | 48942 | 91452 | 77043 | 129870 | 26136 |
| 2015 | 49545 | 92097 | 77448 | 130893 | 27333 |
| 2016 | 48252 | 91539 | 77076 | 132258 | 27969 |
| 2017 | 47031 | 90930 | 75762 | 133824 | 28770 |
| 2018 | 46611 | 90501 | 75375 | 135033 | 30048 |
| 2019 | 47622 | 90402 | 75615 | 138486 | 31224 |
| 2020 | 49422 | 91797 | 77595 | 141594 | 32784 |
| 2021 | 52263 | 95400 | 80256 | 144357 | 33378 |
The APC counts more large households compared with the 2018 Census. In the 2018 Census 2.0 percent of households have seven or more members, while for the APC it is 3.5 percent. The differences for smaller households are less pronounced and need further investigation. Ongoing work on improving the dwelling information, address coding, and household formation will improve accuracy in the future.
The APC also contains familial relationship groupings within and outside of households. These are basic relationships, such as parent-child, siblings, grandparents, and aunts and uncles. Figure 5 shows that compared with the 2018 Census the counts of relationships between household members in the APC broadly agrees. It also shows that there are many more relationships across the New Zealand population available in the APC that are not captured in the census. There is currently no statistical definition of whānau. However, the increased relationship data provides the potential to define family relationships outside the household structure. We would be keen for feedback and discussions on this possibility.
Figure 5
| Relationship type | 2018 Census | APC within household | APC across population |
| Partner | 1513599 | 1419183 | 1924602 |
| Parent - Child | 3720786 | 4062564 | 7310034 |
| Sibling | 739206 | 825279 | 1957074 |
| Grandparent - Grandchild | 153738 | 193326 | 2422362 |
| Great-grandparent - Great-grandchild | 5718 | 2334 | 150090 |
| Aunt/Uncle - Niece/Nephew | 70314 | 109947 | 2508156 |
| Other relative | 69252 | 18789 | 581043 |
Next steps
We aim to strengthen our engagement with Māori and move into a more collaborative partnership so that APC develops in ways that benefit Māori. The APC also serves as an anchor to build understanding of the broader potential for uses of administrative data.
We will be talking to people about the APC in workshops in early 2024 and are always happy for conversations in any format. This feedback will help us decide what improvements can be made for the next iteration of the APC. We also look forward to hearing about ways to make APC data on the website more useful for Māori.
Investigating the use of electoral roll to improve Māori descent is a priority, and we will continue to explore ways of providing iwi affiliation.
More information
Experimental administrative population census includes the data tables and data visualisation tool.
Experimental administrative population census: Data sources, methods, and quality (second iteration) has more information about the data sources, methods and summarises the quality of the APC as a whole. Experimental administrative population census (third iteration): Changes to data, methods, and quality outlines changes made to the third iteration.
Experimental administrative population census (third iteration): Data sources, methods, and quality for household information contains details with a focus on households.
Experimental administrative population census (third iteration): Information by variable describes how each variable has been derived in more detail and provides quality measures and some results.
References
Kukutai, T & Cormack, D (2018). Census 2018 and Implications for Māori. New Zealand Population Review, Vol. 44, 131-151.
Kukutai, T (2004). The Problem of Defining an Ethnic Group for Public Policy: Who Is Māori and Why Does It Matter? Social Policy Journal of New Zealand, Vol. 23.
ISBN 978-1-99-104914-8


