By reforming agriculture in specific areas, we can protect the Natura 2000 areas much more effectively. This is what Jan Willem Erisman of Leiden University and Ton Brouwer of Gispoint consultancy write in a new report. With a special nitrogen map, they make clear in which areas in the Netherlands the most can be gained. They aim to contribute to a new and targeted nitrogen policy.
Nitrogen Map
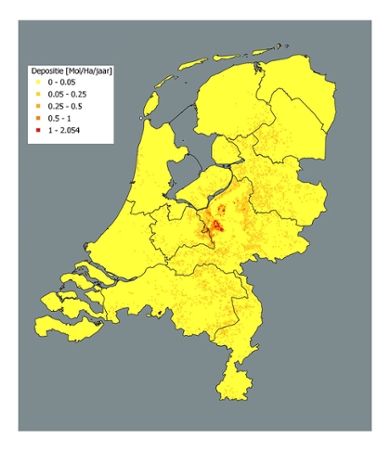
The nitrogen problem is complex: Many sources contribute to the nitrogen surplus in the protected Natura 2000 areas. The largest source is still agriculture, due to the emission of ammonia (see box below). Natural and agricultural areas are spread like a patchwork over the Netherlands. Some farmers emit more nitrogen than others, and it is not always clear how much of that emission ends up in nature reserves. Erisman and Brouwer therefore made a so-called Deposition Contribution Map. This shows where you have to reduce nitrogen emissions to have the greatest possible effect on all Natura 2000 areas.
Problem areas
Erisman and Brouwer made the map by dividing the Netherlands into squares of 1 by 1 kilometre and by calculating for each square where the nitrogen emissions from that square end up. Erisman: 'This way, you eventually know for each compartment to what extent that compartment is responsible for the nitrogen increase in the nature reserves. These compartments turned out to be mainly in the Gelderse Valley, and on the sandy soils in Brabant, Overijssel, Gelderland and Drenthe.'
They are mainly areas with a central location, which makes it easier to spread the nitrogen to various surrounding nature areas, says Erisman. 'Besides, these areas also have relatively high nitrogen emissions. There are other problems in these areas, such as increasingly poor soil quality and the leaching of nutrients from the soil into the groundwater. By tackling these areas, we can also save on climate change, so you kill several birds with one stone.'
Area-specific approach
With the help of the map, we can make the current nitrogen policy much more effective, says Erisman. We need to zoom in on the areas that currently cause the highest deposition and reduce nitrogen emissions from agriculture there. With such an area-specific approach, we can achieve a much greater effect with the same reduction in nitrogen emissions than with the approach in the current nitrogen policy.
And that difference is considerable, Erisman explains. With the current policy, halving the total nitrogen emissions in agriculture would only adequately protect one-third of all Nature 2000 areas. Whereas with an area-based approach and the same reduction, we can protect almost twice as many nature reserves.
Effective policies
The map can help to determine a maximum ammonia emission per area, targeted effective emission reductions, the design of a reward system for emission reductions (the more impact on nitrogen emissions, the more reward), or the design of an effective buy-back policy. Such a buy-out policy already exists, but does not take sufficient account of the spread of nitrogen. Erisman: 'If your farm is within ten kilometres of a Natura 2000 area, and you emit a certain amount of nitrogen, you can let the government buy up your farm. The government has 350 million available for buying up a total of 100 farms. With 54,000 companies in the Netherlands that is a drop in the ocean. But by buying up in a targeted way across the whole of the Netherlands, we can probably make a difference after all.'
The nitrogen problem in a nutshell
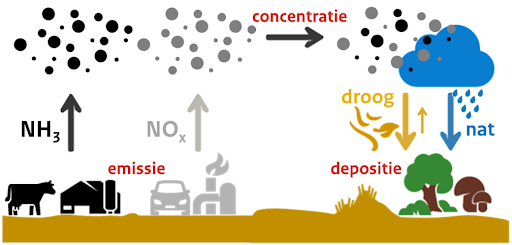
Nitrogen (N) is the most important nutrient for plants and essential for food production. Farmers therefore use it as fertiliser. Part of the nitrogen ends up in the air in the form of ammonia (NH3). Other sectors, such as traffic and industry, also emit nitrogen oxides (NOx).
This ammonia and nitrogen oxides come down, also in the vulnerable Natura 2000 areas. Here they 'enrich' the soil. That sounds positive. But rare plants that thrive on nutrient-poor soil lose out to plants that prefer nutrient-rich soil. And so, for example, the stinging nettle is driving out the rare orchid. Animals and insects that live off the rare plants also disappear. Of the 160 nature areas in the Netherlands, 120 have too high an amount of nitrogen.


