The seasonally adjusted unemployment rate was 3.6 percent in the June 2023 quarter, compared with 3.4 percent last quarter, according to figures released by Stats NZ.
Unemployment, along with underemployment and the potential labour force, is one of the components that comprise underutilisation - a broader measure of spare labour market capacity than unemployment alone.
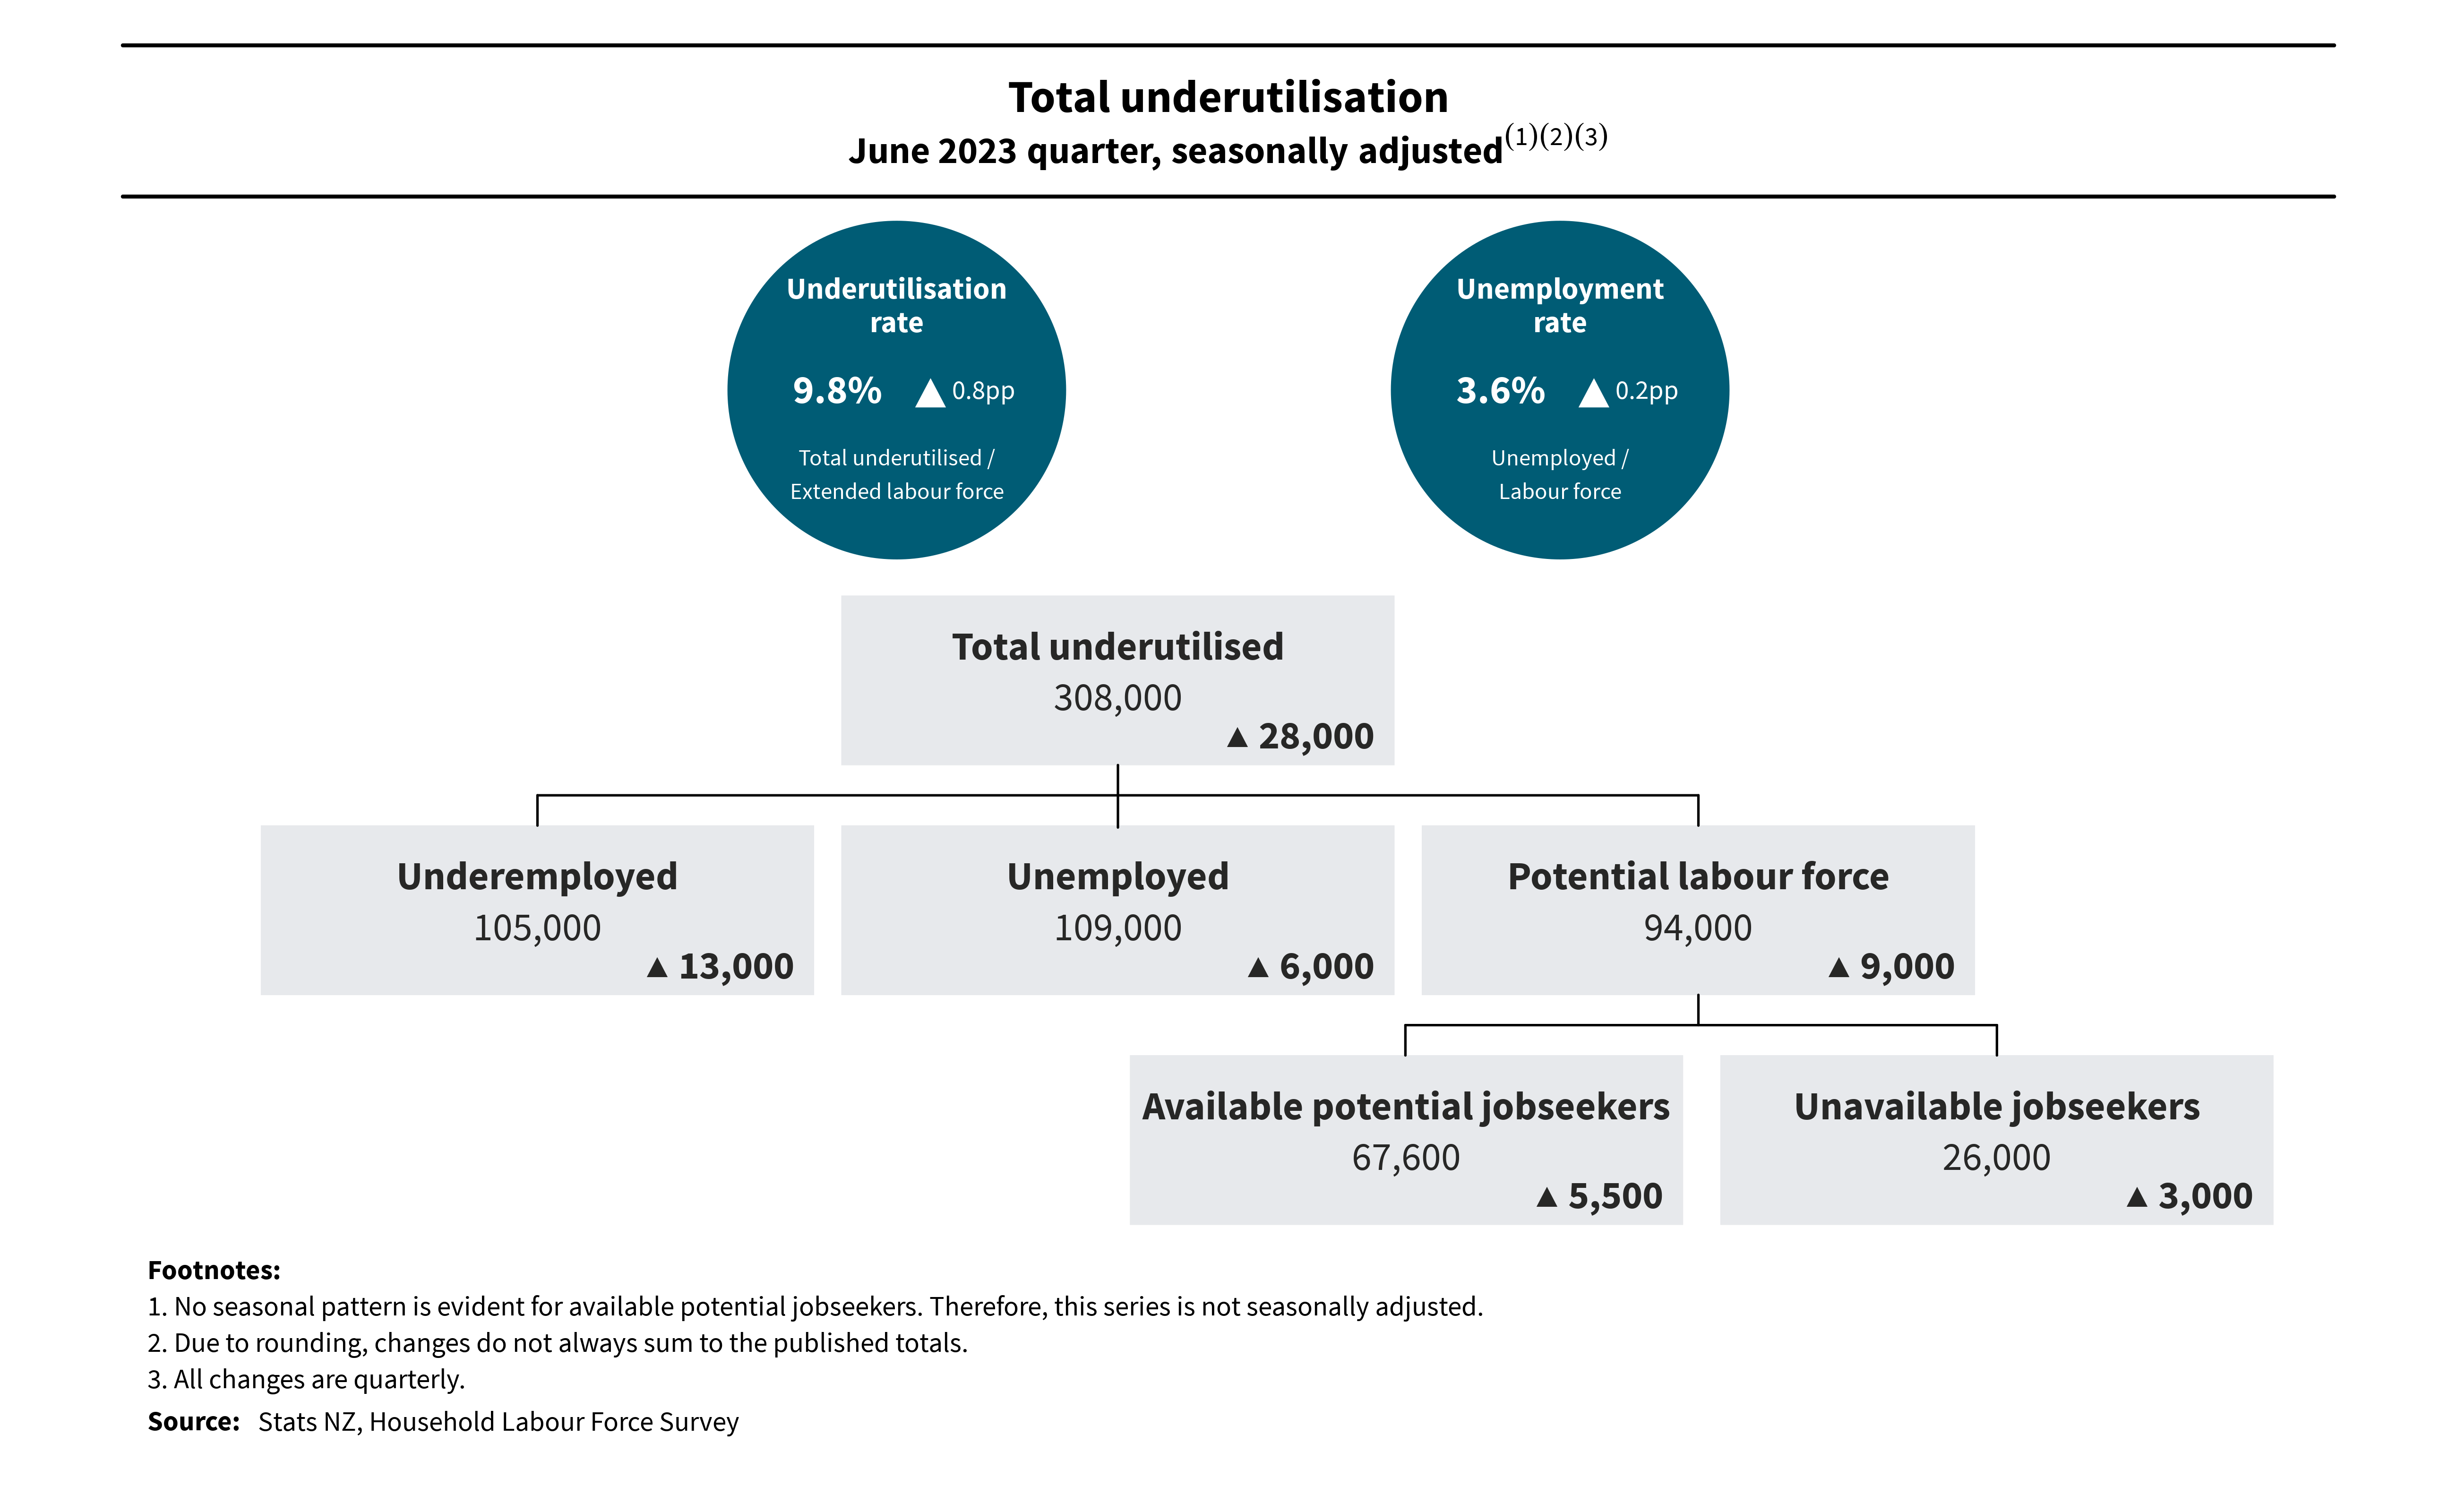
The underutilisation rate increased from 9.1 percent (revised) to 9.8 percent this quarter. The largest increase came from growth in underemployed part-timers, who wanted and were available to work more hours.
Text alternative for diagram of total underutilisation, June 2023 quarter, seasonally adjusted
"Despite the strong quarterly increase, the June 2023 quarter underutilisation rate remains relatively low compared with historic averages," work and wellbeing statistics senior manager Becky Collett said.
| Quarter | Men | Women | Total |
| Mar-04 | 8.1 | 13.6 | 10.7 |
| Jun-04 | 7.6 | 12.8 | 10 |
| Sep-04 | 7.6 | 12.6 | 9.9 |
| Dec-04 | 7.6 | 12.5 | 9.9 |
| Mar-05 | 7.4 | 11.7 | 9.4 |
| Jun-05 | 7.7 | 11.8 | 9.6 |
| Sep-05 | 7.3 | 11.2 | 9.1 |
| Dec-05 | 7 | 11.9 | 9.3 |
| Mar-06 | 7.3 | 10.8 | 9 |
| Jun-06 | 7.2 | 10.3 | 8.6 |
| Sep-06 | 7.2 | 10.7 | 8.8 |
| Dec-06 | 8.3 | 12.7 | 10.4 |
| Mar-07 | 8 | 12 | 9.9 |
| Jun-07 | 7.3 | 12.6 | 9.8 |
| Sep-07 | 7.3 | 11 | 9 |
| Dec-07 | 7.5 | 11.1 | 9.2 |
| Mar-08 | 8.4 | 12.3 | 10.3 |
| Jun-08 | 8.5 | 11.7 | 10 |
| Sep-08 | 8.6 | 12.6 | 10.5 |
| Dec-08 | 9.3 | 13.6 | 11.3 |
| Mar-09 | 10.5 | 14.3 | 12.3 |
| Jun-09 | 11.8 | 15.8 | 13.7 |
| Sep-09 | 13 | 16.8 | 14.8 |
| Dec-09 | 12.8 | 17.5 | 15 |
| Mar-10 | 11.6 | 15.8 | 13.6 |
| Jun-10 | 12.3 | 16.2 | 14.2 |
| Sep-10 | 11.5 | 16.5 | 13.9 |
| Dec-10 | 11.6 | 16.5 | 14 |
| Mar-11 | 11.4 | 16.9 | 14 |
| Jun-11 | 12.1 | 16.3 | 14.1 |
| Sep-11 | 11.1 | 16.4 | 13.6 |
| Dec-11 | 12.1 | 15.5 | 13.7 |
| Mar-12 | 11.7 | 16.8 | 14.1 |
| Jun-12 | 11.9 | 17.8 | 14.7 |
| Sep-12 | 13.5 | 17.7 | 15.6 |
| Dec-12 | 12.4 | 17.3 | 14.7 |
| Mar-13 | 10.4 | 15.9 | 13 |
| Jun-13 | 10.6 | 16.2 | 13.3 |
| Sep-13 | 11.1 | 17.3 | 14.1 |
| Dec-13 | 11.1 | 17.1 | 14 |
| Mar-14 | 10.9 | 15.8 | 13.2 |
| Jun-14 | 10.5 | 16.4 | 13.3 |
| Sep-14 | 10.2 | 15.6 | 12.8 |
| Dec-14 | 10.5 | 16.4 | 13.3 |
| Mar-15 | 10.8 | 16.6 | 13.6 |
| Jun-15 | 10.6 | 16.9 | 13.6 |
| Sep-15 | 11.2 | 16.5 | 13.7 |
| Dec-15 | 10.1 | 15 | 12.5 |
| Mar-16 | 11.2 | 16.3 | 13.7 |
| Jun-16 | 10.5 | 15.9 | 13.1 |
| Sep-16 | 10 | 15.6 | 12.7 |
| Dec-16 | 9.7 | 15.4 | 12.4 |
| Mar-17 | 9.3 | 15.5 | 12.3 |
| Jun-17 | 9.5 | 14.7 | 12 |
| Sep-17 | 9.3 | 15.2 | 12.1 |
| Dec-17 | 9.4 | 15.3 | 12.2 |
| Mar-18 | 9.5 | 14.6 | 11.9 |
| Jun-18 | 9.9 | 14.5 | 12.1 |
| Sep-18 | 9.3 | 13.6 | 11.3 |
| Dec-18 | 10 | 14.6 | 12.2 |
| Mar-19 | 9 | 13.9 | 11.3 |
| Jun-19 | 9.2 | 13.2 | 11.1 |
| Sep-19 | 8.4 | 12.5 | 10.3 |
| Dec-19 | 8.4 | 12 | 10.1 |
| Mar-20 | 8.3 | 12.8 | 10.4 |
| Jun-20 | 9.4 | 15 | 12 |
| Sep-20 | 10.6 | 16 | 13.1 |
| Dec-20 | 9.7 | 14.4 | 11.9 |
| Mar-21 | 9.9 | 14.6 | 12.1 |
| Jun-21 | 8.2 | 12.9 | 10.5 |
| Sep-21 | 7.7 | 10.8 | 9.2 |
| Dec-21 | 7.4 | 11.2 | 9.2 |
| Mar-22 | 7.7 | 11.1 | 9.3 |
| Jun-22 | 7.5 | 11.1 | 9.2 |
| Sep-22 | 7.4 | 10.9 | 9.1 |
| Dec-22 | 7.5 | 11.4 | 9.4 |
| Mar-23 | 7.4 | 10.9 | 9.1 |
| Jun-23 | 8.1 | 11.7 | 9.8 |
More people in the labour force
In the year to the June 2023 quarter, the labour force participation rate reached 72.4 percent, the highest rate recorded since the Household Labour Force Survey (HLFS) began in 1986.
"People not in the labour force are those who are neither employed nor unemployed. These people could include retirees, students not engaged in the labour market, parents taking on full-time care of their tamariki, or those permanently unable to work due to illness or disability," Collett said.
In the year to the June 2023 quarter, the number of people not in the labour force decreased by 36,000 and the total labour force increased by 127,000.
In the year to the June 2023 quarter, the working-age population increased by 91,000. The working-age population includes all usually resident individuals aged 15 and over, irrespective of their current participation in the labour force.
Large annual employment growth
In the year to the June 2023 quarter, the number of people employed increased 113,000 (4.0 percent) to 2,927,000. The employment rate reached 69.8 percent, the highest rate recorded by the HLFS since the series began in 1986.
The employment rate for women increased to 65.4 percent, the highest rate since the series began. The employment rate for men increased to 74.4 percent, the highest rate since 1987.
| Quarter | Men | Women | Total |
| Mar-86 | 77.2 | 52 | 64.2 |
| Jun-86 | 76.8 | 51.9 | 64 |
| Sep-86 | 76.4 | 52.1 | 63.9 |
| Dec-86 | 75.6 | 51.9 | 63.4 |
| Mar-87 | 76.1 | 52.3 | 63.9 |
| Jun-87 | 75.4 | 52.4 | 63.6 |
| Sep-87 | 75.3 | 52.4 | 63.6 |
| Dec-87 | 74.4 | 52.5 | 63.2 |
| Mar-88 | 73.1 | 51.9 | 62.2 |
| Jun-88 | 72.2 | 51.3 | 61.5 |
| Sep-88 | 70.8 | 50.7 | 60.5 |
| Dec-88 | 70.6 | 50.6 | 60.3 |
| Mar-89 | 70 | 49.6 | 59.5 |
| Jun-89 | 69.1 | 48.9 | 58.7 |
| Sep-89 | 69 | 49.1 | 58.8 |
| Dec-89 | 69 | 49.2 | 58.8 |
| Mar-90 | 68.6 | 49.8 | 58.9 |
| Jun-90 | 68.3 | 50.6 | 59.2 |
| Sep-90 | 68 | 49.9 | 58.7 |
| Dec-90 | 67.4 | 49.5 | 58.2 |
| Mar-91 | 66.5 | 49.4 | 57.7 |
| Jun-91 | 65.9 | 49.2 | 57.3 |
| Sep-91 | 65.2 | 48.8 | 56.8 |
| Dec-91 | 64.7 | 48.6 | 56.4 |
| Mar-92 | 65.2 | 48.6 | 56.7 |
| Jun-92 | 65 | 49 | 56.8 |
| Sep-92 | 64.7 | 48.5 | 56.4 |
| Dec-92 | 64.6 | 48.8 | 56.5 |
| Mar-93 | 65.1 | 48.8 | 56.7 |
| Jun-93 | 65.5 | 48.6 | 56.8 |
| Sep-93 | 65.6 | 49.4 | 57.2 |
| Dec-93 | 66.1 | 49.6 | 57.6 |
| Mar-94 | 66.3 | 50.2 | 58 |
| Jun-94 | 67 | 50.3 | 58.4 |
| Sep-94 | 67.6 | 50.8 | 59 |
| Dec-94 | 67.9 | 51.7 | 59.6 |
| Mar-95 | 68.8 | 51.7 | 60 |
| Jun-95 | 69.3 | 52 | 60.4 |
| Sep-95 | 69.5 | 52.5 | 60.8 |
| Dec-95 | 69.8 | 52.6 | 61 |
| Mar-96 | 69.7 | 53.1 | 61.2 |
| Jun-96 | 69.8 | 53.8 | 61.6 |
| Sep-96 | 70 | 54.1 | 61.8 |
| Dec-96 | 69.7 | 53.3 | 61.2 |
| Mar-97 | 69.3 | 53.2 | 61.1 |
| Jun-97 | 69.4 | 53.4 | 61.2 |
| Sep-97 | 69.2 | 53.1 | 61 |
| Dec-97 | 69 | 52.8 | 60.7 |
| Mar-98 | 68.6 | 52.8 | 60.4 |
| Jun-98 | 68 | 52.5 | 60 |
| Sep-98 | 67.5 | 52.7 | 59.9 |
| Dec-98 | 67.2 | 52.5 | 59.6 |
| Mar-99 | 67.6 | 53.3 | 60.3 |
| Jun-99 | 67.8 | 53.4 | 60.4 |
| Sep-99 | 68 | 53.4 | 60.5 |
| Dec-99 | 68.9 | 53.6 | 61 |
| Mar-00 | 68.6 | 53.7 | 60.9 |
| Jun-00 | 68.7 | 53.4 | 60.8 |
| Sep-00 | 69.1 | 54.2 | 61.4 |
| Dec-00 | 69.4 | 54.6 | 61.8 |
| Mar-01 | 69.4 | 54.6 | 61.8 |
| Jun-01 | 69.5 | 55.4 | 62.2 |
| Sep-01 | 70 | 54.8 | 62.2 |
| Dec-01 | 70 | 55.7 | 62.6 |
| Mar-02 | 71.1 | 55.7 | 63.1 |
| Jun-02 | 70.8 | 56 | 63.2 |
| Sep-02 | 70.5 | 55.6 | 62.8 |
| Dec-02 | 70.4 | 55.8 | 62.9 |
| Mar-03 | 70.4 | 55.7 | 62.8 |
| Jun-03 | 70.4 | 56 | 63 |
| Sep-03 | 70.7 | 56.8 | 63.5 |
| Dec-03 | 70.4 | 56.6 | 63.3 |
| Mar-04 | 71 | 56.6 | 63.6 |
| Jun-04 | 71.9 | 56.2 | 63.8 |
| Sep-04 | 71.9 | 57.3 | 64.4 |
| Dec-04 | 72.5 | 58.2 | 65.1 |
| Mar-05 | 72.2 | 57.9 | 64.8 |
| Jun-05 | 72 | 58.2 | 64.8 |
| Sep-05 | 72.7 | 58.7 | 65.5 |
| Dec-05 | 72.7 | 58.3 | 65.3 |
| Mar-06 | 72.8 | 58.9 | 65.6 |
| Jun-06 | 73 | 59.2 | 65.9 |
| Sep-06 | 72.8 | 58.6 | 65.5 |
| Dec-06 | 72.9 | 58.2 | 65.3 |
| Mar-07 | 72.9 | 59.2 | 65.8 |
| Jun-07 | 73 | 59.5 | 66 |
| Sep-07 | 73.2 | 58.7 | 65.7 |
| Dec-07 | 72.8 | 59.8 | 66.1 |
| Mar-08 | 72.6 | 59.5 | 65.8 |
| Jun-08 | 72.3 | 59.6 | 65.7 |
| Sep-08 | 71.8 | 59.8 | 65.6 |
| Dec-08 | 72.4 | 59.9 | 65.9 |
| Mar-09 | 70.6 | 58.8 | 64.5 |
| Jun-09 | 70.8 | 58.3 | 64.3 |
| Sep-09 | 69.2 | 58.2 | 63.5 |
| Dec-09 | 69.3 | 57.8 | 63.3 |
| Mar-10 | 69.6 | 57.6 | 63.4 |
| Jun-10 | 69.3 | 57.7 | 63.3 |
| Sep-10 | 70.3 | 57.6 | 63.7 |
| Dec-10 | 69.4 | 57.5 | 63.3 |
| Mar-11 | 69.9 | 58.1 | 63.8 |
| Jun-11 | 69.7 | 58.4 | 63.8 |
| Sep-11 | 70.1 | 58 | 63.9 |
| Dec-11 | 69.6 | 58.1 | 63.7 |
| Mar-12 | 69.8 | 58.1 | 63.7 |
| Jun-12 | 69.2 | 58.4 | 63.6 |
| Sep-12 | 68.7 | 58.3 | 63.3 |
| Dec-12 | 68.7 | 58.1 | 63.3 |
| Mar-13 | 68.9 | 58.1 | 63.3 |
| Jun-13 | 69.1 | 58.1 | 63.4 |
| Sep-13 | 69.9 | 58.8 | 64.1 |
| Dec-13 | 70.4 | 58.8 | 64.4 |
| Mar-14 | 70.6 | 59.3 | 64.8 |
| Jun-14 | 70.8 | 58.9 | 64.7 |
| Sep-14 | 70.6 | 59.6 | 64.9 |
| Dec-14 | 71 | 60.2 | 65.5 |
| Mar-15 | 71.2 | 60.2 | 65.5 |
| Jun-15 | 71.1 | 59.7 | 65.3 |
| Sep-15 | 70.1 | 59.2 | 64.5 |
| Dec-15 | 70.5 | 59.6 | 64.9 |
| Mar-16 | 70.7 | 60.2 | 65.3 |
| Jun-16 | 71.9 | 61.2 | 66.5 |
| Sep-16 | 72.4 | 61.1 | 66.6 |
| Dec-16 | 72.5 | 61.7 | 67 |
| Mar-17 | 73.2 | 61.8 | 67.4 |
| Jun-17 | 72.7 | 61.5 | 67 |
| Sep-17 | 73.5 | 62.4 | 67.8 |
| Dec-17 | 73.5 | 62.6 | 68 |
| Mar-18 | 73.4 | 62.8 | 68 |
| Jun-18 | 73.2 | 62.9 | 68 |
| Sep-18 | 73.2 | 63.4 | 68.2 |
| Dec-18 | 72.7 | 63.1 | 67.8 |
| Mar-19 | 72.5 | 62.9 | 67.6 |
| Jun-19 | 72.6 | 63.2 | 67.8 |
| Sep-19 | 72.6 | 62.9 | 67.7 |
| Dec-19 | 72.5 | 62.6 | 67.5 |
| Mar-20 | 72.8 | 62.8 | 67.7 |
| Jun-20 | 72.4 | 62.1 | 67.2 |
| Sep-20 | 71.7 | 61.2 | 66.4 |
| Dec-20 | 72 | 61.6 | 66.7 |
| Mar-21 | 72.1 | 62.3 | 67.2 |
| Jun-21 | 72.8 | 63.1 | 67.9 |
| Sep-21 | 73.1 | 64.4 | 68.7 |
| Dec-21 | 73.2 | 64.4 | 68.7 |
| Mar-22 | 73.3 | 64.1 | 68.6 |
| Jun-22 | 73.1 | 64.3 | 68.6 |
| Sep-22 | 73.8 | 64.8 | 69.3 |
| Dec-22 | 74 | 64.9 | 69.4 |
| Mar-23 | 74 | 65.2 | 69.6 |
| Jun-23 | 74.4 | 65.4 | 69.8 |
Employment in tourism-related industries returned to pre-COVID-19 levels in the June 2023 quarter, growing 27,200 (11.0 percent) annually to 275,300 (not seasonally adjusted).
As measured by the HLFS, approximately 9.5 percent of employed people worked in key tourism-related industries in the June 2023 quarter.
"Despite its small size, a quarter of all annual employment growth was recorded in key tourism-related industries," Collett said.
"Tourism-related industries can include accommodation, passenger transport, travel agencies, sightseeing operators, and cafes and restaurants."
Fewer women working in tourism industries has technical notes on HLFS key tourism industries.
Annual wage cost inflation at 4.3 percent
In the year to the June 2023 quarter, all salary and wage rates (including overtime), as measured by the labour cost index, remained at 4.3 percent.
Average ordinary time hourly earnings in the Quarterly Employment Survey (QES) increased 6.9 percent in the year to the June 2023 quarter.
Average total weekly earnings (including overtime) per full-time equivalent employee, as measured by the QES, rose 6.4 percent in the year to the June 2023 quarter.
Annual wage cost inflation remains at 4.3 percent has more information about wages.
Text alternative for total underutilisation, June 2023 quarter, seasonally adjusted diagram
Diagram shows data from June 2023 quarter's Household Labour Force Survey (HLFS).
The underutilisation rate was up 0.8pp (percentage points), to 9.8 percent. This rate is derived from total underutilised divided by the extended labour force. The unemployment rate was up 0.2pp, to 3.6 percent. This is derived from unemployed divided by labour force.
Total underutilised was up 28,000, to 308,000. Underemployed was up 13,000 to 105,000. Unemployed was up 6,000 to 109,000. The potential labour force was up 9,000 to 94,000.
Within the potential labour force, available potential jobseekers were up 5,500 to 67,600 and unavailable jobseekers were up 3,000 to 26,000.
Notes:
- No seasonal pattern is evident for available potential jobseekers. Therefore, this series is not seasonally adjusted.
- Due to rounding, changes do not always sum to the published totals.
- All changes are quarterly.
Source: Stats NZ, Household Labour Force Survey


