Solid start to the year with EBITDA growth at the top-end of our outlook, continued margin expansion and high-single digit Underlying EPS growth
BRUSSELS--BUSINESS WIRE--
Anheuser-Busch InBev (Brussel:ABI) (BMV:ANB) (JSE:ANH) (NYSE:BUD):
This press release features multimedia. View the full release here: https://www.businesswire.com/news/home/20250507671244/en/
AB InBev Strategic Priorities
Regulated information1
"Beer is a passion point for consumers. The strength of the beer category and the continued momentum of our megabrands delivered another quarter of profitable growth. EBITDA increased at the top-end of our outlook and the ongoing optimization of our business drove Underlying EPS growth of 7.1%. The consistent execution of our strategy by our teams and partners drove a solid start to the year and reinforces our confidence in delivering on our outlook for 2025." - Michel Doukeris, CEO, AB InBev
Revenue +1.5% Revenue increased by 1.5% with revenue per hl growth of 3.7%. Reported revenue decreased by 6.3% to 13 628 million USD, impacted by unfavorable currency translation. 4.4% increase in combined revenues of our megabrands, led by Corona, which grew by 11.2% outside of its home market in 1Q25. 34% increase in revenue of our no-alcohol beer portfolio. 53% increase in Gross Merchandise Value (GMV) from sales of third-party products through BEES Marketplace to reach 645 million USD. Volumes -2.2% Volumes declined by 2.2%, with beer volumes down by 2.5% and non-beer volumes down by 0.2%. |
Normalized EBITDA +7.9% In 1Q25, Normalized EBITDA increased by 7.9% to 4 855 million USD with a margin expansion of 218bps to 35.6%. Underlying Profit 1 606 million USD Underlying Profit was 1 606 million USD in 1Q25 compared to 1 509 million USD in 1Q24. Reported profit attributable to equity holders of AB InBev was 2 148 million USD in 1Q25 compared to 1 091 million USD in 1Q24, positively impacted by non-underlying items. Underlying EPS 0.81 USD Underlying EPS increased by 7.1% to 0.81 USD. On a constant currency basis, Underlying EPS increased by 20.2%. |
1The enclosed information constitutes regulated information as defined in the Belgian Royal Decree of 14 November 2007 regarding the duties of issuers of financial instruments which have been admitted for trading on a regulated market. For important disclaimers and notes on the basis of preparation, please refer to page 12. |
Management comments
Solid start to the year with EBITDA growth at the top-end of our outlook, continued margin expansion and high-single digit Underlying EPS growth
Our business delivered another quarter of solid financial performance in 1Q25. EBITDA increased by 7.9% with margin expansion of 218bps driven by top-line growth, cost of sales tailwinds and disciplined overhead management. Underlying EPS was 0.81 USD, a 7.1% increase in USD and a 20.2% increase in constant currency versus 1Q24, driven by 10.3% EBIT growth and the continued optimization of our net finance costs.
Top-line increased by 1.5%, with revenue growth in approximately 50% of our markets, driven by a revenue per hl increase of 3.7% as a result of disciplined revenue management choices and ongoing premiumization. We increased our overall portfolio brand power driven by increased marketing investment and effectiveness. In addition, we estimate that we gained or maintained market share in 60% of our markets. Volume performance was, however, impacted by calendar-related factors such as cycling the leap year selling-day benefit in 1Q24 and Easter shipment phasing, resulting in a decline of 2.2%.
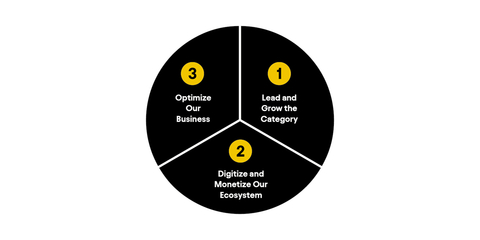
Progressing our strategic priorities
We continue to execute on and invest in three key strategic pillars to deliver consistent growth and long-term value creation.
(1) Lead and grow the category:
We increased our overall portfolio brand power driven by increased marketing investment and effectiveness. In addition, we estimate that we gained or maintained market share in 60% of our markets.
(2) Digitize and monetize our ecosystem:
BEES Marketplace captured 645 million USD in GMV from sales of third-party products, a 53% increase versus 1Q24. Overall BEES GMV increased by 10%, reaching 11.6 billion USD.
(3) Optimize our business:
Underlying EPS was 0.81 USD, a 7.1% increase in USD and a 20.2% increase in constant currency terms versus 1Q24, driven by 10.3% EBIT growth and the continued optimization of our net finance costs.
(1) Lead and grow the category
We are executing on our five replicable levers to drive category growth. Our performance across each of the levers was led by our megabrands which delivered a 4.4% revenue increase.
- Category Participation: Investments in our megabrands and innovations drove an estimated increase of 60 basis points in the percentage of legal drinking age consumers purchasing our portfolio across our key markets, the equivalent of 6 million new consumers on an annualized basis. Participation increases were driven by our megabrands and no-alcohol beer portfolio.
- Core Superiority:Revenue of our mainstream portfolio increased by 0.3%, driven by double-digit growth in South Korea and mid-single digit growth in Colombia and Mexico.
- Balanced Choices: Our balanced choices portfolio of low carb, sugar free, gluten free and no- and low-alcohol beer brands delivered a revenue increase of 2.7%. Growth was led by our no-alcohol beer portfolio which delivered a 34% revenue increase and is estimated to have gained share of no-alcohol beer across our footprint, led by Corona Cero which grew volume by triple-digits.
- Premiumization:Our above core beer portfolio delivered a 1.8% revenue increase. Corona led our performance, increasing revenue by 11.2% outside of Mexico with double-digit volume growth in more than 30 markets.
- Beyond Beer:Growth of our Beyond Beer portfolio accelerated in 1Q25, increasing revenue by 16.6%, led by double-digit growth of Cutwater and Nütrl in the US and Beats in Brazil.
(2) Digitize and monetize our ecosystem
- Digitizing our relationships with more than 6 million customers globally: As of 31 March 2025, BEES was live in 28 markets with 72% of our revenues captured through B2B digital platforms. In 1Q25,BEES captured 11.6 billion USD in GMV, growth of 10% versus 1Q24.
- Monetizing our route-to-market: BEES Marketplace generated 10 million orders and captured 645 million USD in GMV from sales of third-party products, growth of 27% and 53% versus 1Q24, respectively.
- Leading the way in DTC solutions: Our omnichannel DTC ecosystem of digital and physical products generated revenue of approximately 275 million USD. Our DTC megabrands, Zé Delivery, TaDa Delivery and PerfectDraft, generated 19.2 million e-commerce orders and delivered 117 million USD in revenue this quarter, representing 12% growth versus 1Q24.
(3) Optimize our business
- Maximizing value creation:EBITDA grew by 7.9% with margin expansion of 218bps supported by disciplined resource allocation and overhead management. Optimization of our net capex drove increased efficiency in depreciation and amortization expenses, resulting in 10.3% EBIT growth. As of 5 May 2025, we have completed 70% of our 2 billion USD share buyback program announced on 31 October 2024.
- Advancing our sustainability priorities: In Climate Action, our Scopes 1 and 2 emissions per hectoliter of production was 4.44 kgCO2e/hl in 1Q25, a reduction of 45.7% against the 2017 baseline. In Water Stewardship, our water use efficiency ratio improved to 2.44 hl per hl in 1Q25 versus 2.55 hl per hl in 1Q24, as we continue working towards our ambition to reach 2.50 hl per hl on an annual basis by the end of 2025.
Delivering reliable compounding growth
We are encouraged by our results to start the year, the resilience of the beer category and the consistent execution of our strategy by our teams and partners. Our business is local, with more than 98% of our volume locally produced, and our footprint has structural tailwinds for long-term volume growth with favorable demographics, ongoing economic development and opportunities to increase category participation. Our consistent performance and the fundamental strengths of our business reinforce our confidence in our ability to deliver reliable compounding growth and create a future with more cheers.
2025 Outlook
(i) Overall Performance: We expect our EBITDA to grow in line with our medium-term outlook of between 4-8%. The outlook for FY25 reflects our current assessment of inflation and other macroeconomic conditions.
(ii) Net Finance Costs: Net pension interest expenses and accretion expenses are expected to be in the range of 190 to 220 million USD per quarter, depending on currency and interest rate fluctuations. We expect the average gross debt coupon in FY25 to be approximately 4%.
(iii) Effective Tax Rate (ETR): We expect the normalized ETR in FY25 to be in the range of 26% to 28%. The ETR outlook does not consider the impact of potential future changes in legislation.
(iv) Net Capital Expenditure: We expect net capital expenditure of between 3.5 and 4.0 billion USD in FY25.
Figure 1. Consolidated performance |
|||||||
in USD Mio, except EPS in USD per share and Volumes in thousand hls |
1Q24 |
1Q25 |
Organic |
||||
growth |
|||||||
Volumes |
139 536 |
136 268 |
(2.2 |
)% |
|||
Beer |
119 683 |
116 778 |
(2.5 |
)% |
|||
Non-Beer |
19 852 |
19 490 |
(0.2 |
)% |
|||
Revenue |
14 547 |
13 628 |
1.5 |
% |
|||
Gross profit |
7 894 |
7 583 |
5.2 |
% |
|||
Gross margin |
54.3% |
55.6% |
203bps |
||||
Normalized EBITDA |
4 987 |
4 855 |
7.9 |
% |
|||
Normalized EBITDA margin |
34.3% |
35.6% |
218bps |
||||
Normalized EBIT |
3 642 |
3 587 |
10.3 |
% |
|||
Normalized EBIT margin |
25.0% |
26.3% |
218bps |
||||
Profit attributable to equity holders of AB InBev |
1 091 |
2 148 |
|||||
Underlying Profit |
1 509 |
1 606 |
|||||
Basic EPS |
0.54 |
1.08 |
|||||
Underlying EPS |
0.75 |
0.81 |
|||||
Figure 2. Volumes |
||||||||||||||||
in thousand hls |
1Q24 |
Scope |
Organic growth |
1Q25 |
Organic growth |
|||||||||||
Total |
Beer |
|||||||||||||||
North America |
21 353 |
(144 |
) |
(1 368 |
) |
19 842 |
(6.4 |
)% |
(6.4 |
)% |
||||||
Middle Americas |
35 690 |
- |
(610 |
) |
35 081 |
(1.7 |
)% |
(1.5 |
)% |
|||||||
South America |
40 347 |
- |
544 |
40 891 |
1.3 |
% |
1.4 |
% |
||||||||
EMEA |
21 030 |
(35 |
) |
(243 |
) |
20 752 |
(1.2 |
)% |
(1.8 |
)% |
||||||
Asia Pacific |
21 045 |
(93 |
) |
(1 304 |
) |
19 648 |
(6.2 |
)% |
(6.2 |
)% |
||||||
Global Export and Holding Companies |
70 |
(3 |
) |
(13 |
) |
54 |
(19.2 |
)% |
(19.2 |
)% |
||||||
AB InBev Worldwide |
139 536 |
(274 |
) |
(2 993 |
) |
136 268 |
(2.2 |
)% |
(2.5 |
)% |
||||||
Key Markets Performance
United States: Michelob Ultra growth drove continued market share gain
- Operating performance: Revenue declined by 5.1% with revenue per hl increasing by 1.7% driven by revenue management initiatives and premiumization. Sales-to-retailers decreased by 5.4%, estimated to have outperformed the industry which was negatively impacted by adverse weather and Easter shipment phasing. Sales-to-wholesalers (STWs) declined by 6.7%, impacted by one less selling day versus 1Q24. EBITDA declined by 1.7% as top-line performance was partially offset by productivity initiatives and SG&A efficiencies while we continued to increase marketing investments.
- Commercial highlights: Our portfolio is estimated to have gained market share of the beer industry and the spirits-based ready-to-drink (RTD) category, according to Circana. Our beer portfolio was led by Michelob Ultra and Busch Light, which were the #1 and #2 volume share gainers in the industry respectively, while our RTD portfolio delivered strong double-digit volume growth, led by Cutwater and Nütrl. We are the leader in no-alcohol beer, with our portfolio growing volumes in the high-twenties, driven by Michelob Ultra Zero which was the #1 innovation in the beer industry in 1Q25. The beer category in 1Q25 was impacted by adverse weather and calendar-related factors but trends have improved in April, according to Circana, as weather patterns normalized.
Mexico: Revenue growth and margin expansion drove double-digit bottom-line growth
- Operating performance: Revenue increased by mid-single digits, with mid-single digit revenue per hl growth driven by revenue management initiatives. Volumes declined by low-single digits, in-line with the industry, which was negatively impacted by calendar-related factors. EBITDA grew by mid-teens with margin expansion.
- Commercial highlights: Our performance was led by our above core beer portfolio, which grew revenue by high-single digits driven by Modelo, while our core beer brands delivered mid-single digit revenue growth. We are leading the growth in no-alcohol beer with Corona Cero growing volume by strong double-digits. We continued to progress our digital initiatives, with BEES Marketplace growing GMV by 42% versus 1Q24 and our digital DTC platform, TaDa Delivery, increasing the number of orders by 18%.
Colombia: Record high volumes drove double-digit bottom-line growth
- Operating performance: Revenue increased by high-single digits with mid-single digit revenue per hl growth, driven by revenue management initiatives. Volumes grew by low-single digits, with our portfolio maintaining share of total alcohol. EBITDA grew by low-teens with margin expansion.
- Commercial highlights: Our above core beer brands led our performance, delivering high-single digit volume growth and driving record high first quarter volumes. Our core beer portfolio delivered a low-single digit volume increase driven by the continued growth of Aguila.
Brazil: Continued momentum drove double-digit bottom-line growth with margin expansion and all-time high volumes
- Operating performance: Revenue grew by 4.6% with revenue per hl growth of 3.1% driven by premiumization and revenue management initiatives. Total volumes grew by 1.4%, with beer volume increasing by 0.8%. Non-beer volumes grew by 3.2%. EBITDA increased by 13.5% with margin expansion of 278bps.
- Commercial highlights: Our premium and super premium beer brands led our performance, delivering low-twenties volume growth, driven by Stella Artois and Corona. We are the leader in no-alcohol beer, with our volumes growing by strong double-digits, led by Brahma 0.0 and Corona Cero. Non-beer performance was driven by our low- and no-sugar portfolio, which grew volumes in the low-twenties.We continued to progress our digital initiatives, with BEES Marketplace growing GMV by 92%, and our digital DTC platform, Zé Delivery, generating nearly 17 million orders this quarter, a 5% increase versus 1Q24.
Europe: Continued premiumization and margin recovery drove double-digit bottom-line growth
- Operating performance: Revenue declined by low-single digits with low-single digit revenue per hl growth driven by continued premiumization. Volumes declined by low-single digits, estimated to be in-line with or outperforming the industry in the majority of our key markets, which was negatively impacted by calendar-related factors. EBITDA grew by low-teens with margin recovery.
- Commercial highlights: We continued to premiumize our portfolio, with our premium and super premium portfolio making up 60% of our 1Q25 revenue. Our performance was driven by our megabrands, with Corona and Stella Artois growing volumes by low-single digits. Our no-alcohol beer portfolio grew volumes by high-teens, led by Corona Cero which delivered strong double-digit volume growth. In the UK, as of January 2025, we have strengthened our portfolio with the addition of the San Miguel brand and are now the leading brewer in the industry.
South Africa: Continued momentum and market share gain delivered another quarter of top- and bottom-line growth
- Operating performance: Revenue increased by low-single digits with revenue per hl growth of low-single digits. Volumes declined by low-single digits, estimated to have outperformed the industry which was negatively impacted by calendar-related factors. EBITDA grew by low-single digits.
- Commercial highlights: The momentum of our business continued, with the consistent execution of our strategy driving estimated market share gains in both beer and Beyond Beer. Our performance was led by our premium and super premium brands, which grew volumes by low-teens driven by Corona and Stella Artois. In Beyond Beer, our portfolio grew volumes by mid-single digits.
China: Performance impacted by soft industry in our footprint
- Operating performance: Volumes declined by 9.2%, underperforming the industry according to our estimates, with our performance impacted by continued industry weakness in our key regions and the on-premise channel, and inventory management, which accounted for approximately one quarter of our volume decline. Revenue per hl decreased by 3.9%, driven by negative geographic and channel mix, resulting in a revenue decline of 12.7%. EBITDA declined by 15.2%.
- Commercial highlights: We remain confident in our strategy, centered on premiumization, channel and geographic expansion, and digital transformation. We are strengthening our execution, increasing investments in our megabrands and accelerating our in-home channel expansion. In 1Q25, our marketing campaigns included extensive Chinese New Year activations and updated brand imagery for Budweiser, and a new integrated campaign for Harbin Zero Sugar with the NBA. The usage and reach of the BEES platform continued to expand and, as of March 2025, is present in more than 320 cities.
Highlights from our other markets
- Canada: Revenue declined by low-single digits with low-single digit revenue per hl growth. Volumes declined by mid-single digits, outperforming a soft industry according to our estimates, which was negatively impacted by adverse weather and calendar-related factors. Michelob Ultra and Busch continued to outperform and were the #1 and #2 volume share gainers in the industry.
- Peru: Revenue grew by low-single digits, with mid-single digit revenue per hl growth driven by revenue management initiatives. Volumes declined by low-single digits, estimated to be in-line with the industry, which was negatively impacted by calendar-related factors.
- Ecuador: Revenue declined by mid-single digits with volumes declining by mid-single digits as the industry was impacted by calendar-related factors, three fewer trading days due to election related dry laws, and cycled a strong performance in 1Q24 which benefitted from shipment phasing ahead of a sales tax increase.
- Argentina: Volume trends improved sequentially, declining by mid-single digits, with beer volumes estimated to be in-line with the industry, as overall consumer demand continued to be impacted by inflationary pressures. Since 1Q24, the definition of organic revenue growth in Argentina has been amended to cap the price growth to a maximum of 2% per month. Revenue grew by low-twenties on this basis.
- Africa excluding South Africa: In Nigeria, revenue grew by strong double-digits, driven by revenue management initiatives in a highly inflationary environment. Beer volumes declined by mid-single digits as our performance was impacted by production constraints. In our other markets in Africa, we grew volume in aggregate by mid-single digits, driven by Mozambique and Tanzania.
- South Korea: Revenue increased by low-teens with flattish revenue per hl. Volumes grew by low-teens, estimated to have outperformed the industry in both the on-trade and in-home channels. Our performance was led by our core portfolio and innovations, with volumes supported by shipment phasing ahead of an announced April price increase.
Consolidated Income Statement
Figure 3. Consolidated income statement |
|||||||||
in USD Mio |
1Q24 |
1Q25 |
Organic |
||||||
growth |
|||||||||
Revenue |
14 547 |
13 628 |
1.5 |
% |
|||||
Cost of sales |
(6 653 |
) |
(6 044 |
) |
3.1 |
% |
|||
Gross profit |
7 894 |
7 583 |
5.2 |
% |
|||||
SG&A |
(4 435 |
) |
(4 188 |
) |
(1.3 |
)% |
|||
Other operating income/(expenses) |
183 |
192 |
9.1 |
% |
|||||
Normalized EBIT |
3 642 |
3 587 |
10.3 |
% |
|||||
Non-underlying items above EBIT |
(29 |
) |
(49 |
) |
|||||
Net finance income/(cost) |
(1 187 |
) |
(984 |
) |
|||||
Non-underlying net finance income/(cost) |
(309 |
) |
602 |
||||||


