International migration has become the main driver of population growth in Auckland, with 2 in 5 Aucklanders now born overseas.
"The Auckland population has doubled in size since the early 1980s, reaching 1.82 million in June 2025," population estimates and projections spokesperson Clare Hendra said.
"The population is projected to reach 2 million people in 2033, though this milestone could be reached earlier or later, depending on levels of migration."
By 2053, the population living in Auckland could number between 2.2 million and 2.7 million.
| Year | Census usually resident population count |
| 1996 | 1069710 |
| 1997 | |
| 1998 | |
| 1999 | |
| 2000 | |
| 2001 | 1160271 |
| 2002 | |
| 2003 | |
| 2004 | |
| 2005 | |
| 2006 | 1304958 |
| 2007 | |
| 2008 | |
| 2009 | |
| 2010 | |
| 2011 | |
| 2012 | |
| 2013 | 1415550 |
| 2014 | |
| 2015 | |
| 2016 | |
| 2017 | |
| 2018 | 1571718 |
| 2019 | |
| 2020 | |
| 2021 | |
| 2022 | |
| 2023 | 1656486 |
| Year | Estimated resident population |
| 1996 | 1115800 |
| 1997 | 1146700 |
| 1998 | 1169000 |
| 1999 | 1184800 |
| 2000 | 1201500 |
| 2001 | 1218300 |
| 2002 | 1255800 |
| 2003 | 1297600 |
| 2004 | 1326000 |
| 2005 | 1348900 |
| 2006 | 1373000 |
| 2007 | 1390400 |
| 2008 | 1405500 |
| 2009 | 1421700 |
| 2010 | 1439600 |
| 2011 | 1459600 |
| 2012 | 1476500 |
| 2013 | 1493200 |
| 2014 | 1520400 |
| 2015 | 1552800 |
| 2016 | 1589800 |
| 2017 | 1625100 |
| 2018 | 1654800 |
| 2019 | 1680500 |
| 2020 | 1712000 |
| 2021 | 1704000 |
| 2022 | 1694400 |
| 2023 | 1755200 |
| 2024 | 1798300 |
| 2025 | 1816000 |
| Year | Low projection |
| 1996 | |
| 1997 | |
| 1998 | |
| 1999 | |
| 2000 | |
| 2001 | |
| 2002 | |
| 2003 | |
| 2004 | |
| 2005 | |
| 2006 | |
| 2007 | |
| 2008 | |
| 2009 | |
| 2010 | |
| 2011 | |
| 2012 | |
| 2013 | |
| 2014 | |
| 2015 | |
| 2016 | |
| 2017 | |
| 2018 | |
| 2019 | |
| 2020 | |
| 2021 | |
| 2022 | |
| 2023 | |
| 2024 | |
| 2025 | |
| 2026 | |
| 2027 | |
| 2028 | 1842500 |
| 2029 | |
| 2030 | |
| 2031 | |
| 2032 | |
| 2033 | 1917400 |
| 2034 | |
| 2035 | |
| 2036 | |
| 2037 | |
| 2038 | 1988800 |
| 2039 | |
| 2040 | |
| 2041 | |
| 2042 | |
| 2043 | 2055900 |
| 2044 | |
| 2045 | |
| 2046 | |
| 2047 | |
| 2048 | 2113700 |
| 2049 | |
| 2050 | |
| 2051 | |
| 2052 | |
| 2053 | 2161700 |
| Year | Medium projection |
| 1996 | |
| 1997 | |
| 1998 | |
| 1999 | |
| 2000 | |
| 2001 | |
| 2002 | |
| 2003 | |
| 2004 | |
| 2005 | |
| 2006 | |
| 2007 | |
| 2008 | |
| 2009 | |
| 2010 | |
| 2011 | |
| 2012 | |
| 2013 | |
| 2014 | |
| 2015 | |
| 2016 | |
| 2017 | |
| 2018 | |
| 2019 | |
| 2020 | |
| 2021 | |
| 2022 | |
| 2023 | |
| 2024 | |
| 2025 | |
| 2026 | |
| 2027 | |
| 2028 | 1886100 |
| 2029 | |
| 2030 | |
| 2031 | |
| 2032 | |
| 2033 | 2003800 |
| 2034 | |
| 2035 | |
| 2036 | |
| 2037 | |
| 2038 | 2119300 |
| 2039 | |
| 2040 | |
| 2041 | |
| 2042 | |
| 2043 | 2232900 |
| 2044 | |
| 2045 | |
| 2046 | |
| 2047 | |
| 2048 | 2342500 |
| 2049 | |
| 2050 | |
| 2051 | |
| 2052 | |
| 2053 | 2444800 |
| Year | High projection |
| 1996 | |
| 1997 | |
| 1998 | |
| 1999 | |
| 2000 | |
| 2001 | |
| 2002 | |
| 2003 | |
| 2004 | |
| 2005 | |
| 2006 | |
| 2007 | |
| 2008 | |
| 2009 | |
| 2010 | |
| 2011 | |
| 2012 | |
| 2013 | |
| 2014 | |
| 2015 | |
| 2016 | |
| 2017 | |
| 2018 | |
| 2019 | |
| 2020 | |
| 2021 | |
| 2022 | |
| 2023 | |
| 2024 | |
| 2025 | |
| 2026 | |
| 2027 | |
| 2028 | 1930900 |
| 2029 | |
| 2030 | |
| 2031 | |
| 2032 | |
| 2033 | 2090600 |
| 2034 | |
| 2035 | |
| 2036 | |
| 2037 | |
| 2038 | 2251200 |
| 2039 | |
| 2040 | |
| 2041 | |
| 2042 | |
| 2043 | 2412500 |
| 2044 | |
| 2045 | |
| 2046 | |
| 2047 | |
| 2048 | 2570200 |
| 2049 | |
| 2050 | |
| 2051 | |
| 2052 | |
| 2053 | 2723900 |
The Auckland population grew by an average of 1.7 percent a year between 2000 and 2025. Over the same period, the rest of New Zealand's population grew by an average of 1.1 percent a year.
"Future population growth in Auckland is unlikely to be as fast because of population ageing, though Auckland is still projected to account for 40 to 50 percent of New Zealand's total population growth over the next few decades," Hendra said.
Variation in population growth across Auckland
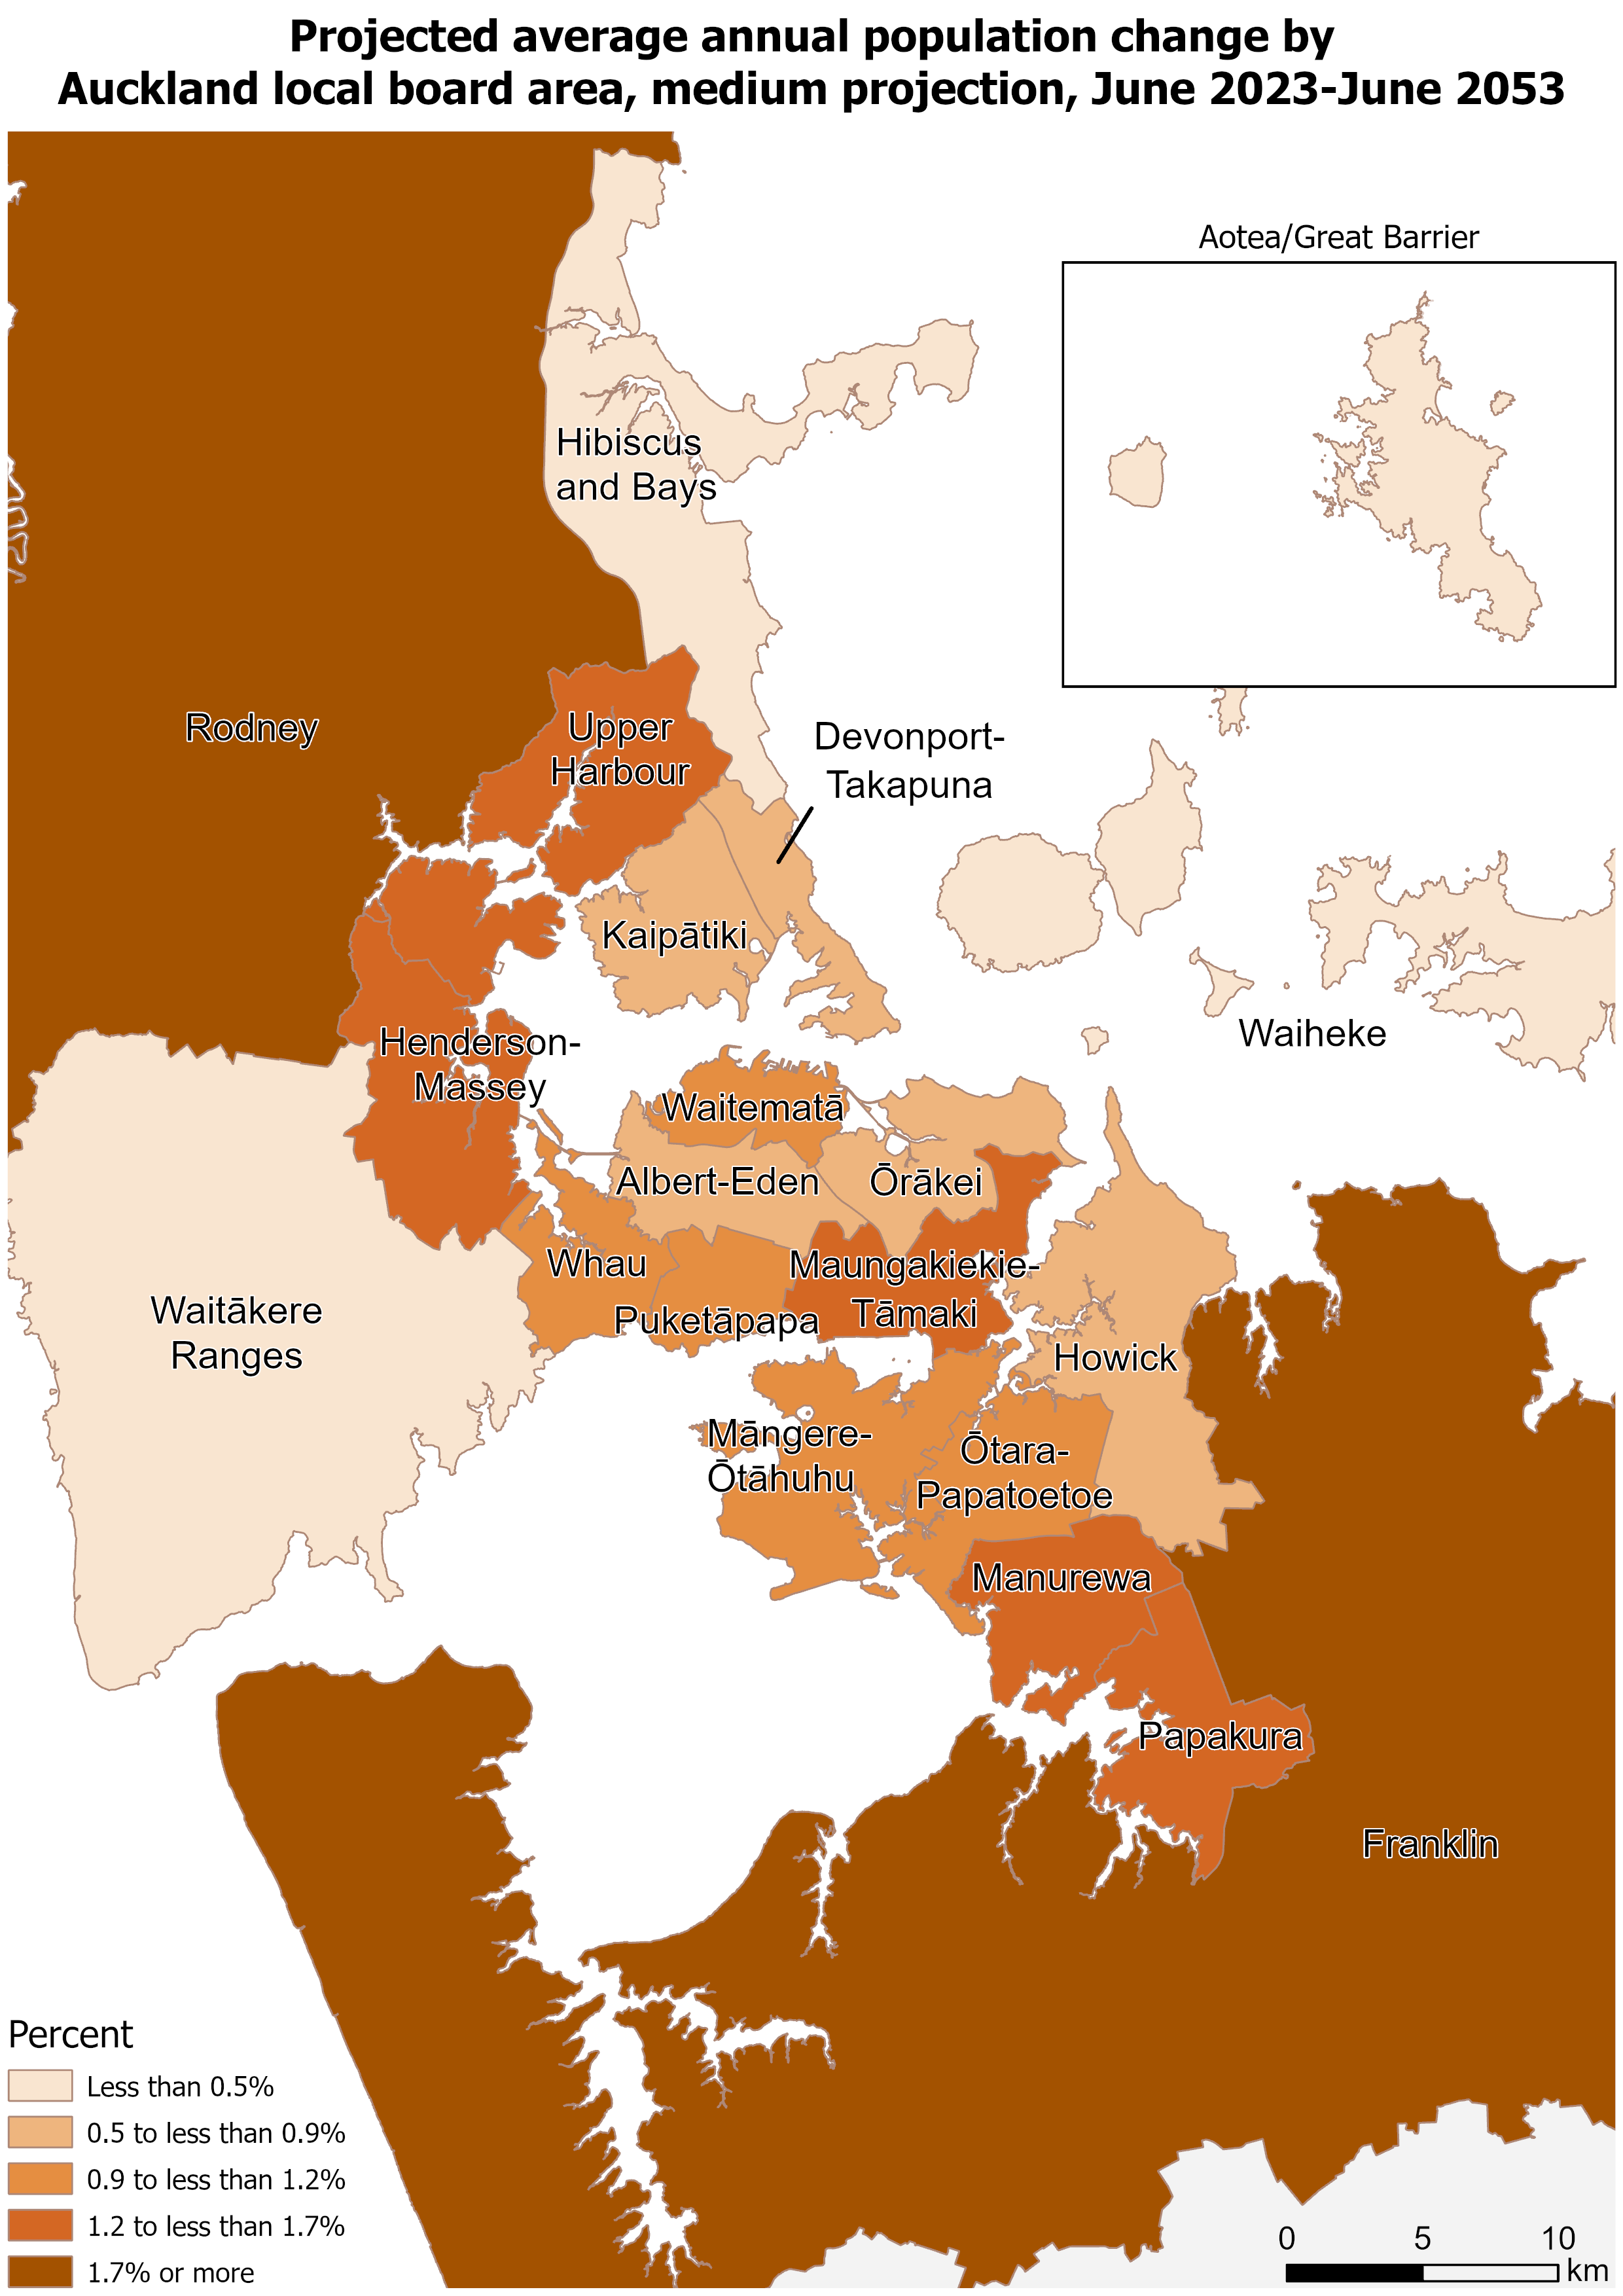
The population of all Auckland local board areas is projected to increase between 2023 and 2053.
Franklin local board area is projected to have the largest population growth in the region, up by 77,200 people to 165,100 in 2053 (medium projection). Franklin is also projected to grow the fastest, with the population expected to increase by an average of 2.1 percent a year over the 30-year projection period.
Populations in Rodney, Papakura, and Upper Harbour local board areas are also expected to grow much faster than the overall Auckland average of 1.1 percent a year.

Population projections are an information tool to assist planning, based on demographic trends and current policy settings. Projections are regularly updated to reflect changes in demographic trends and policies.
International migration driving population growth across the region
Auckland's net migration has fluctuated. Auckland had an average net migration gain of 7,900 people a year in the five-year period of 2019-2023, down from 18,600 a year in the 2014-2018 period. The lower gain in 2019-2023 included two years of unusual international migration loss in 2021 and 2022, when the COVID-19 pandemic affected international travel and migration.
Net migration is the difference between migrant arrivals and migrant departures, and includes both international and internal (within New Zealand) migration. Patterns of migration are influenced by economic, policy, environmental, and social factors.
In contrast, natural increase in the Auckland region has been decreasing since the 2007-2013 period and is likely to continue decreasing over the next 30 years. Natural increase is the difference between the number of live births and the number of deaths in an area. Declining natural increase is happening across the country and is largely due to New Zealand's ageing population. In Auckland's case, the projected decline in natural increase reflects more deaths rather than fewer births.
| Period ended June | Net migration | Natural increase |
| 1982-1986 | 3900 | 6600 |
| 1987-1991 | 4300 | 9700 |
| 1992-1996 | 13700 | 11300 |
| 1997-2001 | 8300 | 12200 |
| 2002-2006 | 17800 | 13100 |
| 2007-2013 | 1800 | 15300 |
| 2014-2018 | 18600 | 13700 |
| 2019-2023 | 7900 | 12200 |
| 2024-2028 | 15000 | 11200 |
| 2029-2033 | 13000 | 10500 |
| 2034-2038 | 13400 | 9700 |
| 2039-2043 | 13600 | 9100 |
| 2044-2048 | 13900 | 8000 |
| 2049-2053 | 14100 | 6300 |
Since the late 1990s, Auckland has experienced net internal migration loss, but this has been offset by net international migration gain. From 2019 to 2025, Auckland lost an average 8,900 people a year through net internal migration, but gained an average 19,800 people a year due to net international migration.
| Year ended June | Net international migration | Net internal migration |
| 2019 | 25000 | -12200 |
| 2020 | 31300 | -12800 |
| 2021 | -7900 | -13000 |
| 2022 | -9900 | -11700 |
| 2023 | 54100 | -4900 |
| 2024 | 36200 | -4200 |
| 2025 | 9500 | -3200 |
Migration out of Auckland
"Through much of the 20th century, Auckland gained people from other parts of New Zealand as part of the 'drift north'," Hendra said. "However, by the late 1990s, Auckland was losing more people to other parts of the country than it was gaining."
Between the 2018 and 2023 Censuses, more than 135,000 people moved from the Auckland region to another part of the country, with Waikato, Northland, and Canterbury regions the most popular destinations. While this was partly offset by people moving to Auckland from other areas of New Zealand - mainly from Waikato and Wellington - it resulted in a net internal migration loss of about 50,000 people over the five-year period.
| Period ended June | Arrivals | Departures | Net |
| 1976-1981 | 72255 | 52596 | 19662 |
| 1981-1986 | 65421 | 53688 | 11730 |
| 1986-1991 | 68460 | 62952 | 5505 |
| 1991-1996 | 69666 | 63852 | 5811 |
| 1996-2001 | 70959 | 72942 | -1983 |
| 2001-2006 | 64671 | 82740 | -18069 |
| 2008-2013 | 56931 | 61579 | -4648 |
| 2013-2018 | 57243 | 99120 | -41877 |
| 2018-2023 | 85062 | 136692 | -51630 |
Over 40 percent of Aucklanders born overseas
The 2023 Census showed that 43 percent of Auckland's population were born overseas, compared with 22 percent of the rest of New Zealand's population.
"The proportion of Aucklanders born overseas highlights the significant role that international migration plays in the region's population growth," Hendra said.
Just under half of Aucklanders born overseas were born in Asia (21 percent of the total Auckland population), with China (7 percent) and India (5 percent) the most common Asian countries of birth.
Outside of Asia, the Pacific Islands (8 percent) was the next most common overseas birthplace for Aucklanders.
| Year | Total overseas | Pacific Islands | Total Asia | China | India | Europe (including UK and Ireland) |
| 1996 | 28.5 | 6.9 | 7.1 | 1.2 | 0.7 | 10.6 |
| 2001 | 32.1 | 7.7 | 9.7 | 2.5 | 1.2 | 9.5 |
| 2006 | 37 | 8.1 | 13.5 | 4.4 | 2.5 | 9.3 |
| 2013 | 39.1 | 8.3 | 15.4 | 4.9 | 3.3 | 8.9 |
| 2018 | 41.6 | 7.8 | 19.1 | 6.2 | 4.6 | 7.9 |
| 2023 | 42.9 | 7.9 | 20.7 | 6.6 | 4.8 | 6.9 |
Three local board areas had more than half of their population born overseas in 2023: Howick (56 percent), Upper Harbour (53 percent), and Puketāpapa (53 percent). In contrast, the lowest proportions of overseas-born were in Aotea/Great Barrier (19 percent), Franklin (26 percent), and Rodney (27 percent).

More information
We have drawn together recently published population statistics to explain what is driving population growth in Auckland.
For more information about Auckland's population, and other populations throughout Aotearoa New Zealand see:
- Census Place and ethnic group summaries
- Subnational population estimates tables
- Subnational population projections tables
Text alternative for map, Projected average annual population change by Auckland local board area, medium projection, June 2023-June 2053
This map shows the projected average annual population change between June 2023 and June 2053 from the medium projection for each Auckland local board area.
Areas where the projected average annual population change is less than 0.5 percent are: Waiheke, Hibiscus and Bays, Waitākere Ranges, Aotea/Great Barrier.
Areas where the projected average annual population change is from 0.5 percent to less than 0.9 percent are: Devonport-Takapuna, Ōrākei, Kaipātiki, Albert-Eden, Howick.
Areas where the projected average annual population change is from 0.9 percent to less than 1.2 percent are: Waitematā, Puketāpapa, Māngere-Ōtāhuhu, Whau, Ōtara-Papatoetoe.
Areas where the projected average annual population change is from 1.2 percent to less than 1.7 percent are: Manurewa, Henderson-Massey, Maungakiekie-Tāmaki, Upper Harbour, Papakura.
Areas where the projected average annual population change is 1.7 percent or more are: Rodney, Franklin.
Text alternative for map, Percentage of population born overseas by Auckland local board area, 2023 Census
This map shows the percentage of the population born overseas, by Auckland local board area, as at the 2023 Census.
Areas where the percentage of the population born overseas was less than 30 percent were: Aotea/Great Barrier, Franklin, Rodney.
Areas where the percentage of the population born overseas was from 30 percent to less than 35 percent were: Waitākere Ranges, Waiheke.
Areas where the percentage of the population born overseas was from 35 percent to less than 45 percent were: Papakura, Manurewa, Ōrākei, Henderson-Massey, Māngere-Ōtāhuhu, Albert-Eden, Maungakiekie-Tāmaki, Hibiscus and Bays.
Areas where the percentage of the population born overseas was from 45 percent to less than 50 percent were: Devonport-Takapuna, Kaipātiki, Ōtara-Papatoetoe, Whau, Waitematā.
Areas where the percentage of the population born overseas was 50 percent or more were: Puketāpapa, Upper Harbour, Howick.


