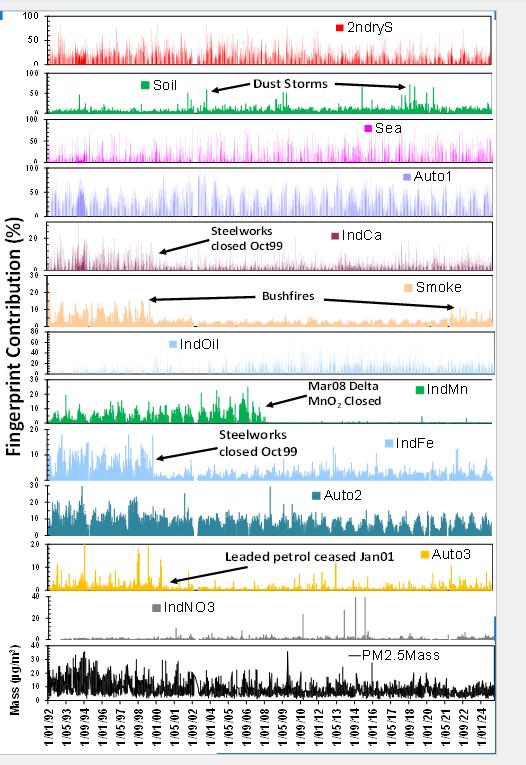
A deep dive into data from ANSTO's comprehensive aerosol sampling program (ASP) databases highlighted 12 environmental fingerprints of pollution sources for the Newcastle area.
Twenty-two elemental concentrations, from hydrogen (H) and lead (Pb) to black carbon (BC) and ammonium nitrate (NO3), were collected daily on a PM2.5 mass filter at Mayfield NSW among other sampling sites.
The filters were collected on 3,167 sampling days between January 1992 and December 2024 at Mayfield.
Scientists at ANSTO, led by Distinguished Research Scientist Prof David Cohen, used accelerator-based ion beam analysis techniques at the Centre for Accelerator Science to measure and distinguish between the sources of black carbon (MABI), to measure the quantities of these elements to generate these 12 source fingerprints.
The 12 pollution profiles averaged over a 33 -year period include secondary sulfates, soil, sea salt, automotive exhaust (three types), smoke, industrial calcium, heavy oil combustion, industrial magnesium, industrial iron and ammonium nitrate.
These fingerprints are linked directly to pollution emission sources and show some seasonal variation.
"There were some telling insights from the analysis, which were directly correlated with specific activities or events," said Prof Cohen.
When the BHP steelworks closed in October 1999, levels of industrial iron and calcium dropped.
When the Delta manganese dioxide factory closed in 2008, levels of industrial manganese dropped to essentially zero.
The use of unleaded petrol stopped in January 2001 and the combination of elements in leaded petrol found in the atmosphere also declined substantially.
Oil based air pollution was linked to shipping at the Port of Newcastle, one of the largest coal shipping ports in the world.
There are clear spikes in the natural pollution that can be traced back directly to dust storms and bushfires.
Nitrate emissions, which are commonly associated with production of fertilisers and also emitted from some motor vehicles, remained relatively steady with a few major spikes clearly identified across several years.
The research also identifies motor vehicles as a significant contributor to fine particle pollution with an average contribution of around 50 per cent of the total particle mass in the winter months.
"Our comprehensive database has not been fully mined. There is a wealth of information in these datasets from a range of different sampling locations that provide great insights into the nature of fine particle pollution both natural and anthropogenic," said Prof Cohen.
Fine particle pollution is known as PM2.5 for particulate matter that is 2.5 microns in size, which is 40 to 50 times smaller than the diameter of a human hair.
Fine particulate matter is collected on thin Teflon filters within air sampling units and sent to ANSTO for analysis from sites across Australia and around the globe.
High concentrations of these particles can significantly reduce visibility. They play a key role in climate variability as they are very efficient in scattering and absorbing solar radiation.
These microscopic aerosols can also cause significant health problems, as the nose and throat are inefficient at filtering them out, meaning they can penetrate deep into the lungs and even enter the bloodstream.
ANSTO's aerosol sampling program (ASP) database is extensive, covering daily data for PM2.5 mass from 1991 to the present. Over 65,000 daily filters from over 70 sites across Australia and in Asia have been analysed. Data from many of our key sites are available for download.
ANSTO recently submitted an extensive report covering 20 years of sampling on the Social and Economic Impact Assessment of Air Quality Monitoring Projects under the Regional Cooperative Agreement (RCA) Technical Cooperation Programme in Asia and the Pacific.
Australia's State of the Environment Report 2021 stated that the aim of the United Nations SDG 11 is to make cities and human settlements inclusive, safe, resilient and sustainable. Relevant to air quality, SDG 11 has a target to reduce the adverse per-person environmental impact of cities by 2030. The key indicator for this target is the annual PM2.5 concentration, weighted by the population The upper limit for the annual average concentration of PM2.5 as prescribed by the National Environmental Protection Measures (NEPMs) is 8 μg/m3. The Report emphasise that the importance of good-quality long-term measurements cannot be overestimated.


