Overseas merchandise trade statistics provide information on imports and exports of merchandise goods between New Zealand and other countries.
Key facts
This release refers to trade in goods only.
In November 2023, compared with November 2022:
- goods exports fell by $337 million (5.3 percent), to $6.0 billion
- goods imports fell by $1.3 billion (15 percent), to $7.2 billion
- the monthly trade balance was a deficit of $1.2 billion.
| Year | Exports | Imports |
| 2002 | 2451500255 | 2936382947 |
| 2003 | 2391216612 | 2780985538 |
| 2004 | 2609839504 | 3295243608 |
| 2005 | 2580484177 | 3813909445 |
| 2006 | 2788816701 | 3608816585 |
| 2007 | 3368356096 | 3996283177 |
| 2008 | 3680596758 | 4274241949 |
| 2009 | 3060984762 | 3341384547 |
| 2010 | 3662187585 | 3838763223 |
| 2011 | 3908117350 | 4485138144 |
| 2012 | 3827591138 | 4414868900 |
| 2013 | 4442276114 | 4289199167 |
| 2014 | 4040642551 | 4323620920 |
| 2015 | 4074415239 | 4869841467 |
| 2016 | 3871970871 | 4595171983 |
| 2017 | 4613158418 | 5835575719 |
| 2018 | 4857198818 | 5861171878 |
| 2019 | 5216341118 | 6002834206 |
| 2020 | 4918491946 | 4917812842 |
| 2021 | 5672334952 | 6758096680 |
| 2022 | 6329692557 | 8513479796 |
| 2023 | 5992493638 | 7226926265 |
Exports
Goods exports fell by $337 million (5.3 percent) in November 2023 (to $6.0 billion), compared with November 2022.
| Month | 2021 | 2022 | 2023 |
| January | 4116745461 | 4801909858 | 5308106709 |
| February | 4746223785 | 5190196779 | 5066418005 |
| March | 5471532739 | 6468309689 | 6256910049 |
| April | 5543577788 | 6162024235 | 6589877029 |
| May | 5794562593 | 6805654331 | 6953729010 |
| June | 6155360736 | 6226187883 | 6180641583 |
| July | 5777687406 | 6338147082 | 5377648638 |
| August | 4363580104 | 5282431055 | 4973797060 |
| September | 4396198190 | 5910355840 | 4765766743 |
| October | 5379540653 | 5952492994 | 5369458310 |
| November | 5672334952 | 6329692557 | 5992493638 |
| December | 6076827616 | 6503209518 |
China leads top monthly fall in exports
The monthly movements in November 2023, compared with November 2022, for our top export partners (in order of total annual goods exports) were:
- China: total exports were down $183 million (9.7 percent).
- The largest rise was logs, wood, and wood articles, up $49 million.
- The largest falls were live animals, down $62 million, and milk powder, butter, and cheese, down $56 million.
- Australia: total exports were down $35 million (4.5 percent).
- The largest rise was vehicles, parts, and accessories, up $12 million.
- The largest falls were wine, down $23 million, and milk powder, butter, and cheese, down $22 million.
- USA: total exports were up $110 million (18 percent).
- The largest rises were meat and edible offal, up $87 million; mechanical machinery and equipment, up $21 million; and miscellaneous edible preparations, up $14 million.
- The largest falls were wine, down $25 million, and animal or vegetable fats and oils, down $14 million.
- EU: total exports were down $27 million (9.1 percent).
- There were no significant rises or falls over $10 million.
- Japan: total exports were down $99 million (27 percent).
- There were no significant rises over $10 million.
- The largest falls were aluminium and aluminium articles, down $48 million and logs, wood, and wood articles, down $13 million.
Imports
Goods imports fell by $1.3 billion (15 percent) in November 2023 (to $7.2 billion), compared with November 2022.
| Month | 2021 | 2022 | 2023 |
| January | 4846510899 | 5908654153 | 7403344607 |
| February | 4296376775 | 5904997936 | 5913175635 |
| March | 5654088248 | 7061798285 | 7859400205 |
| April | 4985662797 | 5692528676 | 6369022956 |
| May | 5389626468 | 6657391295 | 6912113020 |
| June | 5713252483 | 7359056201 | 6295379964 |
| July | 6164845908 | 7753339153 | 6551797681 |
| August | 6496088385 | 7916568165 | 7240478389 |
| September | 6562231976 | 8430027312 | 7187136939 |
| October | 6662113657 | 8268020615 | 7099679443 |
| November | 6758096680 | 8513479796 | 7226926265 |
| December | 7067074072 | 7153740026 |
Vehicles, parts, and accessories lead imports fall
Vehicles, parts, and accessories fell $352 million (31 percent) to $798 million.
- Passenger motor car imports fell $183 million (25 percent) to $534 million, driven by electric vehicle imports (down $124 million or 56 percent).
- Goods vehicle imports fell $93 million (50 percent) to $94 million.
China leads top monthly fall in imports
The monthly movements in November 2023, compared with November 2022, for our top import partners (in order of total annual goods imports) were:
- China: total imports were down $347 million (17 percent).
- The largest rise was electrical machinery and equipment, up $100 million.
- The largest falls were vehicles, parts, and accessories, down $159 million, and textiles and textile articles, down $53 million.
- EU: total imports were down $164 million (14 percent).
- There were no significant rises over $10 million.
- The largest falls were vehicles, parts, and accessories, down $54 million, and aircraft and parts, down $47 million.
- Australia: total imports were down $219 million (23 percent).
- The largest rise was vehicles, parts, and accessories, up $10 million.
- The largest falls were cereals, down $83 million, and sugars and sugar confectionery, down $25 million.
- USA: total imports were down $68 million (11 percent).
- The largest rise was food residues, wastes, and fodder, up $15 million.
- The largest falls were vehicles, parts, and accessories, down $19 million, and plastic and plastic articles, down $11 million.
- South Korea: total imports were down $231 million (32 percent).
- There were no significant rises over $10 million.
- The largest falls were petroleum and products, down $135 million, and vehicles, parts, and accessories, down $40 million.
Trade deficit in November 2023
The monthly trade balance was a deficit of $1.2 billion.
| Month | Trade balance |
| Nov-14 | -282978369 |
| Dec-14 | -200200336 |
| Jan-15 | 52156653 |
| Feb-15 | 83971642 |
| Mar-15 | 660801360 |
| Apr-15 | 184071873 |
| May-15 | 367170522 |
| Jun-15 | -181952163 |
| Jul-15 | -730443957 |
| Aug-15 | -1090170040 |
| Sep-15 | -1140014218 |
| Oct-15 | -904822585 |
| Nov-15 | -795426228 |
| Dec-15 | -41905853 |
| Jan-16 | 12320231 |
| Feb-16 | 366925311 |
| Mar-16 | 188849850 |
| Apr-16 | 349530073 |
| May-16 | 343078843 |
| Jun-16 | 106790388 |
| Jul-16 | -351427805 |
| Aug-16 | -1239891851 |
| Sep-16 | -1387987389 |
| Oct-16 | -797651150 |
| Nov-16 | -723201112 |
| Dec-16 | -1435171 |
| Jan-17 | -226543047 |
| Feb-17 | -42276469 |
| Mar-17 | 261589138 |
| Apr-17 | 546879922 |
| May-17 | 62020162 |
| Jun-17 | 243117487 |
| Jul-17 | 92027349 |
| Aug-17 | -1174342582 |
| Sep-17 | -1165209854 |
| Oct-17 | -839633458 |
| Nov-17 | -1222417301 |
| Dec-17 | 614310559 |
| Jan-18 | -662421494 |
| Feb-18 | 188256546 |
| Mar-18 | -150609406 |
| Apr-18 | 199745211 |
| May-18 | 199288004 |
| Jun-18 | -285260079 |
| Jul-18 | -203110333 |
| Aug-18 | -1566757996 |
| Sep-18 | -1579921712 |
| Oct-18 | -1305105133 |
| Nov-18 | -1003973060 |
| Dec-18 | 9286883 |
| Jan-19 | -934926531 |
| Feb-19 | -93584137 |
| Mar-19 | 825181314 |
| Apr-19 | 360963002 |
| May-19 | 174927698 |
| Jun-19 | 329812747 |
| Jul-19 | -732335397 |
| Aug-19 | -1641634097 |
| Sep-19 | -1309937148 |
| Oct-19 | -1038380593 |
| Nov-19 | -786493088 |
| Dec-19 | 379772255 |
| Jan-20 | -395635011 |
| Feb-20 | 550639307 |
| Mar-20 | 522807892 |
| Apr-20 | 1374019783 |
| May-20 | 1222702687 |
| Jun-20 | 416538602 |
| Jul-20 | 387761796 |
| Aug-20 | -320606284 |
| Sep-20 | -1132334429 |
| Oct-20 | -465913506 |
| Nov-20 | 679104 |
| Dec-20 | 230069561 |
| Jan-21 | -729765438 |
| Feb-21 | 449847010 |
| Mar-21 | -182555509 |
| Apr-21 | 557914991 |
| May-21 | 404936125 |
| Jun-21 | 442108253 |
| Jul-21 | -387158502 |
| Aug-21 | -2132508281 |
| Sep-21 | -2166033786 |
| Oct-21 | -1282573004 |
| Nov-21 | -1085761728 |
| Dec-21 | -990246456 |
| Jan-22 | -1106744295 |
| Feb-22 | -714801157 |
| Mar-22 | -593488596 |
| Apr-22 | 469495559 |
| May-22 | 148263036 |
| Jun-22 | -1132868318 |
| Jul-22 | -1415192071 |
| Aug-22 | -2634137110 |
| Sep-22 | -2519671472 |
| Oct-22 | -2315527621 |
| Nov-22 | -2183787239 |
| Dec-22 | -650530508 |
| Jan-23 | -2095237898 |
| Feb-23 | -846757630 |
| Mar-23 | -1602490156 |
| Apr-23 | 220854073 |
| May-23 | 41615990 |
| Jun-23 | -114738381 |
| Jul-23 | -1174149043 |
| Aug-23 | -2266681329 |
| Sep-23 | -2421370196 |
| Oct-23 | -1730221133 |
| Nov-23 | -1234432627 |
November 2023 year
Annual values are actual and compared with the year ended November 2022.
- Annual goods exports were valued at $69.3 billion, down $2.2 billion from the previous year.
- Annual goods imports were valued at $83.2 billion, down $3.3 billion from the previous year.
- The annual trade deficit was $13.9 billion. In the year ended November 2022 there was a deficit of $15.0 billion.
| Year | Trade balance |
| Nov-12 | -1389201097 |
| Dec-12 | -1155072488 |
| Jan-13 | -1288043737 |
| Feb-13 | -1066319815 |
| Mar-13 | -520650474 |
| Apr-13 | -686505192 |
| May-13 | -901370377 |
| Jun-13 | -819339519 |
| Jul-13 | -1704983254 |
| Aug-13 | -2129039774 |
| Sep-13 | -1559173572 |
| Oct-13 | -1014147600 |
| Nov-13 | -273792891 |
| Dec-13 | -316678282 |
| Jan-14 | 261872324 |
| Feb-14 | 626656729 |
| Mar-14 | 798308321 |
| Apr-14 | 1095053944 |
| May-14 | 1319568932 |
| Jun-14 | 1188788451 |
| Jul-14 | 1034361246 |
| Aug-14 | 1805429957 |
| Sep-14 | 667403260 |
| Oct-14 | -55529709 |
| Nov-14 | -491585025 |
| Dec-14 | -1183419240 |
| Jan-15 | -1416085181 |
| Feb-15 | -2129195222 |
| Mar-15 | -2372062053 |
| Apr-15 | -2655363178 |
| May-15 | -2552535649 |
| Jun-15 | -2974536000 |
| Jul-15 | -2762446249 |
| Aug-15 | -3388079713 |
| Sep-15 | -3169130897 |
| Oct-15 | -3182409618 |
| Nov-15 | -3694857477 |
| Dec-15 | -3536562994 |
| Jan-16 | -3576399416 |
| Feb-16 | -3293445747 |
| Mar-16 | -3765397257 |
| Apr-16 | -3599939057 |
| May-16 | -3624030736 |
| Jun-16 | -3335288185 |
| Jul-16 | -2956272033 |
| Aug-16 | -3105993844 |
| Sep-16 | -3353967015 |
| Oct-16 | -3246795580 |
| Nov-16 | -3174570464 |
| Dec-16 | -3134099782 |
| Jan-17 | -3372963060 |
| Feb-17 | -3782164840 |
| Mar-17 | -3709425552 |
| Apr-17 | -3512075703 |
| May-17 | -3793134384 |
| Jun-17 | -3656807285 |
| Jul-17 | -3213352131 |
| Aug-17 | -3147802862 |
| Sep-17 | -2925025327 |
| Oct-17 | -2967007635 |
| Nov-17 | -3466223824 |
| Dec-17 | -2850478094 |
| Jan-18 | -3286356541 |
| Feb-18 | -3055823526 |
| Mar-18 | -3468022070 |
| Apr-18 | -3815156781 |
| May-18 | -3677888939 |
| Jun-18 | -4206266505 |
| Jul-18 | -4501404187 |
| Aug-18 | -4893819601 |
| Sep-18 | -5308531459 |
| Oct-18 | -5774003134 |
| Nov-18 | -5555558893 |
| Dec-18 | -6160582569 |
| Jan-19 | -6433087606 |
| Feb-19 | -6714928289 |
| Mar-19 | -5739137569 |
| Apr-19 | -5577919778 |
| May-19 | -5602280084 |
| Jun-19 | -4987207258 |
| Jul-19 | -5516432322 |
| Aug-19 | -5591308423 |
| Sep-19 | -5321323859 |
| Oct-19 | -5054599319 |
| Nov-19 | -4837119347 |
| Dec-19 | -4466633975 |
| Jan-20 | -3927342455 |
| Feb-20 | -3283119011 |
| Mar-20 | -3585492433 |
| Apr-20 | -2572435652 |
| May-20 | -1524660663 |
| Jun-20 | -1437934808 |
| Jul-20 | -317837615 |
| Aug-20 | 1003190198 |
| Sep-20 | 1180792917 |
| Oct-20 | 1753260004 |
| Nov-20 | 2540432196 |
| Dec-20 | 2390729502 |
| Jan-21 | 2056599075 |
| Feb-21 | 1955806778 |
| Mar-21 | 1250443377 |
| Apr-21 | 434338585 |
| May-21 | -383427977 |
| Jun-21 | -357858326 |
| Jul-21 | -1132778624 |
| Aug-21 | -2944680621 |
| Sep-21 | -3978379978 |
| Oct-21 | -4795039476 |
| Nov-21 | -5881480308 |
| Dec-21 | -7101796325 |
| Jan-22 | -7478775182 |
| Feb-22 | -8643423349 |
| Mar-22 | -9054356436 |
| Apr-22 | -9142775868 |
| May-22 | -9399448957 |
| Jun-22 | -10974425528 |
| Jul-22 | -12002459097 |
| Aug-22 | -12504087926 |
| Sep-22 | -12857725612 |
| Oct-22 | -13890680229 |
| Nov-22 | -14988705740 |
| Dec-22 | -14648989792 |
| Jan-23 | -15637483395 |
| Feb-23 | -15769439868 |
| Mar-23 | -16778441428 |
| Apr-23 | -17027082914 |
| May-23 | -17133729960 |
| Jun-23 | -16115600023 |
| Jul-23 | -15874556995 |
| Aug-23 | -15507101214 |
| Sep-23 | -15408799938 |
| Oct-23 | -14823493450 |
| Nov-23 | -13874138838 |
| Year | Exports | Imports |
| Nov-12 | 46244855732 | 47634056828 |
| Dec-12 | 46064057146 | 47219129634 |
| Jan-13 | 45684264233 | 46972307970 |
| Feb-13 | 45959347612 | 47025667427 |
| Mar-13 | 46160364525 | 46681014999 |
| Apr-13 | 46233655653 | 46920160845 |
| May-13 | 45878406742 | 46779777119 |
| Jun-13 | 45704290138 | 46523629658 |
| Jul-13 | 45488120687 | 47193103942 |
| Aug-13 | 45475128020 | 47604167795 |
| Sep-13 | 46004783845 | 47563957418 |
| Oct-13 | 46782091774 | 47796239375 |
| Nov-13 | 47396776751 | 47670569642 |
| Dec-13 | 48043670100 | 48360348383 |
| Jan-14 | 48764834860 | 48502962537 |
| Feb-14 | 49403232675 | 48776575947 |
| Mar-14 | 50027958728 | 49229650408 |
| Apr-14 | 50491458211 | 49396404268 |
| May-14 | 50989992814 | 49670423883 |
| Jun-14 | 51161136425 | 49972347974 |
| Jul-14 | 51017556730 | 49983195484 |
| Aug-14 | 51254401927 | 49448971970 |
| Sep-14 | 51053416397 | 50386013137 |
| Oct-14 | 50823329360 | 50878859069 |
| Nov-14 | 50421695797 | 50913280822 |
| Dec-14 | 50074641250 | 51258060490 |
| Jan-15 | 49687287730 | 51103372911 |
| Feb-15 | 49042886225 | 51172081447 |
| Mar-15 | 48915143951 | 51287206004 |
| Apr-15 | 48642733035 | 51298096213 |
| May-15 | 48423057431 | 50975593080 |
| Jun-15 | 48396163181 | 51370699181 |
| Jul-15 | 48880453005 | 51642899254 |
| Aug-15 | 49057455495 | 52445535208 |
| Sep-15 | 49117987199 | 52287118096 |
| Oct-15 | 48918947187 | 52101356805 |
| Nov-15 | 48952719875 | 52647577352 |
| Dec-15 | 48973550776 | 52510113770 |
| Jan-16 | 49187466085 | 52763865501 |
| Feb-16 | 49537612567 | 52831058314 |
| Mar-16 | 48833243763 | 52598641020 |
| Apr-16 | 49026536183 | 52626475240 |
| May-16 | 49230155446 | 52854186182 |
| Jun-16 | 49324864243 | 52660152428 |
| Jul-16 | 49121608220 | 52077880253 |
| Aug-16 | 48793893786 | 51899887630 |
| Sep-16 | 48583604241 | 51937571256 |
| Oct-16 | 48696300602 | 51943096182 |
| Nov-16 | 48493856234 | 51668426698 |
| Dec-16 | 48486904078 | 51621003860 |
| Jan-17 | 48527688853 | 51900651913 |
| Feb-17 | 48305011954 | 52087176794 |
| Mar-17 | 48694076739 | 52403502291 |
| Apr-17 | 49076148830 | 52588224533 |
| May-17 | 49424472301 | 53217606685 |
| Jun-17 | 49873491508 | 53530298793 |
| Jul-17 | 50528773127 | 53742125258 |
| Aug-17 | 50834401328 | 53982204190 |
| Sep-17 | 51160043929 | 54085069256 |
| Oct-17 | 51791672041 | 54758679676 |
| Nov-17 | 52532859588 | 55999083412 |
| Dec-17 | 53625488161 | 56475966255 |
| Jan-18 | 53965184420 | 57251540961 |
| Feb-18 | 54395355682 | 57451179208 |
| Mar-18 | 54602966051 | 58070988121 |
| Apr-18 | 54860205151 | 58675361932 |
| May-18 | 55304076433 | 58981965372 |
| Jun-18 | 55490192916 | 59696459421 |
| Jul-18 | 56206201587 | 60707605774 |
| Aug-18 | 56493336022 | 61387155623 |
| Sep-18 | 56954044261 | 62262575720 |
| Oct-18 | 57226558637 | 63000561771 |
| Nov-18 | 57470599037 | 63026157930 |
| Dec-18 | 57251104265 | 63411686834 |
| Jan-19 | 57320341207 | 63753428813 |
| Feb-19 | 57583937302 | 64298865591 |
| Mar-19 | 58386241764 | 64125379333 |
| Apr-19 | 58900924296 | 64478844074 |
| May-19 | 59293597157 | 64895877241 |
| Jun-19 | 59378412551 | 64365619809 |
| Jul-19 | 58963308257 | 64479740579 |
| Aug-19 | 59050318141 | 64641626564 |
| Sep-19 | 59153331446 | 64474655305 |
| Oct-19 | 59330562863 | 64385162182 |
| Nov-19 | 59689705163 | 64526824510 |
| Dec-19 | 59899236281 | 64365870256 |
| Jan-20 | 60232430772 | 64159773227 |
| Feb-20 | 60412604751 | 63695723762 |
| Mar-20 | 60424643728 | 64010136161 |
| Apr-20 | 60267881085 | 62840316737 |
| May-20 | 59860029862 | 61384690525 |
| Jun-20 | 59923371349 | 61361306157 |
| Jul-20 | 59958852127 | 60276689742 |
| Aug-20 | 60267415950 | 59264225752 |
| Sep-20 | 59811824505 | 58631031588 |
| Oct-20 | 59608519266 | 57855259262 |
| Nov-20 | 59310670094 | 56770237898 |
| Dec-20 | 59352090268 | 56961360766 |
| Jan-21 | 58791158732 | 56734559657 |
| Feb-21 | 58648923039 | 56693116261 |
| Mar-21 | 58509007529 | 57258564152 |
| Apr-21 | 58727983912 | 58293645327 |
| May-21 | 59187764622 | 59571192599 |
| Jun-21 | 60317064345 | 60674922671 |
| Jul-21 | 61137731227 | 62270509851 |
| Aug-21 | 61130377632 | 64075058253 |
| Sep-21 | 61626437404 | 65604817382 |
| Oct-21 | 62203301840 | 66998341316 |
| Nov-21 | 62957144846 | 68838625154 |
| Dec-21 | 63494172023 | 70595968348 |
| Jan-22 | 64179336420 | 71658111602 |
| Feb-22 | 64623309414 | 73266732763 |
| Mar-22 | 65620086364 | 74674442800 |
| Apr-22 | 66238532811 | 75381308679 |
| May-22 | 67249624549 | 76649073506 |
| Jun-22 | 67320451696 | 78294877224 |
| Jul-22 | 67880911372 | 79883370469 |
| Aug-22 | 68799762323 | 81303850249 |
| Sep-22 | 70313919973 | 83171645585 |
| Oct-22 | 70886872314 | 84777552543 |
| Nov-22 | 71544229919 | 86532935659 |
| Dec-22 | 71970611821 | 86619601613 |
| Jan-23 | 72476808672 | 88114292067 |
| Feb-23 | 72353029898 | 88122469766 |
| Mar-23 | 72141630258 | 88920071686 |
| Apr-23 | 72569483052 | 89596565966 |
| May-23 | 72717557731 | 89851287691 |
| Jun-23 | 72672011431 | 88787611454 |
| Jul-23 | 71711512987 | 87586069982 |
| Aug-23 | 71402878992 | 86909980206 |
| Sep-23 | 70258289895 | 85667089833 |
| Oct-23 | 69675255211 | 84498748661 |
| Nov-23 | 69338056292 | 83212195130 |
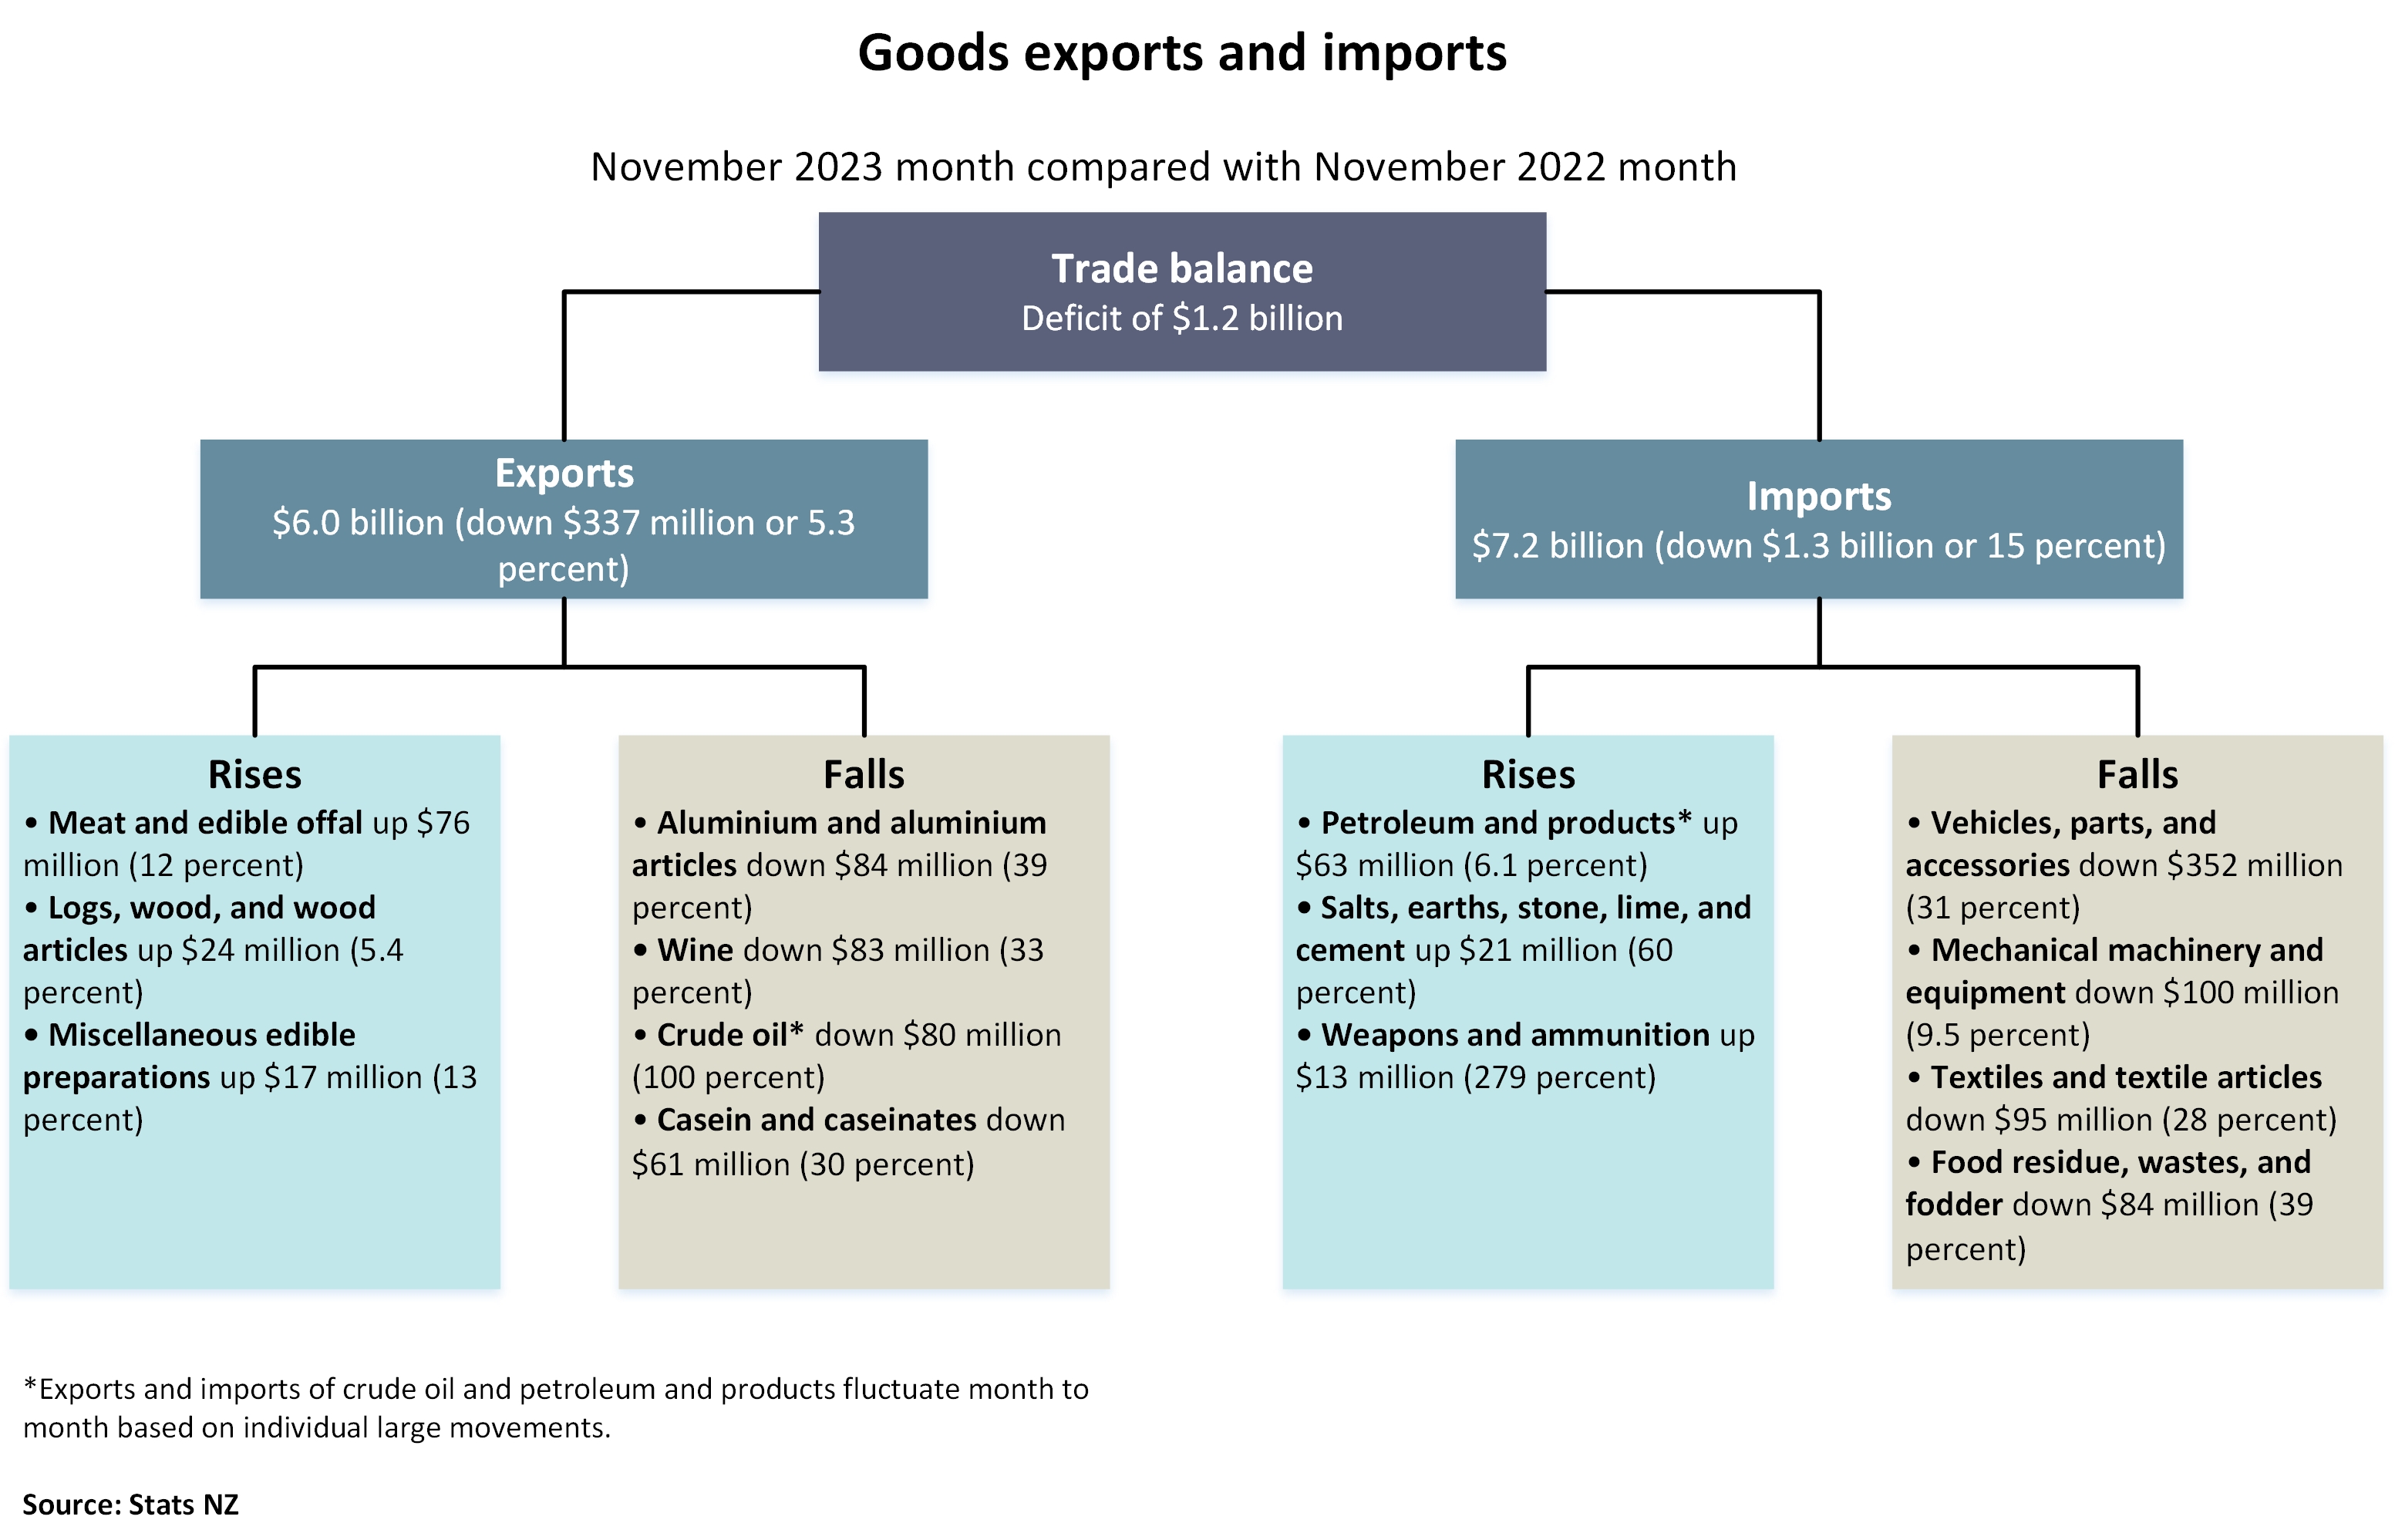
Text alternative for Goods exports and imports, November 2023 month compared with November 2022 month
The diagram shows goods exports and imports for the November 2023 month compared with the November 2022 month.
The trade balance is a deficit of $1.2 billion. This is the difference between exports valued at $6.0 billion (down $337 million or 5.3 percent) and imports valued at $7.2 billion (down $1.3 billion or 15 percent).
Export commodities that rose included: meat and edible offal, up $76 million (12 percent); logs, wood, and wood articles, up $24 million (5.4 percent); miscellaneous edible preparations, up $17 million (13 percent).
Export commodities that fell included: aluminium and aluminium articles, down $84 million (39 percent); wine, down $83 million (33 percent); crude oil*, down $80 million (100 percent); casein and caseinates, down $61 million (30 percent).
Import commodities that rose included: petroleum and products*, up $63 million (6.1 percent); salt, earths, stone, lime, and cement, up $21 million (60 percent); weapons and ammunition, up $13 million (279 percent).
Import commodities that fell included: vehicles, parts, and accessories, down $352 million (31 percent); mechanical machinery and equipment, down $100 million (9.5 percent); textiles and textile articles, down $95 million (28 percent); food residues, wastes, and fodder, down $84 million (39 percent).
*Exports and imports of crude oil and petroleum and products fluctuate month to month based on individual large movements.
Source: Stats NZ
More data
Use Infoshare to access time-series data for imports and exports.
Subject category: Imports and exports
Overseas merchandise trade datasets has CSV data for goods imports and exports.
International trade: September 2023 quarter has information on trade in goods and services.
Definitions and metadata
Overseas merchandise trade - DataInfo+ provides the definitions of terms used in this release and general methodology used to produce overseas merchandise trade statistics.
Technical enquiries
Tara Hayward
04 931 4600
[email protected]
ISSN 1178-0320
Next release
Overseas merchandise trade: December 2023 will be released on 29 January 2024.


