
Overseas merchandise trade statistics provide information on imports and exports of merchandise goods between New Zealand and other countries.
Key facts
This release refers to trade in goods only.
In June 2026, compared with June 2025:
- goods exports rose by $1.6 billion (25 percent), to $8.1 billion
- goods imports rose by $1.7 billion (28 percent), to $8.1 billion
- the monthly trade balance was a surplus of $23 million.
| Year | Exports | Imports |
| 2006 | 2971874102 | 3164113787 |
| 2007 | 2739401893 | 3257763007 |
| 2008 | 3593955606 | 3809002848 |
| 2009 | 3232895264 | 3563984377 |
| 2010 | 3793062976 | 3572335663 |
| 2011 | 3954441720 | 3753043064 |
| 2012 | 4177926888 | 3889129077 |
| 2013 | 4003810285 | 3632981616 |
| 2014 | 4174953895 | 3934905707 |
| 2015 | 4148059645 | 4330011808 |
| 2016 | 4242768442 | 4135978054 |
| 2017 | 4691787649 | 4448670162 |
| 2018 | 4877904132 | 5163164211 |
| 2019 | 4962719526 | 4632906779 |
| 2020 | 5026061013 | 4609522411 |
| 2021 | 6155360736 | 5713252483 |
| 2022 | 6226187883 | 7359056201 |
| 2023 | 6180641583 | 6295379964 |
| 2024 | 6029222677 | 5452098487 |
| 2025 | 6485844443 | 6326998930 |
| 2026 | 8092970496 | 8070310576 |
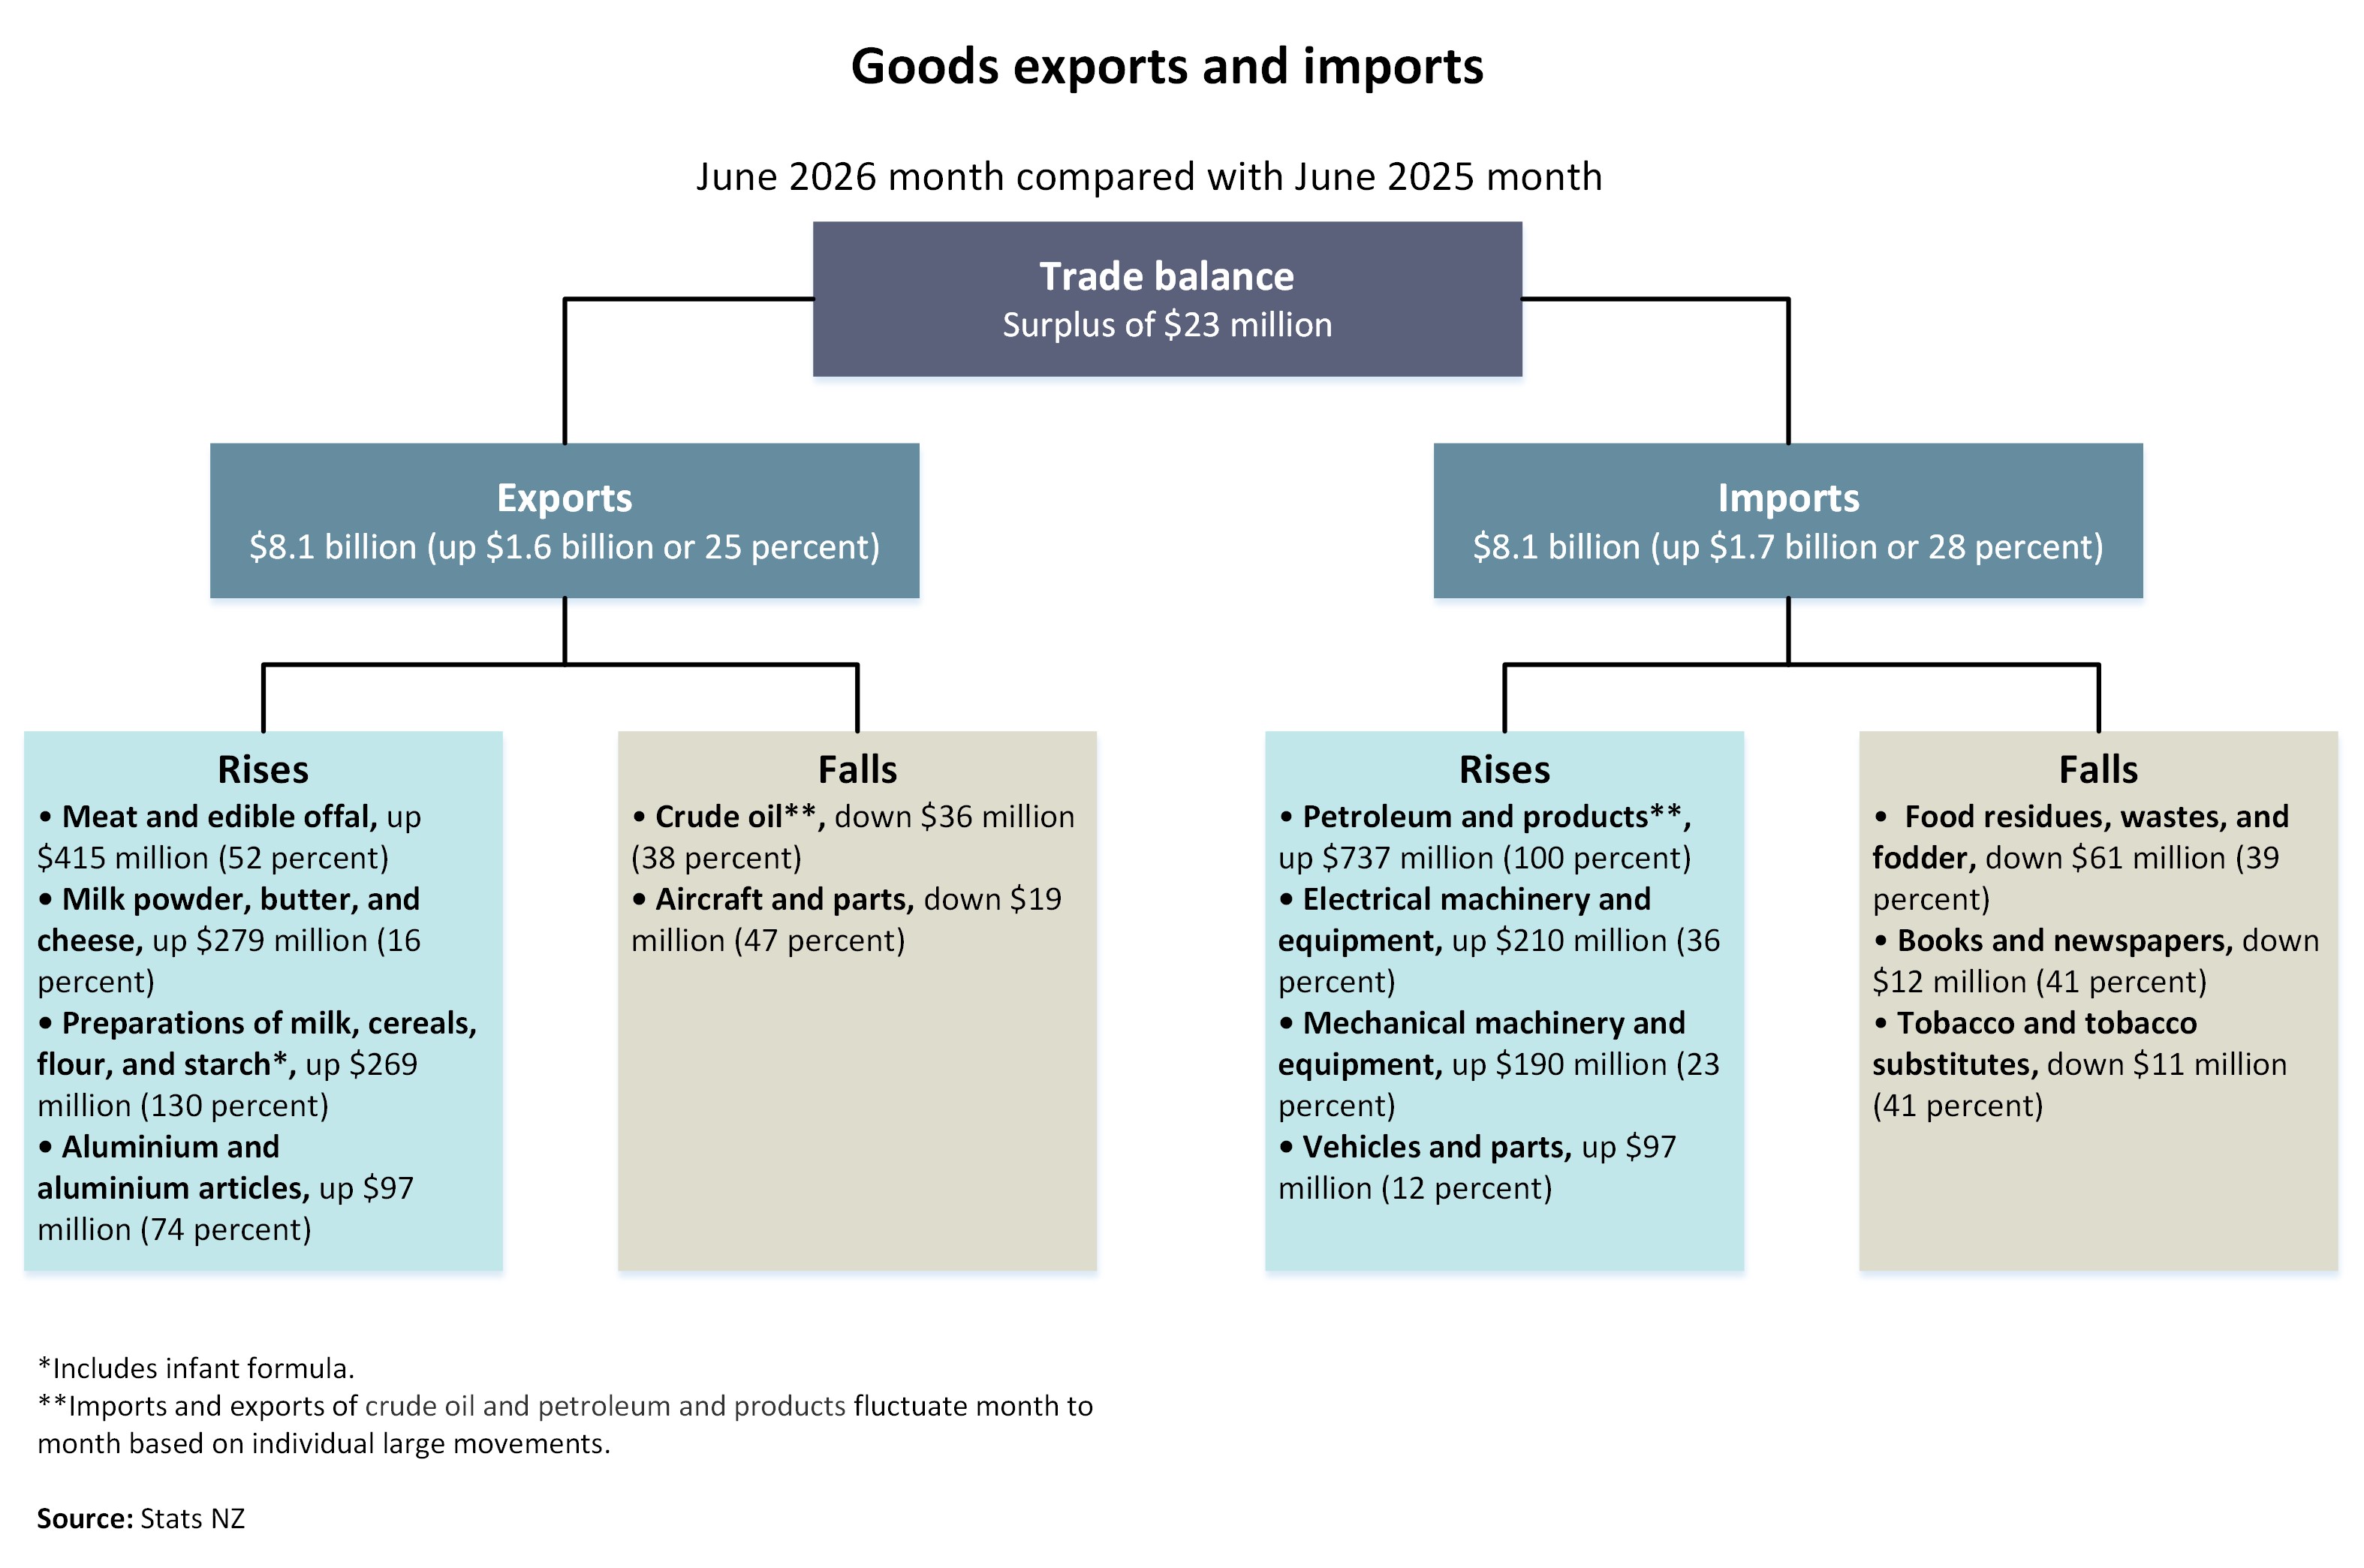
Text alternative for Goods exports and imports, June 2026 month, compared with June 2025 month
Exports
Goods exports rose by $1.6 billion (25 percent) in June 2026 (to $8.1 billion), compared with June 2025.
Milk powder, butter, and cheese rose $279 million (16 percent), to $2.1 billion.
June 2026 value ($ million) |
Change in value from June 2025 ($ million) |
Change in value |
Change in quantity |
Change in unit price |
|
Milk powder, butter, and cheese |
2,052 |
279 |
16% |
* |
* |
Milk powder |
890 |
50 |
5.9% |
10% |
-3.9% |
Milk fats (including butter) |
530 |
122 |
30% |
36% |
-4.9% |
Cheese |
338 |
57 |
20% |
18% |
2.2% |
Fresh milk and cream |
123 |
-8.3 |
-6.3% |
* |
* |
* Changes in total quantity and unit price are omitted due to differences in units of measure. |
|||||
Preparations of cereals, flour, milk, and starch rose $269 million (130 percent), to $477 million in June 2026, compared with June 2025. This was led by infant formula, which rose $255 million (181 percent), to $396 million.
Top monthly export movements by country
The monthly movements in June 2026, compared with June 2025, for our top export partners (in order of total annual goods exports) were:
- China: total exports were up $353 million (24 percent).
- The largest rises were preparations of milk, cereals, flour, and starch, up $231 million; meat and edible offal, up $103 million; and fish, crustaceans, and molluscs, up $32 million.
- The largest falls were milk powder, butter, and cheese, down $71 million and fruit, down $12 million.
- Australia: total exports were up $149 million (18 percent).
- The largest rises were precious metals, jewellery, and coins, up $87 million; miscellaneous edible preparations, up $19 million; and electrical machinery and equipment, up $17 million.
- The largest falls were crude oil, down $55 million; mechanical machinery and equipment, down $13 million; and aircraft and parts, down $11 million.
- USA: total exports were up $314 million (43 percent).
- The largest rises were meat and edible offal, up $158 million; milk powder, butter, and cheese, up $33 million; and fruit, up $31 million.
- The largest falls were iron and steel, and articles, down $11 million and casein and caseinates, down $10 million.
- EU: total exports were up $47 million (6.9 percent).
- The largest rises were aluminium and aluminium articles, up $32 million; meat and edible offal, up $15 million; and albumins, gelatin, glues, and enzymes, up $13 million.
- There were no significant falls over $10 million.
- Japan: total exports were up $66 million (19 percent).
- The largest rises were aluminium and aluminium articles, up $33 million; fruit, up $28 million; and meat and edible offal, up $12 million.
- The largest fall was logs, wood, and wood articles, down $12 million.
Imports
Goods imports rose by $1.7 billion (28 percent) in June 2026 (to $8.1 billion), compared with June 2025.
Petroleum and petroleum products increased $737 million (100 percent) to $1.5 billion, compared with June 2025.
| Month | Value |
| Jun-16 | 379947205 |
| Jul-16 | 380187200 |
| Aug-16 | 281680894 |
| Sept-16 | 449516032 |
| Oct-16 | 321270195 |
| Nov-16 | 415808099 |
| Dec-16 | 433056221 |
| Jan-17 | 472052705 |
| Feb-17 | 470581765 |
| Mar-17 | 336994382 |
| Apr-17 | 398133995 |
| May-17 | 651884718 |
| Jun-17 | 399762398 |
| Jul-17 | 402015701 |
| Aug-17 | 376246439 |
| Sept-17 | 422850023 |
| Oct-17 | 376066126 |
| Nov-17 | 562996156 |
| Dec-17 | 432577534 |
| Jan-18 | 644097728 |
| Feb-18 | 450795654 |
| Mar-18 | 646101676 |
| Apr-18 | 606203816 |
| May-18 | 487492638 |
| Jun-18 | 812538230 |
| Jul-18 | 794241241 |
| Aug-18 | 588914980 |
| Sept-18 | 744184721 |
| Oct-18 | 622868155 |
| Nov-18 | 575031666 |
| Dec-18 | 771723682 |
| Jan-19 | 695462246 |
| Feb-19 | 492508489 |
| Mar-19 | 528941223 |
| Apr-19 | 608669154 |
| May-19 | 750981926 |
| Jun-19 | 480606723 |
| Jul-19 | 687061194 |
| Aug-19 | 669877325 |
| Sept-19 | 469341928 |
| Oct-19 | 649712823 |
| Nov-19 | 592908156 |
| Dec-19 | 566574478 |
| Jan-20 | 721429354 |
| Feb-20 | 420739683 |
| Mar-20 | 871810875 |
| Apr-20 | 221331960 |
| May-20 | 325262734 |
| Jun-20 | 236917981 |
| Jul-20 | 170986403 |
| Aug-20 | 364705776 |
| Sept-20 | 419106333 |
| Oct-20 | 427884309 |
| Nov-20 | 285626948 |
| Dec-20 | 348094359 |
| Jan-21 | 379002103 |
| Feb-21 | 230424563 |
| Mar-21 | 473296637 |
| Apr-21 | 437361855 |
| May-21 | 552745191 |
| Jun-21 | 385482625 |
| Jul-21 | 584739844 |
| Aug-21 | 584651631 |
| Sept-21 | 417363912 |
| Oct-21 | 654282129 |
| Nov-21 | 474159902 |
| Dec-21 | 452271450 |
| Jan-22 | 627865217 |
| Feb-22 | 510859361 |
| Mar-22 | 629901060 |
| Apr-22 | 236683620 |
| May-22 | 767027513 |
| Jun-22 | 1181307998 |
| Jul-22 | 1169758283 |
| Aug-22 | 1047551744 |
| Sept-22 | 1311027744 |
| Oct-22 | 944062240 |
| Nov-22 | 1028683099 |
| Dec-22 | 464957611 |
| Jan-23 | 1716031343 |
| Feb-23 | 700627053 |
| Mar-23 | 1266019770 |
| Apr-23 | 974690353 |
| May-23 | 789284731 |
| Jun-23 | 807653206 |
| Jul-23 | 659057605 |
| Aug-23 | 878153832 |
| Sept-23 | 1040656203 |
| Oct-23 | 925001794 |
| Nov-23 | 1091592586 |
| Dec-23 | 998693569 |
| Jan-24 | 860378028 |
| Feb-24 | 866474131 |
| Mar-24 | 872380525 |
| Apr-24 | 1174500030 |
| May-24 | 1012057023 |
| Jun-24 | 366903373 |
| Jul-24 | 1323333716 |
| Aug-24 | 897098360 |
| Sept-24 | 822967360 |
| Oct-24 | 702749398 |
| Nov-24 | 745264374 |
| Dec-24 | 796384381 |
| Jan-25 | 867403451 |
| Feb-25 | 863136408 |
| Mar-25 | 1033985365 |
| Apr-25 | 854006411 |
| May-25 | 800896079 |
| Jun-25 | 738831811 |
| Jul-25 | 732840912 |
| Aug-25 | 806549390 |
| Sept-25 | 634997585 |
| Oct-25 | 911943316 |
| Nov-25 | 799496772 |
| Dec-25 | 876530265 |
| Jan-26 | 875909745 |
| Feb-26 | 862944510 |
| Mar-26 | 724439877 |
| Apr-26 | 856830082 |
| May-26 | 1635561577 |
| Jun-26 | 1475681556 |
Contributing to the rise in petroleum and petroleum products in June 2026 compared with June 2025 were:
- automotive diesel - rose $480 million (160 percent) in value. The quantity imported rose 4.6 percent, while the average unit value rose 148 percent.
- motor spirit - rose $88 million (40 percent) in value. The quantity imported fell 19 percent, while the average unit value rose 73 percent.
- jet fuel - rose $145 million (85 percent) in value. The quantity imported fell 28 percent, while the average unit value rose 157 percent.
Top monthly import movements by country
The monthly movements in June 2026, compared with June 2025, for our top import partners (in order of total annual goods imports) were:
- China: total imports were up $425 million (32 percent).
- The largest rises were electrical machinery and equipment, up $116 million; vehicles, parts, and accessories, up $75 million; and plastic and plastic articles, up $31 million.
- There were no significant falls over $10 million.
- EU: total imports were up $212 million (24 percent).
- The largest rises were electrical machinery and equipment, up $49 million; mechanical machinery and equipment, up $46 million; and aircraft and parts, up $28 million.
- The largest fall was vehicles, parts, and accessories, down $14 million.
- Australia: total imports were up $156 million (24 percent).
- The largest rises were sugars and sugar confectionery, up $23 million; vehicles, parts, and accessories, up $19 million; and cereals, up $18 million.
- There were no significant falls over $10 million.
- USA: total imports were down $44 million (7.0 percent).
- The largest rise was plastic and plastic articles, up $11 million.
- The largest falls were food residues, wastes, and fodder, down $43 million and optical, medical, and measuring equipment, down $13 million.
- South Korea: total imports were up $194 million (41 percent).
- The largest rises were petroleum and products, up $147 million and vehicles, parts, and accessories, up $14 million.
- There were no significant falls over $10 million.
Trade surplus in June 2026
The monthly trade balance was a surplus of $23 million.
| Date | Trade balance |
| Jun-17 | 243117487 |
| Jul-17 | 92027349 |
| Aug-17 | -1174342582 |
| Sept-17 | -1165209854 |
| Oct-17 | -839633458 |
| Nov-17 | -1222417301 |
| Dec-17 | 614310559 |
| Jan-18 | -662421494 |
| Feb-18 | 188256546 |
| Mar-18 | -150609406 |
| Apr-18 | 199745211 |
| May-18 | 199288004 |
| Jun-18 | -285260079 |
| Jul-18 | -203110333 |
| Aug-18 | -1566757996 |
| Sept-18 | -1579921712 |
| Oct-18 | -1305105133 |
| Nov-18 | -1003973060 |
| Dec-18 | 9286883 |
| Jan-19 | -934926531 |
| Feb-19 | -93584137 |
| Mar-19 | 825181314 |
| Apr-19 | 360963002 |
| May-19 | 174927698 |
| Jun-19 | 329812747 |
| Jul-19 | -732335397 |
| Aug-19 | -1641634097 |
| Sept-19 | -1309937148 |
| Oct-19 | -1038380593 |
| Nov-19 | -786493088 |
| Dec-19 | 379772255 |
| Jan-20 | -395635011 |
| Feb-20 | 550639307 |
| Mar-20 | 522807892 |
| Apr-20 | 1374019783 |
| May-20 | 1222702687 |
| Jun-20 | 416538602 |
| Jul-20 | 387761796 |
| Aug-20 | -320606284 |
| Sept-20 | -1132334429 |
| Oct-20 | -465913506 |
| Nov-20 | 679104 |
| Dec-20 | 230069561 |
| Jan-21 | -729765438 |
| Feb-21 | 449847010 |
| Mar-21 | -182555509 |
| Apr-21 | 557914991 |
| May-21 | 404936125 |
| Jun-21 | 442108253 |
| Jul-21 | -387158502 |
| Aug-21 | -2132508281 |
| Sept-21 | -2166033786 |
| Oct-21 | -1282573004 |
| Nov-21 | -1085761728 |
| Dec-21 | -990246456 |
| Jan-22 | -1106744295 |
| Feb-22 | -714801157 |
| Mar-22 | -593488596 |
| Apr-22 | 469495559 |
| May-22 | 148263036 |
| Jun-22 | -1132868318 |
| Jul-22 | -1415192071 |
| Aug-22 | -2634137110 |
| Sept-22 | -2519671472 |
| Oct-22 | -2315527621 |
| Nov-22 | -2183787239 |
| Dec-22 | -650530508 |
| Jan-23 | -2095237898 |
| Feb-23 | -846757630 |
| Mar-23 | -1602490156 |
| Apr-23 | 220723935 |
| May-23 | 41615990 |
| Jun-23 | -114738381 |
| Jul-23 | -1174149043 |
| Aug-23 | -2266681329 |
| Sept-23 | -2420838856 |
| Oct-23 | -1732504563 |
| Nov-23 | -1258971689 |
| Dec-23 | -372771305 |
| Jan-24 | -1064170538 |
| Feb-24 | -318989147 |
| Mar-24 | 469883412 |
| Apr-24 | -11882445 |
| May-24 | 59494662 |
| Jun-24 | 577124190 |
| Jul-24 | -1021575122 |
| Aug-24 | -2316015330 |
| Sept-24 | -2166468080 |
| Oct-24 | -1653634248 |
| Nov-24 | -449804544 |
| Dec-24 | 36046105 |
| Jan-25 | -549356414 |
| Feb-25 | 443569867 |
| Mar-25 | 791665130 |
| Apr-25 | 1197956921 |
| May-25 | 1101679700 |
| Jun-25 | 158845513 |
| Jul-25 | -761568183 |
| Aug-25 | -1312707996 |
| Sept-25 | -1406470725 |
| Oct-25 | -1584405113 |
| Nov-25 | -323113904 |
| Dec-25 | 27075768 |
| Jan-26 | -635016441 |
| Feb-26 | -378997199 |
| Mar-26 | 451208667 |
| Apr-26 | 1578982489 |
| May-26 | 576800045 |
| Jun-26 | 22659920 |
Imports of selected Harmonised System (HS codes) - Supplementary table
The following table presents selected harmonised system (HS codes) for import commodities that may be affected by the ongoing conflict in the Middle East.
HS code |
Commodity description |
March 2026 value ($) |
April 2026 value ($) |
May 2026 value ($) |
June 2026 value ($) |
100191 |
Cereal for food production |
22,953,397 |
4,833,469 |
9,404,945 |
14,780,169 |
151419 |
Oils for food production |
6,044,928 |
7,760,841 |
9,565,644 |
16,348,000 |
170211 |
Sugar for food production |
23,620,183 |
22,682,445 |
21,310,330 |
22,145,823 |
230660 |
Palm kernel expeller |
56,154,449 |
53,771,667 |
36,293,255 |
30,098,640 |
2503 |
Sulphur |
6,073,035 |
1,230,342 |
3,922,587 |
39,608,481 |
251010 |
Phosphate rock |
15,636,433 |
0 |
9,910,464 |
0 |
2709 |
Crude petroleum oils |
59,483 |
0 |
73,684 |
0 |
2710 |
Non-crude petroleum oils, waste oil, and biodiesel (petroleum oils other than crude petrol and diesel) |
672,869,812 |
843,361,643 |
1,564,000,155 |
1,452,180,970 |
271012 |
Motor spirit (including petrol, light oils, and preparations) |
179,460,232 |
299,228,488 |
453,011,796 |
308,406,882 |
2710121910 |
Motor Spirit (petrol) <95 octane (not for further manufacture) |
135,939,030 |
218,952,861 |
327,605,222 |
228,900,499 |
2710121919 |
Motor Spirit (petrol) >=95 octane (not for further manufacture) |
42,621,003 |
75,154,219 |
120,576,407 |
77,928,334 |
271019 |
Kerosene, jet fuel and diesel: petroleum oils NOT light oils and preparations |
493,356,336 |
544,117,027 |
1,110,962,728 |
1,143,725,867 |
2710191600 |
Kerosene, jet fuel |
123,548,305 |
172,018,596 |
353,043,807 |
315,999,275 |
2710193200 |
Automotive diesel |
319,471,244 |
302,607,627 |
728,654,731 |
780,583,211 |
2711 |
Petroleum gases |
9,715,350 |
12,197,393 |
20,855,045 |
21,002,012 |
2712 |
Petroleum jelly and paraffin wax |
1,095,316 |
610,209 |
1,958,224 |
1,138,499 |
2713 |
Petroleum coke |
20,160,724 |
114,345 |
37,322,591 |
63,025 |
2714 |
Natural bitumen and asphalt |
40,613 |
0 |
47,322 |
91,940 |
2715 |
Bitumen mixtures |
20,498,579 |
546,492 |
11,304,556 |
1,205,110 |
280110 |
Chlorine gas |
604,941 |
329,176 |
669,589 |
562,849 |
280429 |
Helium |
159,145 |
247,134 |
210,906 |
136,441 |
281121 |
Carbon dioxide |
346,588 |
404,164 |
207,077 |
504,407 |
2814 |
Ammonia |
66,090 |
33,368 |
67,256 |
81,304 |
281511 |
Caustic soda (sodium hydroxide) |
230,866 |
303,703 |
778,336 |
1,719,691 |
282890 |
Sodium hypochlorite |
105,352 |
80,647 |
251,905 |
168,758 |
283322 |
Aluminium sulphate |
3,073 |
10,232 |
22,053 |
462 |
290230 |
Toluene |
96,135 |
45,309 |
179,504 |
184,346 |
291521 |
Acetic acid |
224,815 |
311,441 |
129,630 |
370,009 |
3101 |
Animal or vegetable fertilisers |
323,790 |
439,240 |
509,078 |
616,934 |
3102 |
Nitrogen fertilisers |
69,555,309 |
7,961,624 |
42,249,634 |
35,124,923 |
310210 |
Urea |
63,996,319 |
918,326 |
13,789,418 |
7,429,604 |
3103 |
Phosphate fertilisers |
2,638,713 |
3,827,847 |
3,774,746 |
3,045,894 |
3104 |
Potassium fertilisers |
1,353,786 |
854,282 |
802,062 |
33,523,149 |
310420 |
Potash |
1,024,148 |
797,205 |
670,062 |
32,838,255 |
3105 |
Fertilisers nec |
4,596,246 |
6,196,906 |
14,601,944 |
13,954,010 |
350691 |
Adhesives |
3,990,351 |
3,782,357 |
4,019,498 |
4,521,307 |
390110 |
Ethylene polymers: in primary forms, polyethylene having a specific gravity of less than 0.94 |
7,260,550 |
9,543,585 |
13,131,205 |
18,981,162 |
390120 |
Ethylene polymers: in primary forms, polyethylene having a specific gravity of 0.94 or more |
9,860,123 |
6,984,393 |
14,906,681 |
19,162,196 |
391110 |
Resins |
68,532 |
38,130 |
9,708 |
37,697 |
391732 |
Polyvinyl Chloride (PVC) |
4,471,277 |
4,444,915 |
5,224,274 |
4,189,979 |
392690 |
Polypropylene |
29,202,394 |
26,800,854 |
33,313,589 |
32,592,223 |
760120 |
Aluminium |
3,767,243 |
2,268,149 |
3,895,404 |
2,748,965 |
870194 |
Machinery for food production |
20,237,553 |
11,241,559 |
28,418,988 |
12,978,925 |
June 2026 quarter
June 2026 values are seasonally adjusted and compared with the March 2026 quarter.
- Goods exports rose 8.1 percent ($1.7 billion) to $22.4 billion, following a 0.9 percent rise in the March 2026 quarter.
- Goods imports rose 7.7 percent ($1.7 billion) to $23.9 billion, following a 3.2 percent rise in the March 2026 quarter.
- The quarterly trade balance was a deficit of $1.5 billion.
June 2026 year
Annual values are actual and compared with the year ended June 2025.
- Annual goods exports were valued at $84.0 billion, up $7.8 billion from the previous year.
- Annual goods imports were valued at $87.8 billion, up $7.1 billion from the previous year.
- The annual trade deficit was $3.7 billion. In the year ended June 2025 the deficit was $4.4 billion.
| Month | Trade balance |
| Jun-17 | -3656807285 |
| Jul-17 | -3213352131 |
| Aug-17 | -3147802862 |
| Sept-17 | -2925025327 |
| Oct-17 | -2967007635 |
| Nov-17 | -3466223824 |
| Dec-17 | -2850478094 |
| Jan-18 | -3286356541 |
| Feb-18 | -3055823526 |
| Mar-18 | -3468022070 |
| Apr-18 | -3815156781 |
| May-18 | -3677888939 |
| Jun-18 | -4206266505 |
| Jul-18 | -4501404187 |
| Aug-18 | -4893819601 |
| Sept-18 | -5308531459 |
| Oct-18 | -5774003134 |
| Nov-18 | -5555558893 |
| Dec-18 | -6160582569 |
| Jan-19 | -6433087606 |
| Feb-19 | -6714928289 |
| Mar-19 | -5739137569 |
| Apr-19 | -5577919778 |
| May-19 | -5602280084 |
| Jun-19 | -4987207258 |
| Jul-19 | -5516432322 |
| Aug-19 | -5591308423 |
| Sept-19 | -5321323859 |
| Oct-19 | -5054599319 |
| Nov-19 | -4837119347 |
| Dec-19 | -4466633975 |
| Jan-20 | -3927342455 |
| Feb-20 | -3283119011 |
| Mar-20 | -3585492433 |
| Apr-20 | -2572435652 |
| May-20 | -1524660663 |
| Jun-20 | -1437934808 |
| Jul-20 | -317837615 |
| Aug-20 | 1003190198 |
| Sept-20 | 1180792917 |
| Oct-20 | 1753260004 |
| Nov-20 | 2540432196 |
| Dec-20 | 2390729502 |
| Jan-21 | 2056599075 |
| Feb-21 | 1955806778 |
| Mar-21 | 1250443377 |
| Apr-21 | 434338585 |
| May-21 | -383427977 |
| Jun-21 | -357858326 |
| Jul-21 | -1132778624 |
| Aug-21 | -2944680621 |
| Sept-21 | -3978379978 |
| Oct-21 | -4795039476 |
| Nov-21 | -5881480308 |
| Dec-21 | -7101796325 |
| Jan-22 | -7478775182 |
| Feb-22 | -8643423349 |
| Mar-22 | -9054356436 |
| Apr-22 | -9142775868 |
| May-22 | -9399448957 |
| Jun-22 | -10974425528 |
| Jul-22 | -12002459097 |
| Aug-22 | -12504087926 |
| Sept-22 | -12857725612 |
| Oct-22 | -13890680229 |
| Nov-22 | -14988705740 |
| Dec-22 | -14648989792 |
| Jan-23 | -15637483395 |
| Feb-23 | -15769439868 |
| Mar-23 | -16778441428 |
| Apr-23 | -17027213052 |
| May-23 | -17133860098 |
| Jun-23 | -16115730161 |
| Jul-23 | -15874687133 |
| Aug-23 | -15507231352 |
| Sept-23 | -15408398736 |
| Oct-23 | -14825375678 |
| Nov-23 | -13900560128 |
| Dec-23 | -13622800925 |
| Jan-24 | -12591733565 |
| Feb-24 | -12063965082 |
| Mar-24 | -9991591514 |
| Apr-24 | -10224197894 |
| May-24 | -10206319222 |
| Jun-24 | -9514456651 |
| Jul-24 | -9361882730 |
| Aug-24 | -9411216731 |
| Sept-24 | -9156845955 |
| Oct-24 | -9077975640 |
| Nov-24 | -8268808495 |
| Dec-24 | -7859991085 |
| Jan-25 | -7345176961 |
| Feb-25 | -6582617947 |
| Mar-25 | -6260836229 |
| Apr-25 | -5050996863 |
| May-25 | -4008811825 |
| Jun-25 | -4427090502 |
| Jul-25 | -4167083563 |
| Aug-25 | -3163776229 |
| Sept-25 | -2403778874 |
| Oct-25 | -2334549739 |
| Nov-25 | -2207859099 |
| Dec-25 | -2216829436 |
| Jan-26 | -2302489463 |
| Feb-26 | -3125056529 |
| Mar-26 | -3465512992 |
| Apr-26 | -3084487424 |
| May-26 | -3609367079 |
| Jun-26 | -3745552672 |
| Month | Exports | Imports |
| Jun-17 | 49873491508 | 53530298793 |
| Jul-17 | 50528773127 | 53742125258 |
| Aug-17 | 50834401328 | 53982204190 |
| Sept-17 | 51160043929 | 54085069256 |
| Oct-17 | 51791672041 | 54758679676 |
| Nov-17 | 52532859588 | 55999083412 |
| Dec-17 | 53625488161 | 56475966255 |
| Jan-18 | 53965184420 | 57251540961 |
| Feb-18 | 54395355682 | 57451179208 |
| Mar-18 | 54602966051 | 58070988121 |
| Apr-18 | 54860205151 | 58675361932 |
| May-18 | 55304076433 | 58981965372 |
| Jun-18 | 55490192916 | 59696459421 |
| Jul-18 | 56206201587 | 60707605774 |
| Aug-18 | 56493336022 | 61387155623 |
| Sept-18 | 56954044261 | 62262575720 |
| Oct-18 | 57226558637 | 63000561771 |
| Nov-18 | 57470599037 | 63026157930 |
| Dec-18 | 57251104265 | 63411686834 |
| Jan-19 | 57320341207 | 63753428813 |
| Feb-19 | 57583937302 | 64298865591 |
| Mar-19 | 58386241764 | 64125379333 |
| Apr-19 | 58900924296 | 64478844074 |
| May-19 | 59293597157 | 64895877241 |
| Jun-19 | 59378412551 | 64365619809 |
| Jul-19 | 58963308257 | 64479740579 |
| Aug-19 | 59050318141 | 64641626564 |
| Sept-19 | 59153331446 | 64474655305 |
| Oct-19 | 59330562863 | 64385162182 |
| Nov-19 | 59689705163 | 64526824510 |
| Dec-19 | 59899236281 | 64365870256 |
| Jan-20 | 60232430772 | 64159773227 |
| Feb-20 | 60412604751 | 63695723762 |
| Mar-20 | 60424643728 | 64010136161 |
| Apr-20 | 60267881085 | 62840316737 |
| May-20 | 59860029862 | 61384690525 |
| Jun-20 | 59923371349 | 61361306157 |
| Jul-20 | 59958852127 | 60276689742 |
| Aug-20 | 60267415950 | 59264225752 |
| Sept-20 | 59811824505 | 58631031588 |
| Oct-20 | 59608519266 | 57855259262 |
| Nov-20 | 59310670094 | 56770237898 |
| Dec-20 | 59352090268 | 56961360766 |
| Jan-21 | 58791158732 | 56734559657 |
| Feb-21 | 58648923039 | 56693116261 |
| Mar-21 | 58509007529 | 57258564152 |
| Apr-21 | 58727983912 | 58293645327 |
| May-21 | 59187764622 | 59571192599 |
| Jun-21 | 60317064345 | 60674922671 |
| Jul-21 | 61137731227 | 62270509851 |
| Aug-21 | 61130377632 | 64075058253 |
| Sept-21 | 61626437404 | 65604817382 |
| Oct-21 | 62203301840 | 66998341316 |
| Nov-21 | 62957144846 | 68838625154 |
| Dec-21 | 63494172023 | 70595968348 |
| Jan-22 | 64179336420 | 71658111602 |
| Feb-22 | 64623309414 | 73266732763 |
| Mar-22 | 65620086364 | 74674442800 |
| Apr-22 | 66238532811 | 75381308679 |
| May-22 | 67249624549 | 76649073506 |
| Jun-22 | 67320451696 | 78294877224 |
| Jul-22 | 67880911372 | 79883370469 |
| Aug-22 | 68799762323 | 81303850249 |
| Sept-22 | 70313919973 | 83171645585 |
| Oct-22 | 70886872314 | 84777552543 |
| Nov-22 | 71544229919 | 86532935659 |
| Dec-22 | 71970611821 | 86619601613 |
| Jan-23 | 72476808672 | 88114292067 |
| Feb-23 | 72353029898 | 88122469766 |
| Mar-23 | 72141630258 | 88920071686 |
| Apr-23 | 72569483052 | 89596696104 |
| May-23 | 72717557731 | 89851417829 |
| Jun-23 | 72672011431 | 88787741592 |
| Jul-23 | 71711512987 | 87586200120 |
| Aug-23 | 71402878992 | 86910110344 |
| Sept-23 | 70258409955 | 85666808691 |
| Oct-23 | 69672337565 | 84497713243 |
| Nov-23 | 69280620301 | 83181180429 |
| Dec-23 | 68620962133 | 82243763058 |
| Jan-24 | 68136465013 | 80728198578 |
| Feb-24 | 68854669181 | 80918634263 |
| Mar-24 | 68969169693 | 78960761207 |
| Apr-24 | 68673149211 | 78897347105 |
| May-24 | 68719391678 | 78925710900 |
| Jun-24 | 68567972772 | 78082429423 |
| Jul-24 | 69269795361 | 78631678091 |
| Aug-24 | 69130797935 | 78542014666 |
| Sept-24 | 69260320778 | 78417166733 |
| Oct-24 | 69512025393 | 78590001033 |
| Nov-24 | 69976656237 | 78245464732 |
| Dec-24 | 70797191828 | 78657182913 |
| Jan-25 | 72028232122 | 79373409083 |
| Feb-25 | 72849974491 | 79432592438 |
| Mar-25 | 73882412413 | 80143248642 |
| Apr-25 | 75265394153 | 80316391016 |
| May-25 | 75782612377 | 79791424202 |
| Jun-25 | 76239234143 | 80666324645 |
| Jul-25 | 76669987193 | 80837070756 |
| Aug-25 | 77602688743 | 80766464972 |
| Sept-25 | 78467180850 | 80870959724 |
| Oct-25 | 79292259622 | 81626809361 |
| Nov-25 | 79680759523 | 81888618622 |
| Dec-25 | 80521506478 | 82738335914 |
| Jan-26 | 80556657040 | 82859146503 |
| Feb-26 | 80452861208 | 83577917737 |
| Mar-26 | 80713609359 | 84179122351 |
| Apr-26 | 81285123115 | 84369610539 |
| May-26 | 82419671934 | 86029039013 |
| Jun-26 | 84026797987 | 87772350659 |
Text alternative for Goods exports and imports, June 2026 month compared with June 2025 month
The diagram shows goods exports and imports for the June 2026 month compared with the June 2025 month.
The trade balance is a surplus of $23 million. This is the difference between exports valued at $8.1 billion (up $1.6 billion or 25 percent) and imports valued at $8.1 billion (up $1.7 billion or 28 percent).
Export commodities that rose included: meat and edible offal, up $415 million (52 percent); milk powder, butter, and cheese, up $279 million (16 percent); preparations of milk, cereals, flour, and starch*, up $269 million (130 percent); aluminium and aluminium articles, up $97 million (74 percent).
Export commodities that fell included: crude oil**, down $36 million (38 percent); aircraft and parts, down $19 million (47 percent).
Import commodities that rose included: petroleum and products**, up $737 million (100 percent); electrical machinery and equipment, up $210 million (36 percent); mechanical machinery and equipment, up $190 million (23 percent); vehicles, parts, and accessories, up $97 million (12 percent).
Import commodities that fell included: food residues, wastes, and fodder, down $61 million (39 percent); books and newspapers, down $12 million (41 percent); tobacco and tobacco substitutes, down $11 million (41 percent).
*Includes infant formula. **Imports and exports of crude oil and petroleum and products fluctuate month to month based on individual movements.
Source: Stats NZ
More data
Use Infoshare to access time-series data for imports and exports (subject category: Imports and exports).
Overseas merchandise trade datasets has CSV data for goods imports and exports.
International trade: March 2026 quarter has information on trade in goods and services.
Definitions and metadata
Overseas merchandise trade - DataInfo+ provides the definitions of terms used in this release and general methodology used to produce overseas merchandise trade statistics.
Infoshare is being replaced by Aotearoa Data Explorer
Infoshare is being replaced by Aotearoa Data Explorer. Stay informed and get support with this change by joining our customer group at [email protected].
Technical enquiries
International accounts team
[email protected]
04 931 4600
ISSN 1178-0320
Next release
Overseas merchandise trade: July 2026 will be released on 21 August 2026.


