With the supply and price of critical agricultural inputs under considerable pressure due to supply chain disruptions, growers are advised to use soil testing and analysis to help manage their input fertiliser requirements.
By more accurately assessing soil reserves and crop requirements, growers can ensure they don't over supply expensive fertiliser and maximise their return on investment.
Soil testing is strongly recommended as the best way to measure and map fertiliser requirements across paddocks. Testing can provide a baseline measure of nutrients and ground-truth indications derived from yield maps and grain analysis for more accurate matching of crop requirements with fertiliser.
Fertiliser types
The most common sources of phosphorus (P) fertiliser in broadacre farming systems are mono-ammonium phosphate (MAP) and di-ammonium phosphate (DAP).
Both products provide nitrogen (N) as well as P, making them a productive choice for starting the growing season. MAP provides P at 21.8 per cent and N at 10 per cent, while DAP provides P at 20 per cent and N at 18 per cent.
Australian grain growers use a range of N fertilisers, with urea being the most common. A high N content of 46 per cent makes urea ideal for soil application banded at a suitable depth before planting, banded away from the seed at planting, and for topping up soil N as the growing season unfolds.
Other options include urea ammonium nitrate or UAN (42 per cent N), ammonium sulphate (21 per cent N and 24 per cent sulphur) and anhydrous ammonia (82 per cent N).
Price and supply factors
The reasons behind current pressures on fertiliser are global and complex, but the bottom line is Australian growers are expecting to see N and P fertiliser costs continue to increase during 2022.
Fertiliser considerations
Incitec-Pivot agronomist Jim Laycock says growers should consider how different fertilisers will interact with their soils and crops.
"Phosphorus does not move in the soil, so it must be applied directly into the root zone before or at seeding," he says.
"In an ideal world where soil P levels are optimum or above critical values, I would recommend applying banded starter fertilisers below and to the side of the seed at planting," Mr Laycock says.
"Where this isn't possible, when banding MAP or DAP at planting a grower should reference the seed bed utilisation percentage and apply fertiliser at rates to suit the crop type, soil type, row spacing and soil moisture."
"Canola seed is particularly sensitive to N fertiliser placed close to the seed at planting, and N rates should be kept to a minimum to avoid toxicity."
Nitrogen needs to be available to plants from germination. Measuring deep soil nitrate nitrogen before planting will identify plant available soil nitrogen levels. Where soil nitrogen levels are low (e.g. after a couple of cereal crops), nitrogen may need to be applied at sowing. Where there are moderate to high soil nitrogen levels (e.g. following a legume and/or a wet summer), additional nitrogen may be omitted at sowing and can be applied in crop depending on seasonal conditions and soil water.
Trials in Australia have shown little consistent difference in yield response between N fertiliser types, Therefore, aside from agronomic concerns, selection can largely be based on economic factors such as price, transport, handling and storage logistics.

Start with harvest data and soil tests
Nitrogen and P are removed from paddocks in large quantities with each grain or hay harvest. As a result, these need to be replaced to ensure the success of each subsequent growing season (Table 1).
Basing your fertiliser rates on nutrient removal rates is a useful starting point, especially if the soil nutrient levels were favourable. But this approach is prone to errors because of inefficiencies in fertiliser use (for example, P fixation by the soil) and variations in crop yield potential between one season and the next.
While harvest data such as yield and grain analysis can be used to estimate nutrient removals (Table 1), soil testing will provide a measure of soil nutrient levels which should be available to the crop.
Table 1. Estimated nutrient removal in harvested grain (J Laycock)
Mean Nutrient Concentration (kg/t) |
|||||||
Species |
Grain Moisture (%) |
N |
P |
K |
S |
Ca |
Mg |
Barley |
11 |
* |
2.7 |
4.3 |
1.2 |
0.37 |
1 |
Oats |
11 |
16 |
2.7 |
4.0 |
1.4 |
0.6 |
1.2 |
Sorghum |
10 |
17 |
2.3 |
3.3 |
2.4 |
0.5 |
1.4 |
Triticale |
11 |
16 |
2.4 |
4.4 |
1.0 |
0.31 |
1.0 |
Wheat |
11 |
20 |
2.6 |
3.6 |
1.4 |
0.38 |
1.2 |
Chickpea |
10 |
33 |
3.8 |
9.1 |
1.8 |
1.5 |
1.4 |
Faba bean |
10 |
38 |
3.6 |
9.7 |
1.6 |
1.1 |
1.1 |
Field pea |
10 |
35 |
3.6 |
9 |
2.1 |
0.8 |
1.5 |
Lentil |
10 |
37 |
3.3 |
8.2 |
1.4 |
0.9 |
1.4 |
Lupin |
9 |
48 |
3.2 |
8.3 |
2.6 |
2.3 |
1.8 |
Canola |
8.5 |
31 |
5.1 |
7.4 |
5 |
3.9 |
2.8 |
Yield maps are a useful guide to which zones within the paddock should be soil tested. Biomass imagery of crop growth can also be used to map high and low performing paddock zones. Soil testing in zones of below average vigour, yield or grain protein may help identify a nutrient deficiency that can be remedied with variable rate fertiliser application.
Paddock-wide soil testing or grid sampling will define a more complete variable rate application map that ensures fertiliser is only applied at the rate required in each zone, whether that is above or below the overall average. Note that this may not reduce the total fertiliser required but it will ensure the application is better optimised.
Soil testing guidelines
Mr Laycock recommends working with an agronomist to assess harvest data, plan a soil testing strategy and interpret the laboratory results.
"Agronomists can help design a soil testing strategy and develop a fertiliser application plan based on soil test results, crop rotation and published optimum values," he says.
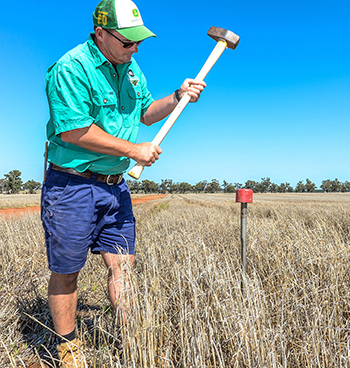
A pogo stick or tube soil corer is suitable for sampling surface soils. Sampling the top 10 centimetres is currently the standard for surface sampling broadacre winter crops for most nutrients.
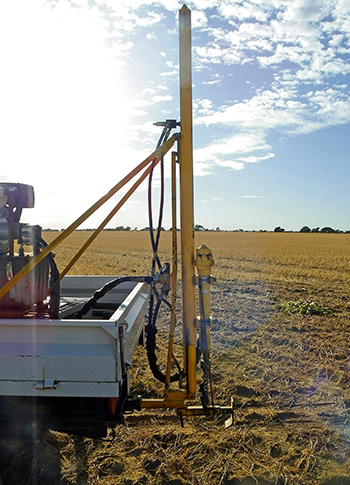
Nitrate N and sulphur, being more mobile in the soil, also require deep core testing using a hydraulic corer or similar device.
Each zone should be specifically targeted. If the paddock is small and relatively uniform, soil tests can be taken at regular intervals across the paddock.
Laboratory soil tests will measure the amount of plant available nutrient and indicate whether supplemental fertiliser is needed. If soil is found to have a nutrient deficiency, a positive yield response to fertiliser is considered highly likely (in the presence of adequate water).
"There are well-established critical values for P, N, potassium, sulphur and trace elements across a wide range of crop types and soil types," Mr Laycock says.
"It means soil test results can be used to assess fertiliser requirements with confidence."
Determining crop nitrogen demand
- Set a yield potential or target at the start of the season, based on soil water at sowing, average wheat yield or 'average plus a bit' depending on your optimism, paddock history and forecast seasonal conditions.
- Calculate the total amount of N required to reach your yield target. Target 11-12% grain protein in wheat. The GRDC's A Nitrogen Reference Manual For The Southern Cropping Region suggests some formulae for doing this. As a rule of thumb, you need 40kg soil N per tonne of wheat production and double that for canola assuming the plant accesses 50% of the soil N.
- Deep soil test for nitrogen to identify nitrate N soil levels. Sampling to 90 or 120cm is recommended and, if deep sampling hasn't been done before, include segment samples to identify any sub-soil constraints such as chloride or sodicity at depth.
- The difference between the crop demand for N and the soil supply needs to be provided by fertiliser. However, not all of the fertiliser N is available to the crop, as some may be lost (e.g. due to volatilisation or leaching) or may be carried over in the soil at the end of the season. Hence the fertiliser rate needs to be increased. An efficiency factor of 50% is common (i.e. doubling the rate).
Alternatives to mineral fertiliser
If farmers find their soil N levels are low, bringing a grain legume or vetch crop into the rotation may be an option, according to Mr Laycock,
"Where starting soil nitrate levels are low, legumes can be effective at fixing N from the atmosphere and providing carryover soil N for following rotations," he says.
"The grain legume crop will also provide a break crop benefit and carryover organic N for the following one or possibly two crops in the rotation.
"However, high yielding grain legumes can also remove a large amount on N in the grain (Table 2)."
Table 2. Nitrogen fixation and grain take-off for important legume crops. (A Nitrogen Manual for the Southern Cropping Region, GRDC, August 2020)
Crop |
Grain protein (%) |
Grain N (kg/t) |
Crop total N (kg/t grain) |
N fixed (%) |
Residue N (kg/t grain) |
Lentil |
24 |
37 |
87 |
50 |
50 |
Faba bean |
24 |
37 |
87 |
75 |
50 |
Field pea |
23 |
37 |
87 |
60 |
50 |
Lupin |
32 |
50 |
130 |
75 |
80 |
Chickpea |
22 |
34 |
100 |
50 |
66 |
At this stage there is no equivalent process for enhancing soil P biologically, but farmers may find its lack of movement can work to their advantage.
"Where P application rates exceed removal rates, P levels will increase over time on most soil types," Mr Laycock says.
"If soil test levels exceed critical values for the crop type in the rotation, it may be possible to reduce rates of phosphorus-based starter fertiliser and reduce some of that plant-available P in the soil.
"Again, soil testing will identify if soil P is above the critical value."
Organic fertilisers such as feedlot manure and chicken litter can also provide P, N and other macro and micro elements. However, it is important to know the nutrient analysis, moisture content and application rate.
"Depending on nutrient content and plant availability, these products may need to be applied at high rates to be an effective replacement for chemical fertilisers," Mr Laycock says.
Summer weed control
Significant spring and summer rainfall across the northern growing region and La Niña conditions predicted to continue should result in soils retaining good starting moisture for seeding.
Moisture is essential for N mineralisation, or the release of N from the break-down of organic matter. However, moisture and N will also encourage summer weeds.
Growers can help improve mineralisation potential over summer by maintaining stubble cover and keeping paddocks weed free. This will ensure fallow weeds do not deplete soil moisture to a level that restricts microbial activity and potential N mineralisation.
Timing is everything
Phosphorus is needed as soon as the seed germinates, so fertiliser P needs to be applied before or at seeding. In contrast, N inputs can be managed throughout the growing season in response to rainfall patterns and stored soil moisture.
Under current conditions, it is essential to gain a good understanding of your farm's projected fertiliser needs based on your cropping program, soil types, soil moisture, rainfall projections, yield expectations and existing soil nutrient reserves or deficiencies.
Early soil testing, forward planning and advance ordering will help ensure sufficient fertiliser, especially N products, will be on hand when they are required.


