UConn researchers reveal the volatile 'heartbeat' of the planet
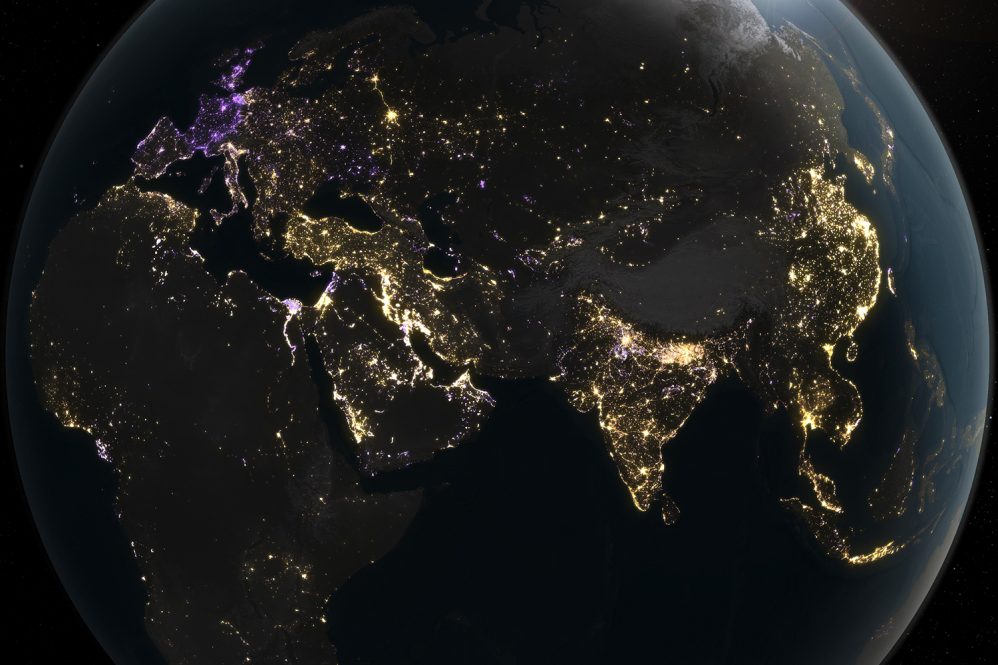
(Photo courtesy of Michala Garrison/NASA Earth Observatory)
From space, Earth's populated areas glow on the otherwise "black marble" of the planet at night. For decades, scientists assumed this glow was steadily increasing as the world developed. However, a new study published in Nature flips this narrative. Led by researchers from the University of Connecticut, alongside NASA and a team of scientists from the United States and Germany, the study reveals that our global nighttime light is a volatile, high-frequency reflection of global human development, resilience, and turmoil, capturing the immediate impacts of shocks like the war in Ukraine, the COVID-19 pandemic, and energy crises in Europe. The researchers are part of NASA's Black Marble science team, and they used satellite data to study global nighttime lighting change from 2014 through 2022.
The 'Heartbeat' of Global Crisis
In the past, researchers relied on yearly or monthly averages of satellite light data, which smoothed over short-term events, and mixed signals from both gradual and abrupt changes. The UConn and NASA team developed a novel algorithm to analyze the Earth's night light daily. This high-frequency approach revealed distinct patterns of human behavior that were previously invisible, such as conflict and crisis, pandemic response, and energy policy shifts. This study found that global nighttime radiance has surged by 34%, yet dimming events simultaneously erased 18% of that gain, revealing a planet far more turbulent than previously thought. Additionally, this global "flickering" - the volatile push-and-pull between sudden dimming and rapid brightening – has intensified substantially since 2020.
The data captured sharp, sustained dimming in Ukraine corresponding with the Russian invasion, as well as distinct dimming signatures in Syria and Yemen due to prolonged conflict. This study captures the precise timing and extent of COVID-19 lockdowns across Asia and the rest of the world. While much of the world brightened, Europe showed a sharp dimming trend, reflecting continuous aggressive energy-saving measures and policy interventions in the past decade.
"We can view these dynamics as the heartbeat of society," says Zhe Zhu, associate professor and director of the Global Environmental Remote Sensing (GERS) Laboratory at UConn's Department of Natural Resources and the Environment. "With this daily data, we can see the impacts of shocks. We see how society responds to major disruptions. The dimming is not always a sign of poverty or decline; sometimes, as we saw in Europe, it is a sign of adaptation and government policy working in real-time."
This video shows the annual nighttime light change area of Earth, capturing human activity of the planet through the emissions of artificial light. Derived from satellite imagery taken daily over the past decade, this study maps the dynamics of the human night-time activity, with golden areas experiencing brightening, purple areas featuring dimming, and white areas experiencing both. This interactive nighttime light map helped create this video. (Kel Elkins/NASA's Scientific Visualization Studio).
Seeing the Signal Through the Noise
The discovery was made possible by a massive dataset from NASA's Black Marble science team. Historically, researchers struggled with "noise" in nighttime light data from moonlight, atmosphere, aurora, or the viewing angle of the satellite. The Black Marble dataset greatly reduced most of this noise, except for the view angle differences.
To find the true signal, lead author Tian Li Ph.D. '25 and Zhu developed the VZA-COLD algorithm that addressed the view angle impacts. "If you look at a building from directly above, you see less light than if you look from the side through the windows," Zhu explains. "The satellite sweeps back and forth, creating variations that look like changes but are just differences in viewing angles".
"With this daily data, we see a lot of the signal that previously was almost invisible," says Li. "We use multiple consecutive observations to confirm the changes are not just noise. There must be a sustained anomaly to confirm that something is really changing. As a result, we confidently say most of these changes are caused by human activities that either turn the light up or down. Did the dimming happen because of environmental policy, an economic crisis, or a power grid failure? These distinctions are significant. Our data allows us to finally ask and answer these questions."
A Fresh Look at Nighttime Light
For decades, researchers treated the Earth's nighttime glow as a slow-moving map of urban sprawl or economic growth. This high-frequency satellite data changes everything, transforming a static map into a live broadcast of human history. The researchers have captured the massive surge of new development in growing nations, alongside the sudden, dark shocks of armed conflicts and natural disasters.
Crucially, the data reveals a complex spectrum of human response. In highly developed regions, a dimming map often reflects proactive adaptation, such as energy conservation or smart LED transitions. However, for less developed countries, this daily tracking serves as a vital lifeline. When a sudden blackout occurs due to a natural disaster, economic collapse, or escalating conflict, this real-time satellite data empowers the international community to instantly pinpoint the crisis. This allows for faster, highly targeted deployments of humanitarian aid precisely where and when it is needed most. Ultimately, this daily vantage point gives us a powerful new ability to direct relief, validate policies, and understand how global societies build, adapt, and survive.


