Update 4pm Friday 23 September
Flood Watch
The Bureau of Meteorology issed Flood Warning number 7 for the Macleay River at 1.41pm EST on Friday 23 September 2022 saying a moderate flood peak is expected Saturday morning at Kempsey.
MODERATE FLOODING POSSIBLE AT KEMPSEY, MINOR OCCURRING AT GEORGES CREEK AND BELLBROOK
Minor flooding is occurring at Georges Creek and likely at Bellbrook and Kempsey.
The Macleay River at Georges Creek peaked at 7.43 metres, with minor flooding, around 07:00 am Friday 23 September and is currently at 6.85 metres and falling with minor flooding. The Macleay River at Georges Creek may fall below the minor flood level (6.00 m) around 06:00 pm Friday.
The Macleay River at Bellbrook is currently at 6.84 metres and near its peak with minor flooding. Kempsey Shire Council have determined that the Bellbrook gauge is underestimating flood levels by approximately 0.5m metres. This correction has already been applied to this peak reading.
The Macleay River at Kempsey (AHD) is likely to exceed the minor flood level (4.50 m) overnight Friday into Saturday. The river level may reach the moderate flood level (5.70 m) Saturday morning. Further rises are possible.
For up to date information check the Bureau's Flood Warnings Summary page.
Stuarts Point pumping
• There was significant rainfall in Stuarts Point overnight into Friday with the local gauge reading approximately 70mm.
• Pumping commenced on Thursday evening in order to mitigate the impact of waterlevels rising.
• Fire & Rescue trucks and NSW SES volunteers are monitoring the situation and have provided sandbags.
• Staff are on standby to establish and run the pumps.
Groundwater levels
The level at Bore 1 is currently RISING and measured 4.410m AHD at 4pm 23/9/22 up from 4.33m at 8am.
The March 2021 peak was 5.42m AHD.
The March / April 2022 peak was 5.57m AHD.
Council staff and emergency services are monitoring the situation on the ground and through groundwater level monitors.
Residents should monitor conditions at their own properties and act accordingly.
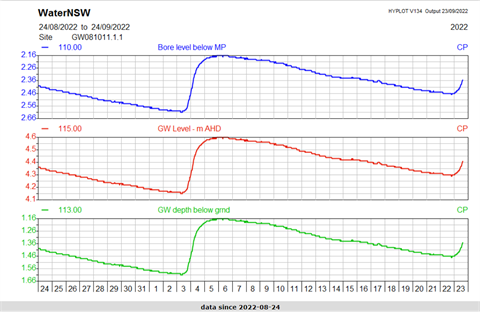
Readings taken at 4pm Friday 23 September 2022

How to read this diagram
The diagram shows the groundwater level for the past 30 days. The three graphs essentially present the same data but each with relation to a different reference point (or datum).
- The blue graph shows the depth of water below the Mount Point, which is where the laser that takes the reading is mounted.
- The red graph shows the height of the water above the Australian Height Datum (AHD) which is the official height metric based on the average of sea levels from 1966-68.
- The green graph shows the depth of the water below ground level at the location of the meter.
What should you do?
Please do not drive, ride, walk or play in floodwater or surface water as it may pose a health risk.
If groundwater is covering household septic tanks, please minimise use of water in your homes, especially showers and toilets.